September was a calm month across Venus markets. Liquidations declined 99% in value month over month, while collateral assets appreciated across the board.
Looking forward, BTC-collateralized positions are Venus users' main risk sensitivity. A 30% drop in BTC alone would put $88M of collateral at risk, against $51M if all volatile assets fell together.
Through September, protocol supply reached $1.72B while debt declined 7.2% to $406M. On the growth front, Venus added Centrifuge's tokenized Treasuries and CLOs to the USDT Liquidity Hub and queued an opt-in ETH E-mode group to facilitate the leverage looping trade.
1. Market Context & BNB Price
-
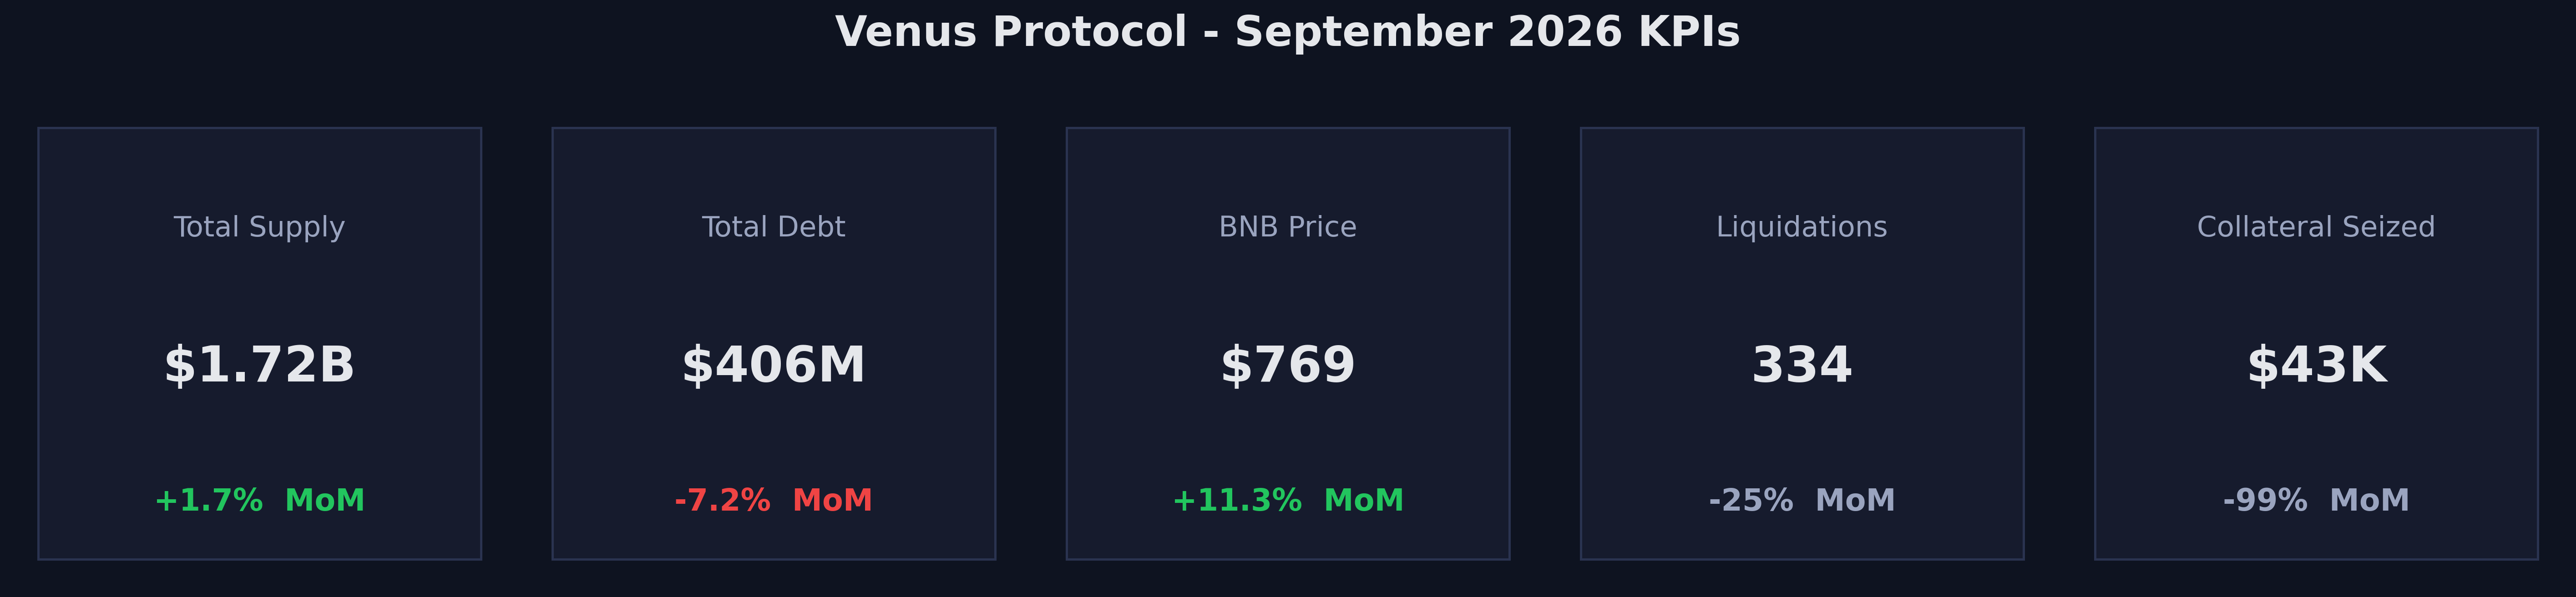
Total Supply: $1.72B (+1.7% MoM)
-
Total Debt: $406M (-7.2% MoM)
-
BNB Price: $769 (+11.3% MoM)
-
Liquidations: 334 events (-25% MoM)
-
Collateral Seized: $42.8K (-99% MoM)
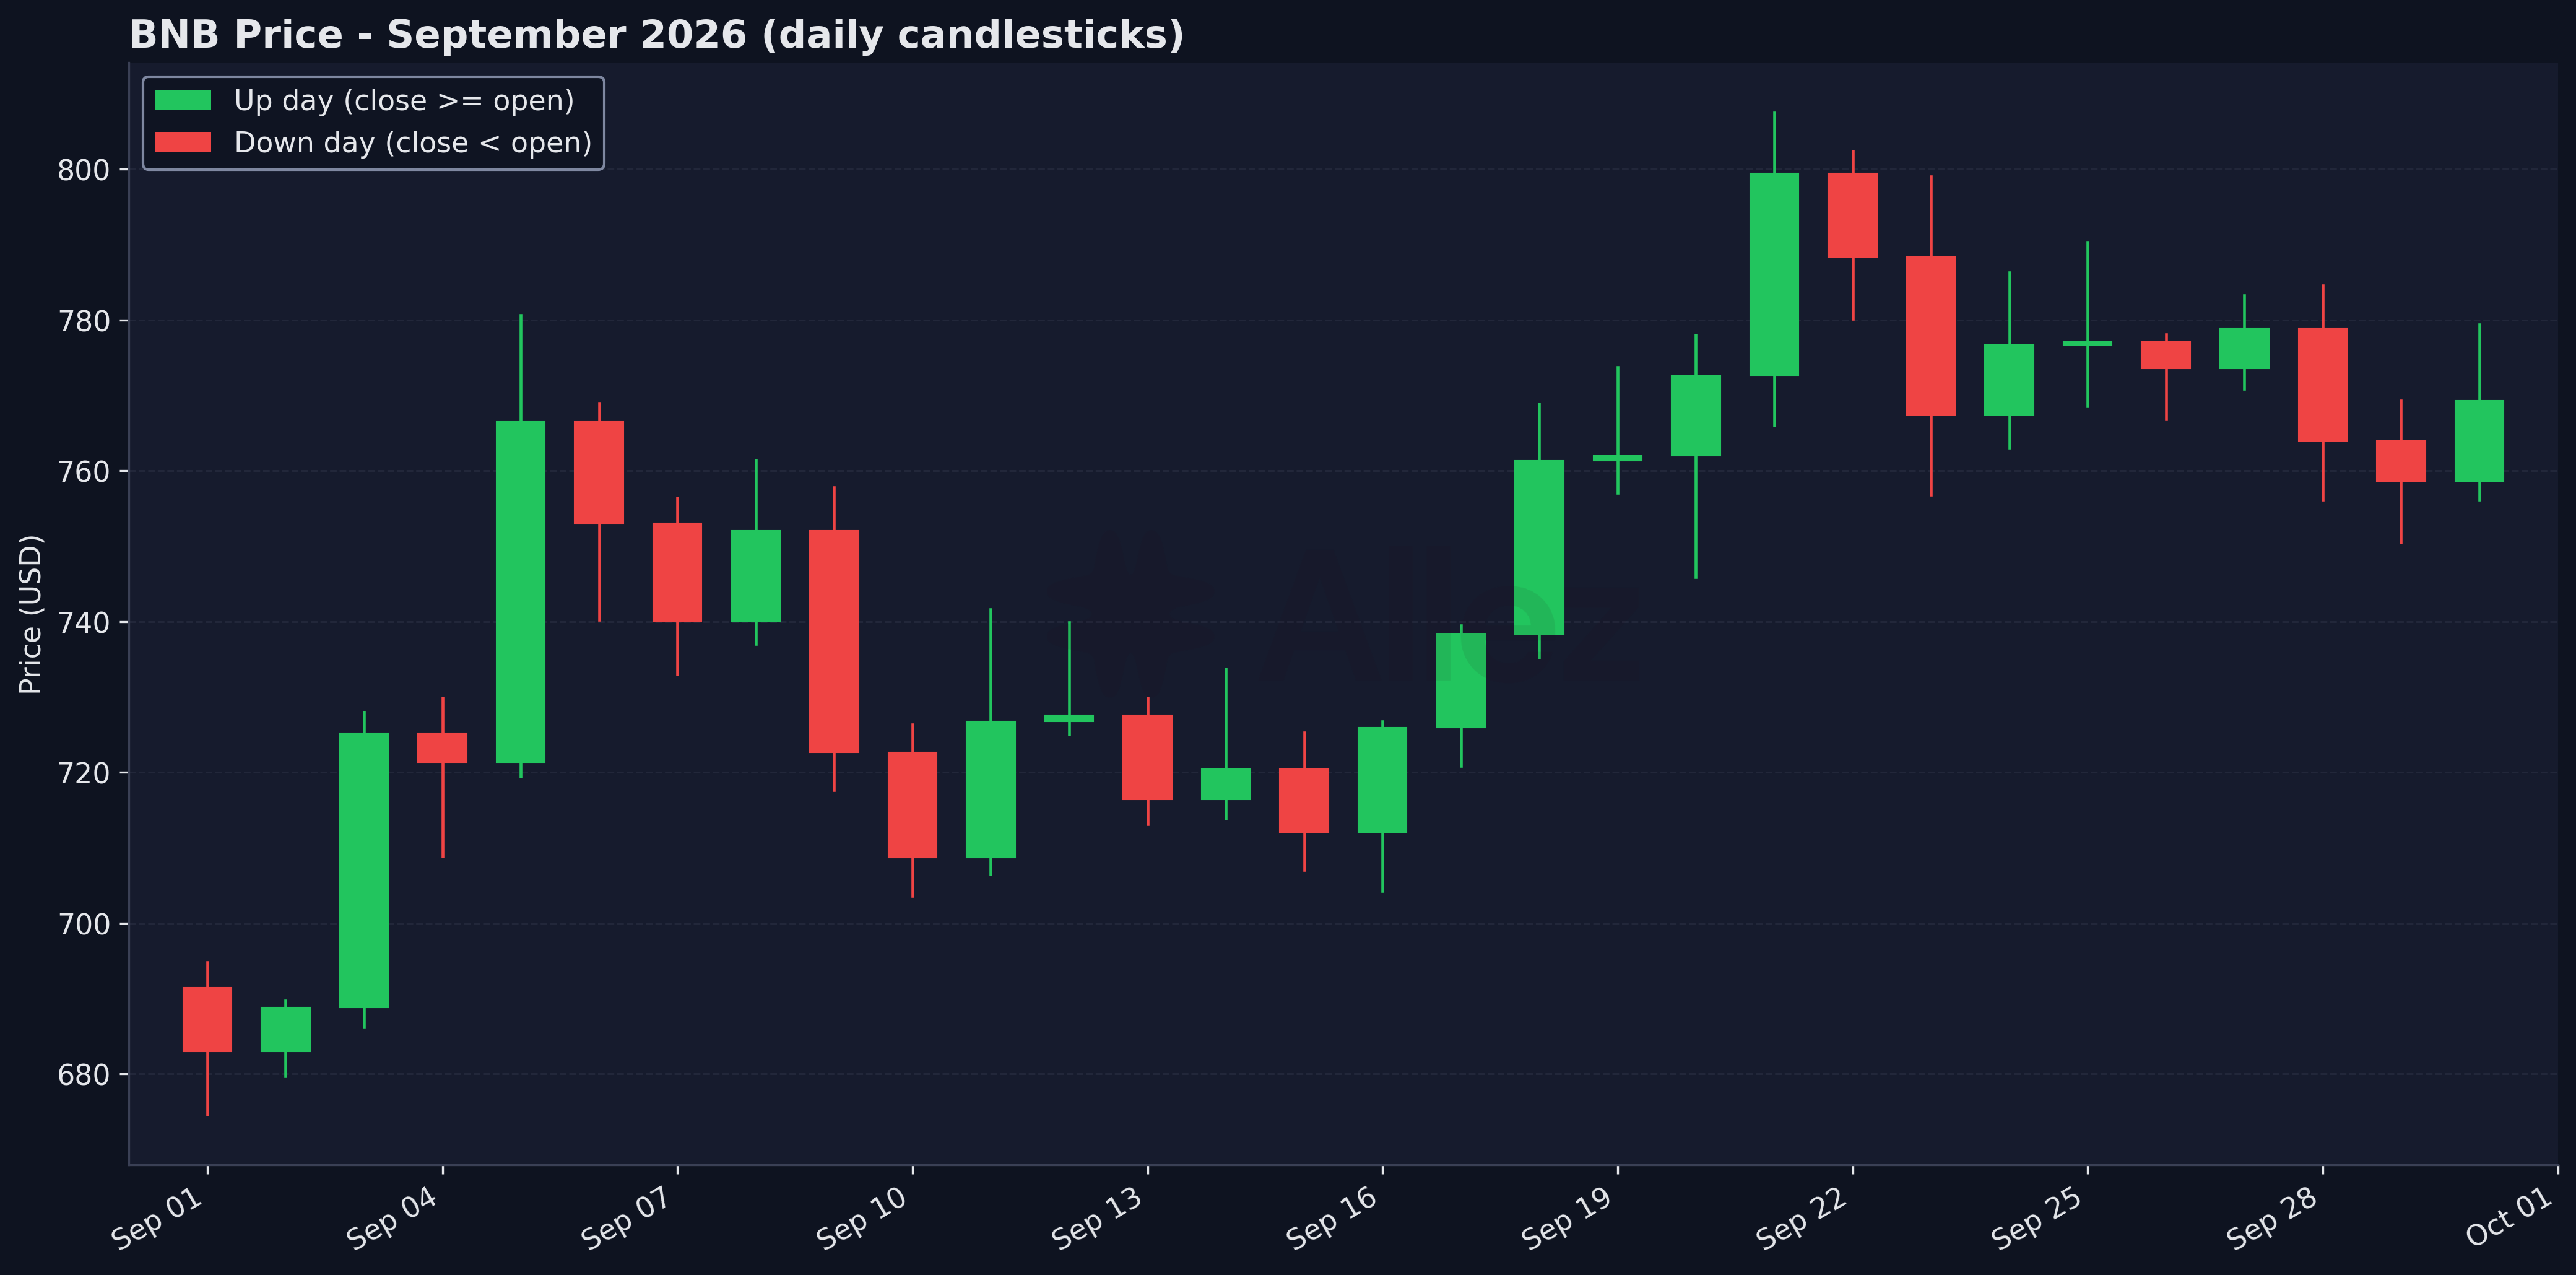
BNB opened September at $691, set its low of $675 on September 1, peaked at $807 on September 21 and closed at $769 (+11.3%). BTC and ETH rose 6.5% and 8.8% respectively.
Venus Ecosystem Updates:
-
VIP-663 (executed September 28). TRX and lisUSD moved to the next stage of deprecation, following the August DeviationSentinel reviews.
-
VIP-662** (executed September 21).** Atlas moved from fallback to pivot oracle on 13 Core Pool markets and became VAI's only price source. VAI Vault rewards stopped as the first step of winding VAI down.
-
VIP-661** (executed September 21).** The USDT Liquidity Hub added two Centrifuge funds, JTRSY (US Treasuries) and JAAA (AAA-rated CLOs).
-
ETH E-Mode proposal** (VIP-664, queued).** Proposal to add an ETH E-mode to support higher-leverage ETH LST looping.
-
bStock borrow incentives** (September 23 to October 14).** Merkl rewards on USDT and U borrowed against bStock collateral.
-
Other. VIP-660 allocated $80K of September Prime rewards (September 6); Venus joined the BNB Chain bug bounty, up to $100K per critical finding (September 9); and the 1M USDT Fixed-Term Vault matured on September 30 with a 4.2% realized APR.
2. Supply & Market Overview
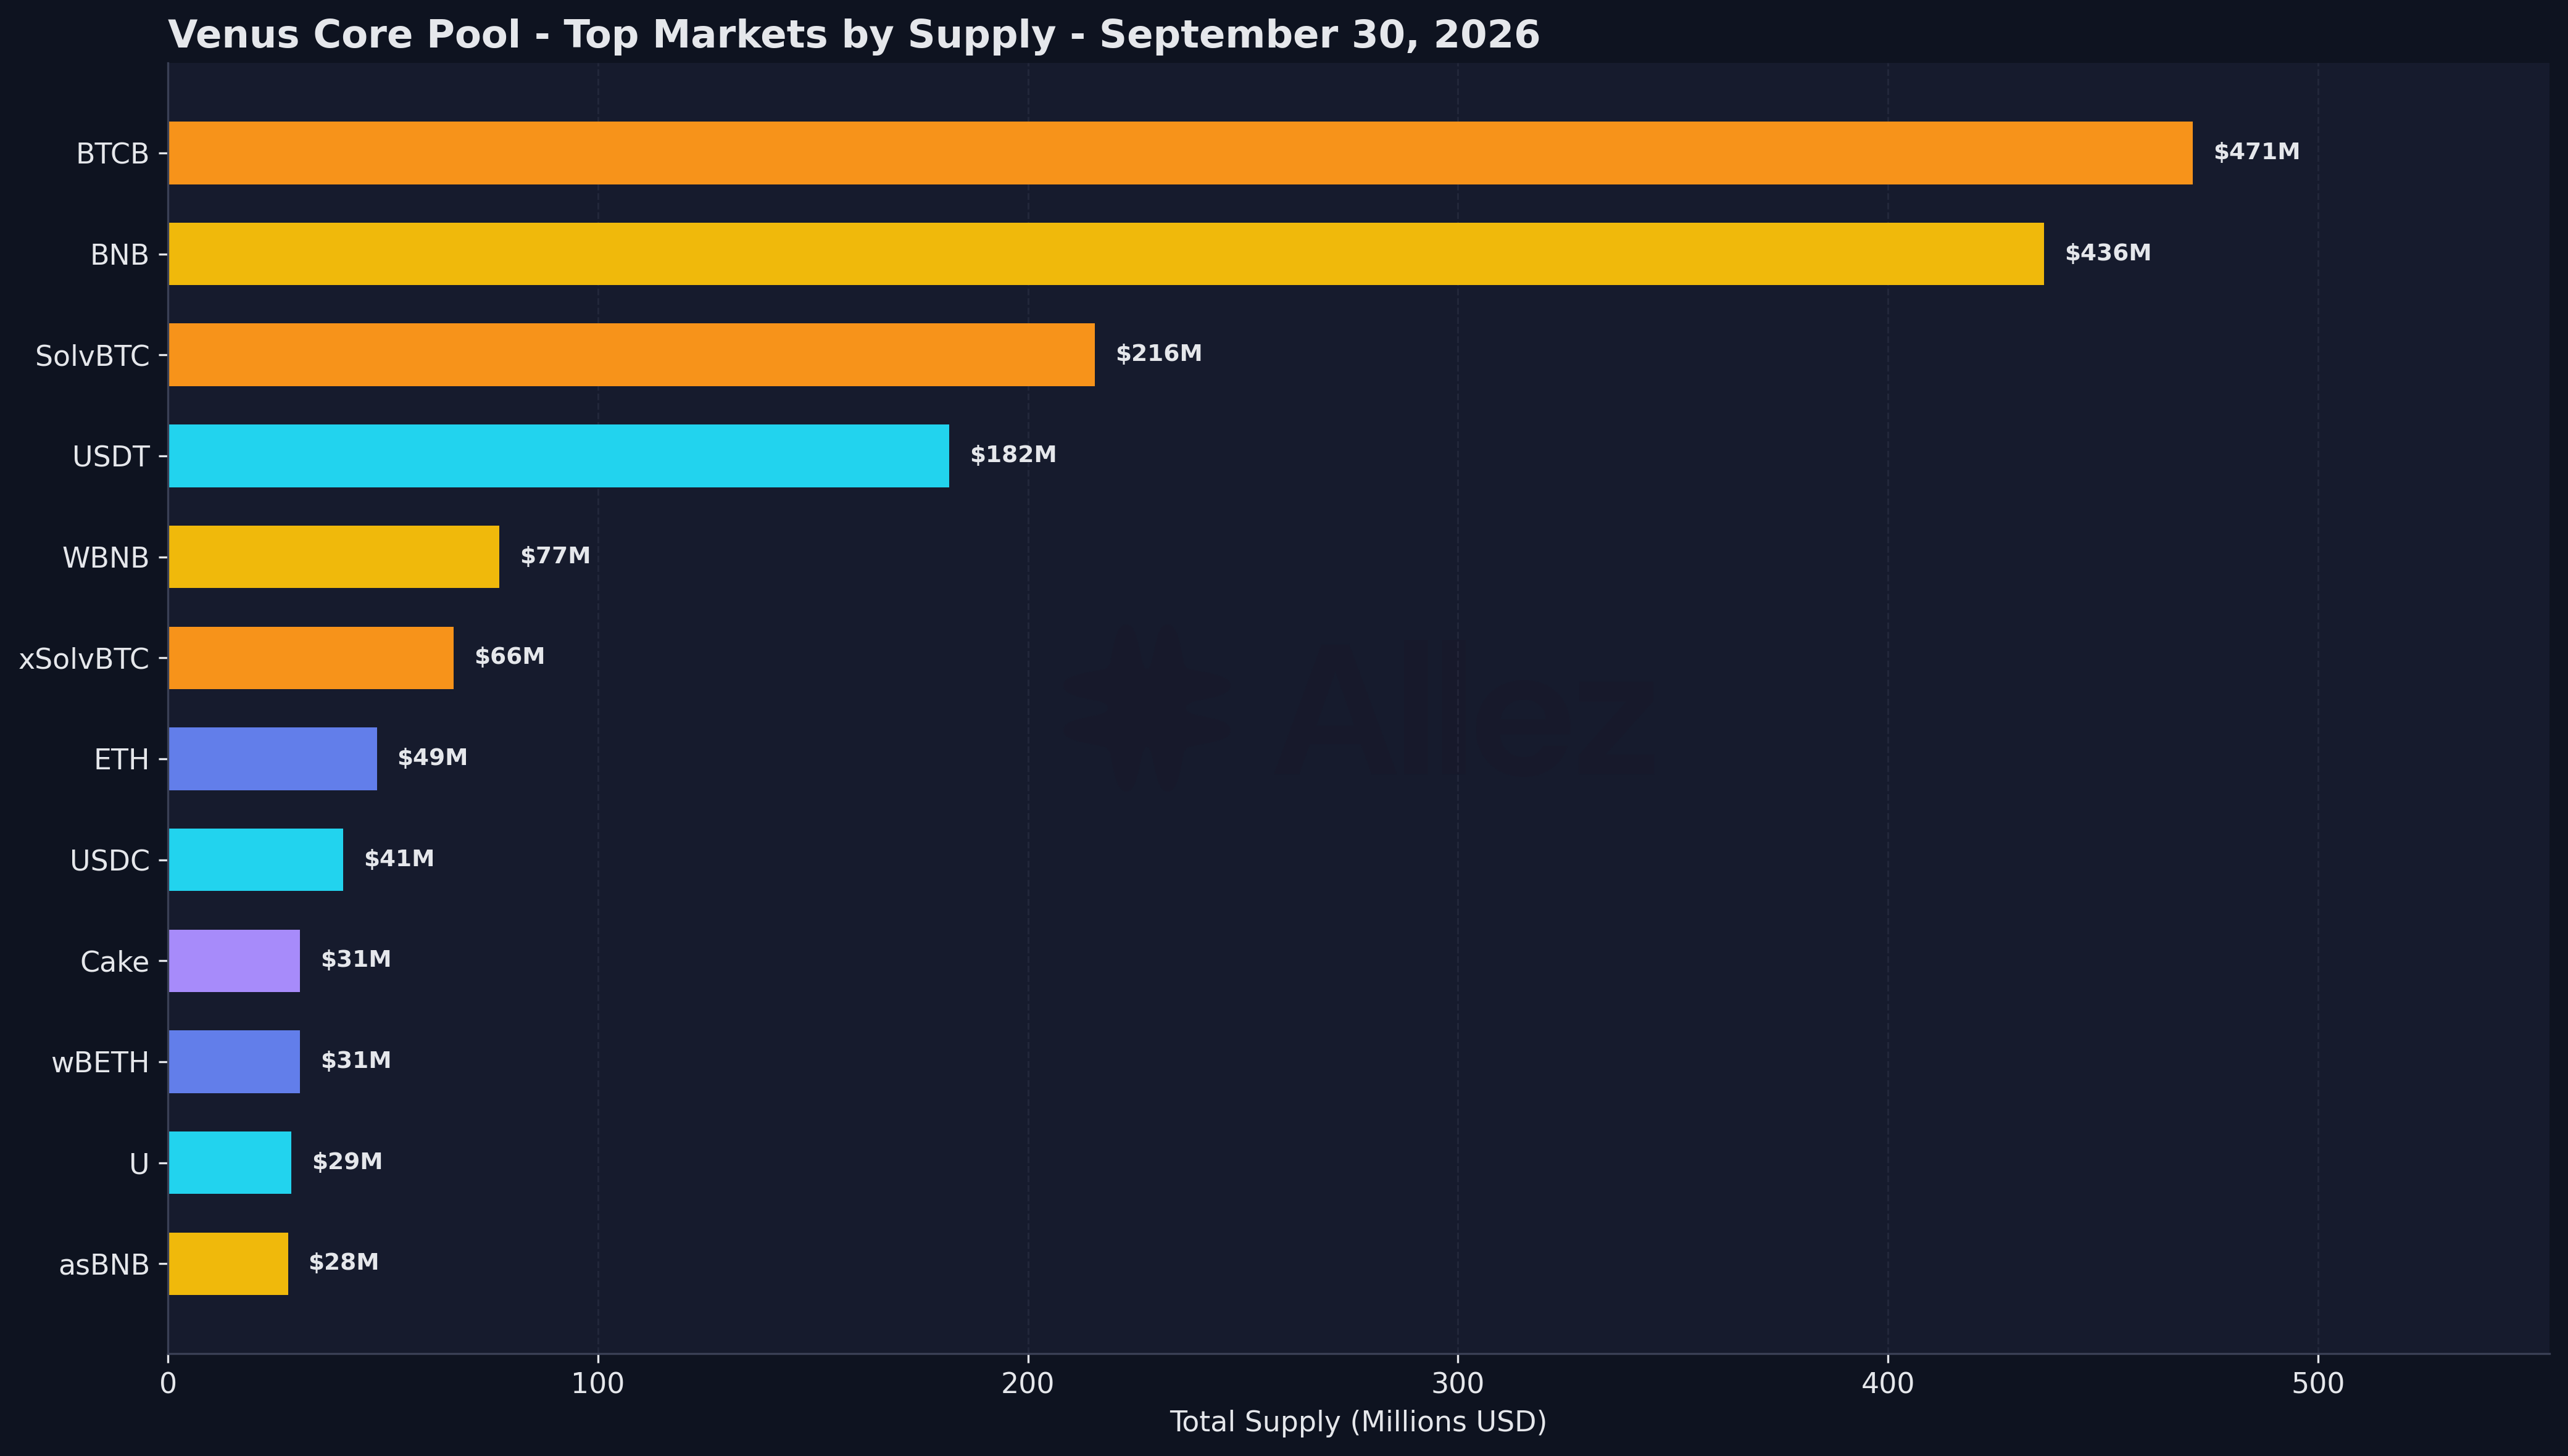
Top markets by supply (September 30, 2026):
| Market | Supply | MoM | Token MoM | Debt | Utilization |
|---|---|---|---|---|---|
| BTCB | $470.9M | +2.0% | -4.2% | $113.7M | 24.1% |
| BNB | $436.3M | +10.3% | -0.9% | $55.8M | 12.8% |
| SolvBTC | $215.5M | +6.5% | 0.0% | $0.2M | 0.1% |
| USDT | $181.7M | -4.9% | -4.9% | $135.0M | 74.3% |
| WBNB | $77.0M | +3.8% | -6.8% | $8.1M | 10.5% |
| xSolvBTC | $66.5M | +6.4% | 0.0% | $0.0M | 0.0% |
| ETH | $48.6M | +3.2% | -5.1% | $34.6M | 71.2% |
| USDC | $40.7M | -17.6% | -17.6% | $31.2M | 76.7% |
| Cake | $30.7M | +27.3% | -9.0% | $0.2M | 0.8% |
| wBETH | $30.7M | +18.8% | +9.0% | $0.7M | 2.4% |
Total supply rose 1.7% to $1.72B: price gains added $136M and net withdrawals, valued at month-end prices, were $107M. More than half of the withdrawals came from one market, asBNB ($58.5M). SolvBTC and xSolvBTC balances held steady, and wBETH (+9.0% of tokens, $2.5M) and U (+7.2%, $1.9M) drew new deposits.
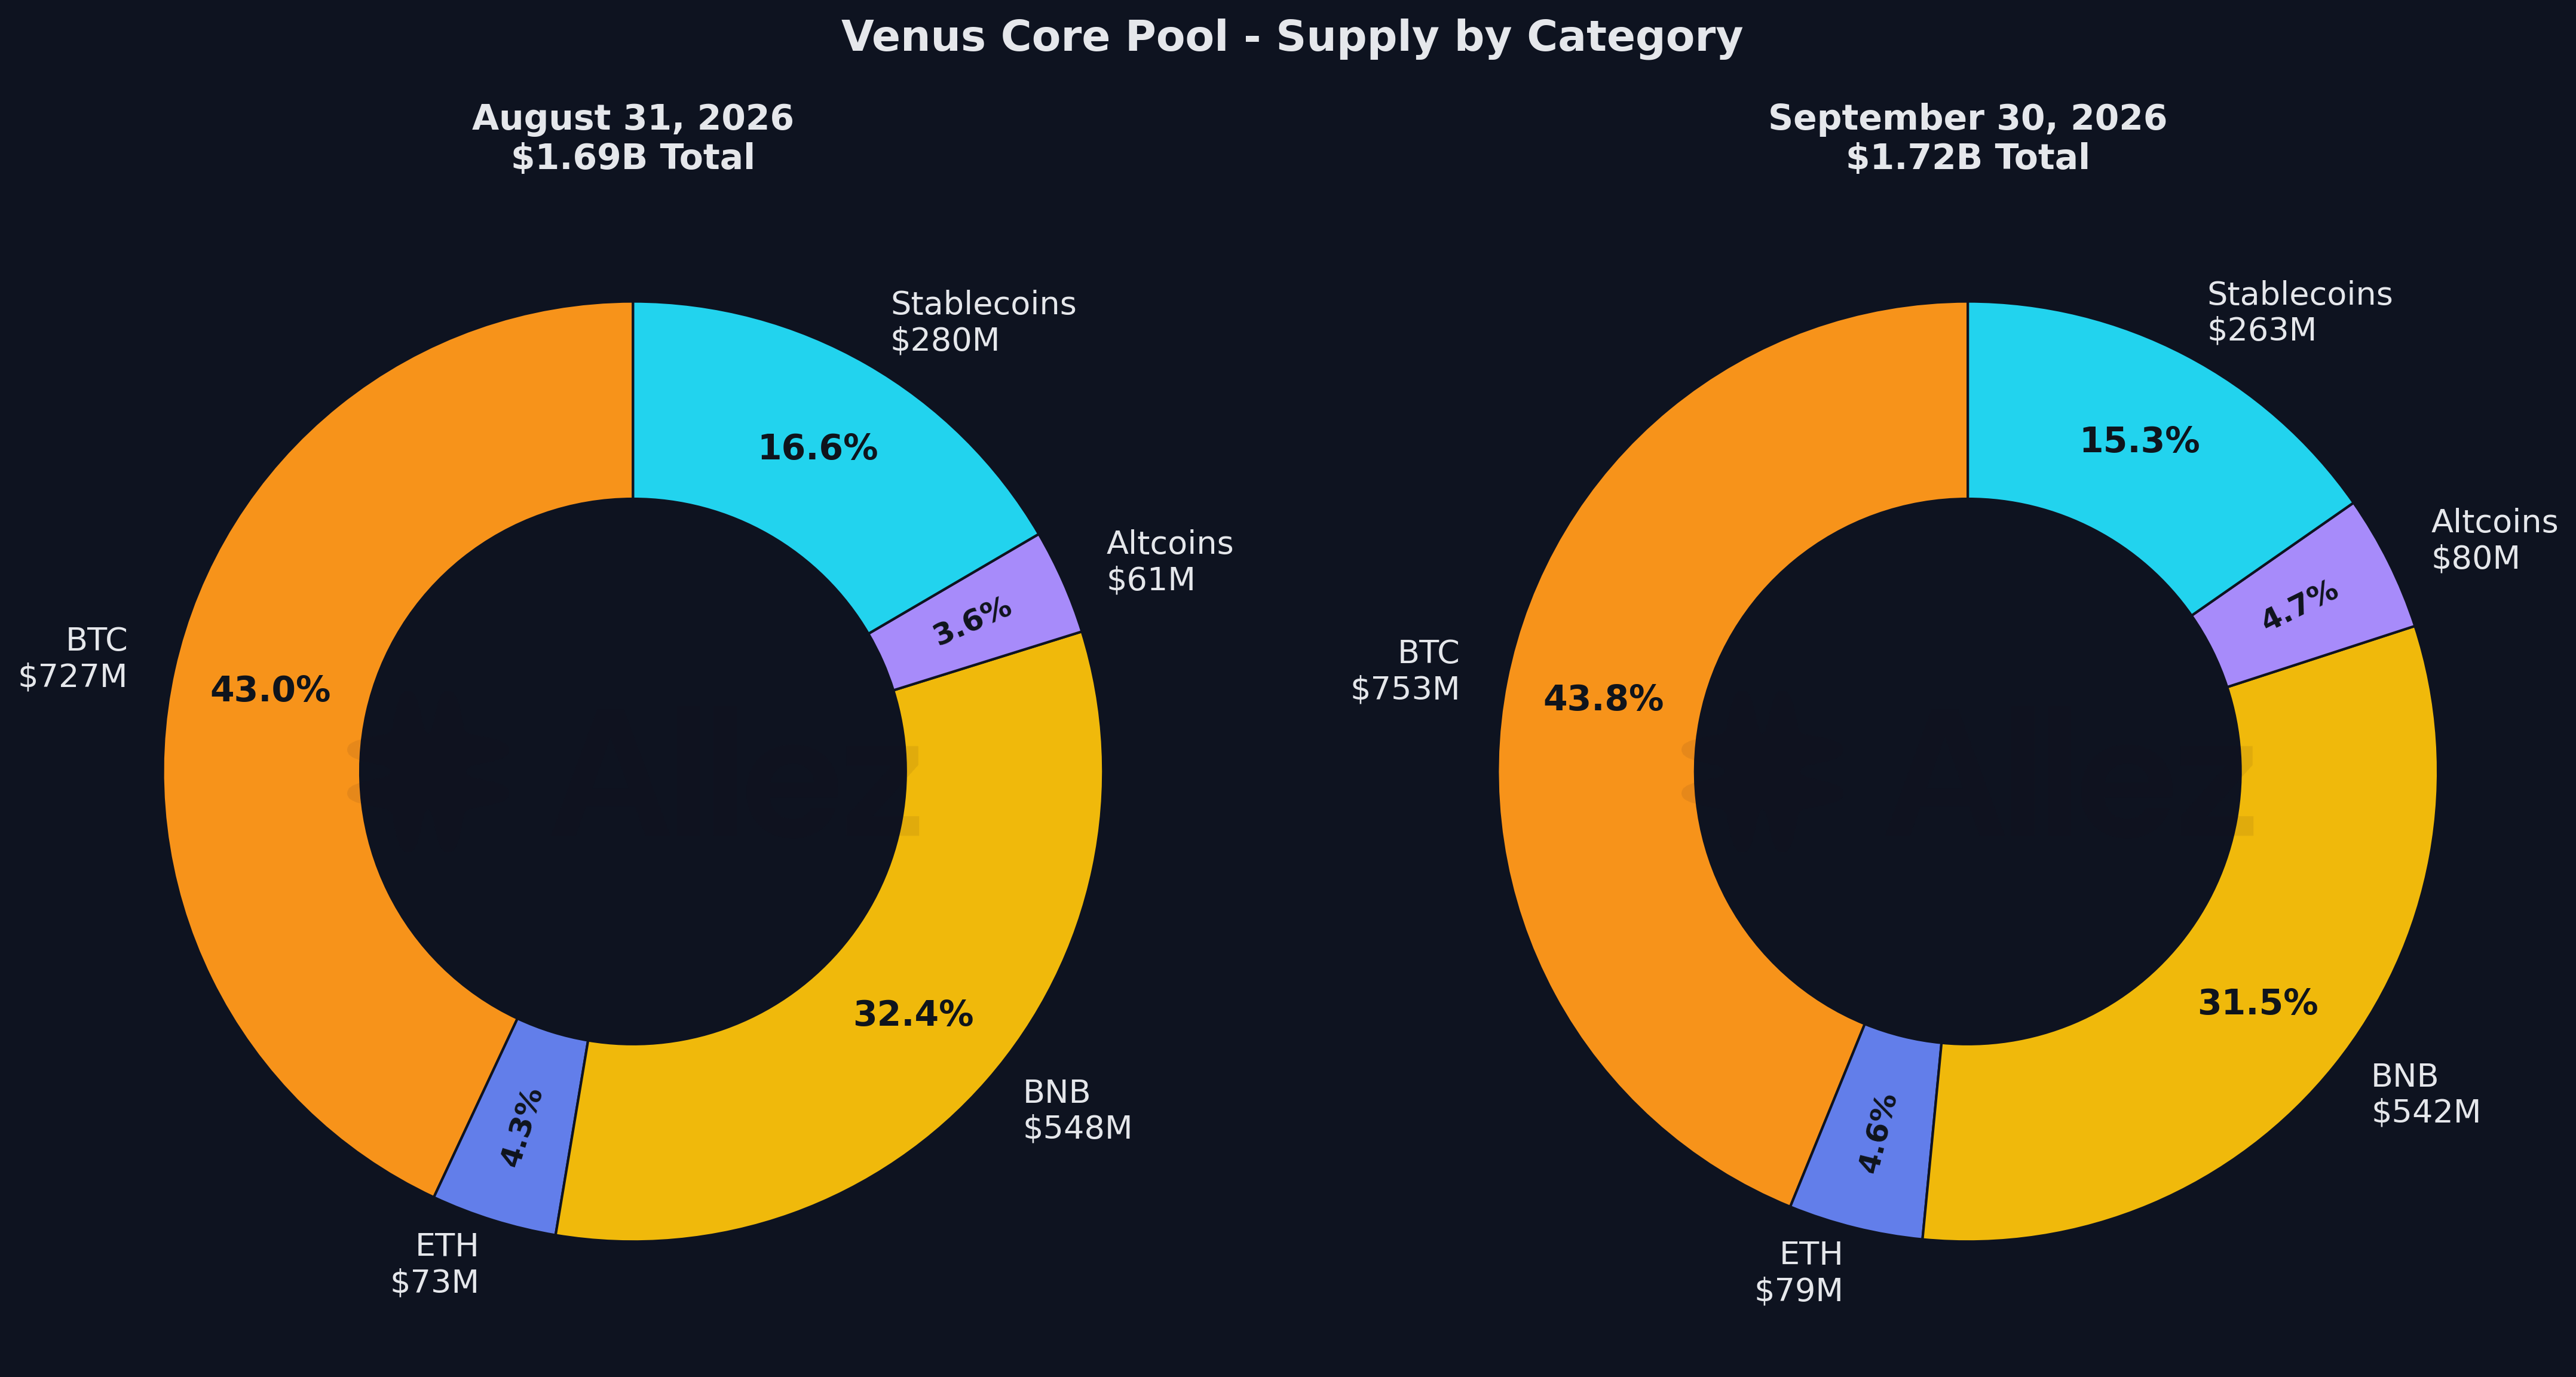
Category composition (September 30, 2026):
| Category | Supply | Share | MoM | Debt |
|---|---|---|---|---|
| BTC | $752.9M | 43.8% | +3.6% | $113.8M |
| BNB | $541.9M | 31.5% | -1.1% | $63.9M |
| Stablecoins | $263.0M | 15.3% | -6.0% | $190.6M |
| ETH | $79.5M | 4.6% | +8.8% | $35.4M |
| Altcoins (incl. $0.7M RWA) | $80.4M | 4.7% | +31.6% | $2.3M |
BNB's share fell 0.9pp despite the rally because of the asBNB withdrawal. Cake, the largest altcoin market, added 27.3% in value while its token balance fell 9.0%.
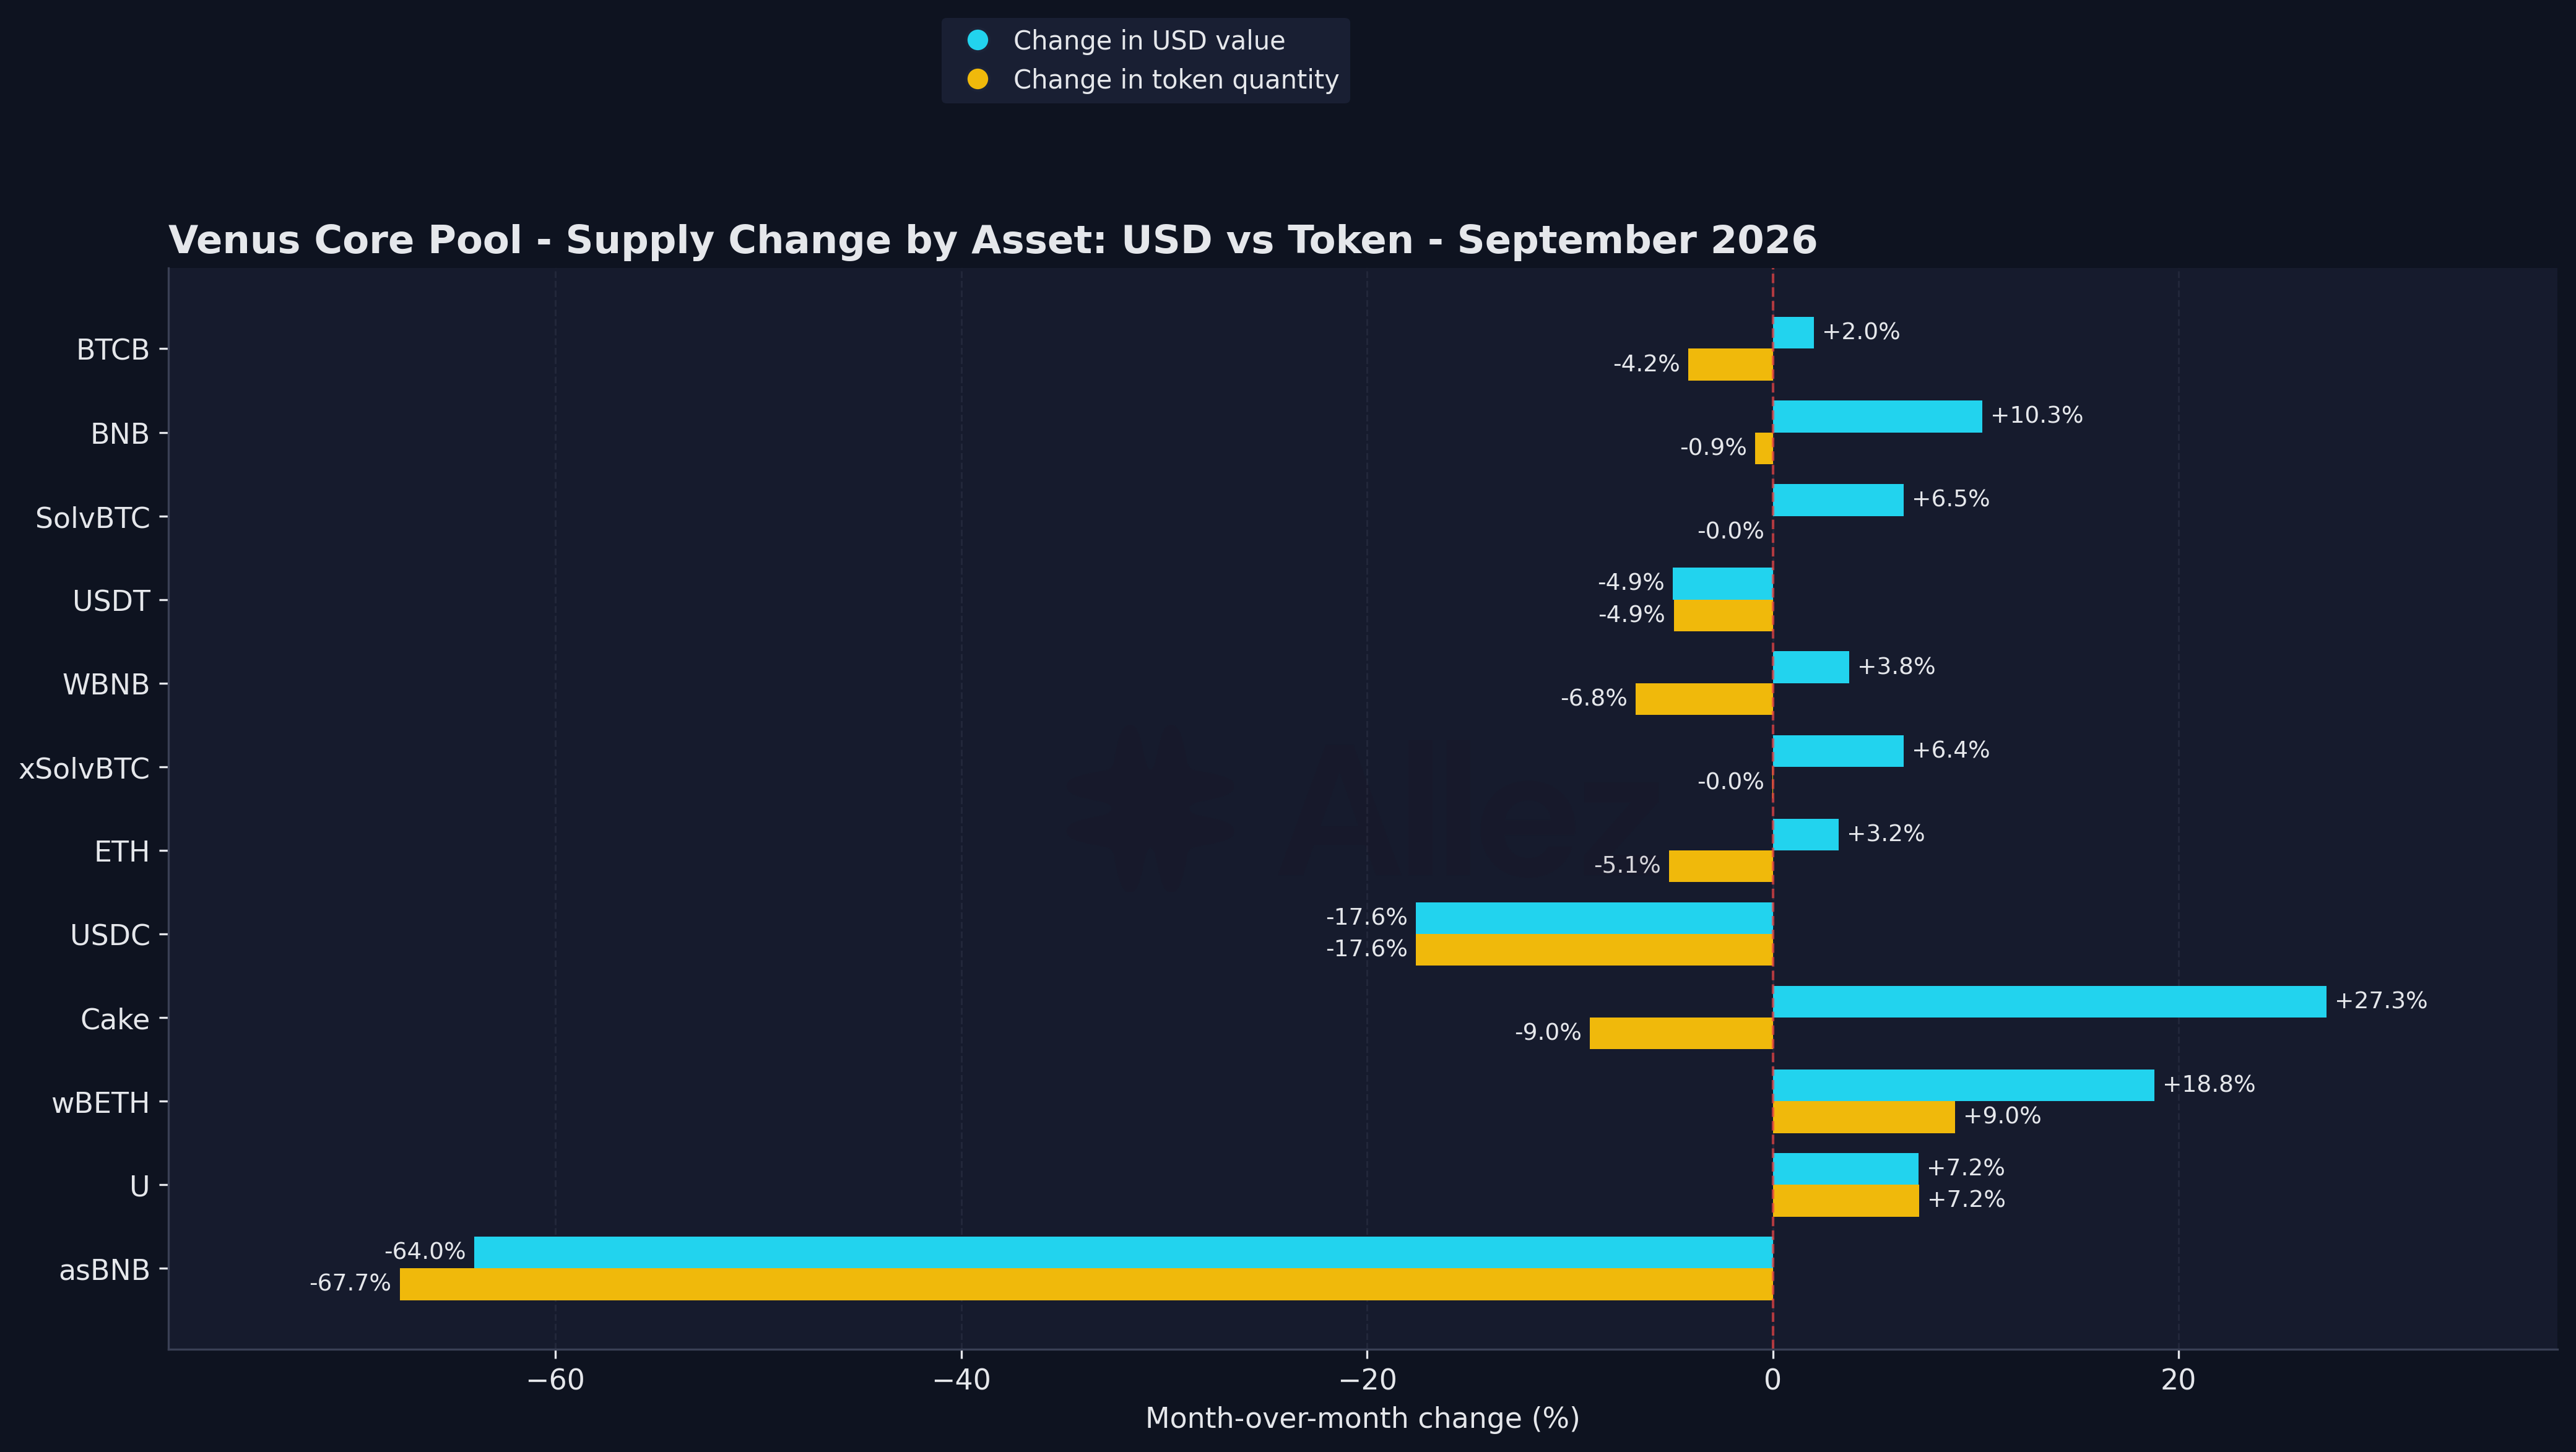
BNB debt fell from $115.6M to $55.8M, with two accounts making up $55.9M of the reduction (Section 3). ETH debt nearly doubled, $17.8M to $34.6M, most of it borrowed against BTCB (that pair rose from $2.0M to $17.4M across 353 accounts).
3. Risk & Liquidations
Liquidation summary:
| Metric | September Total |
|---|---|
| Total events | 334 |
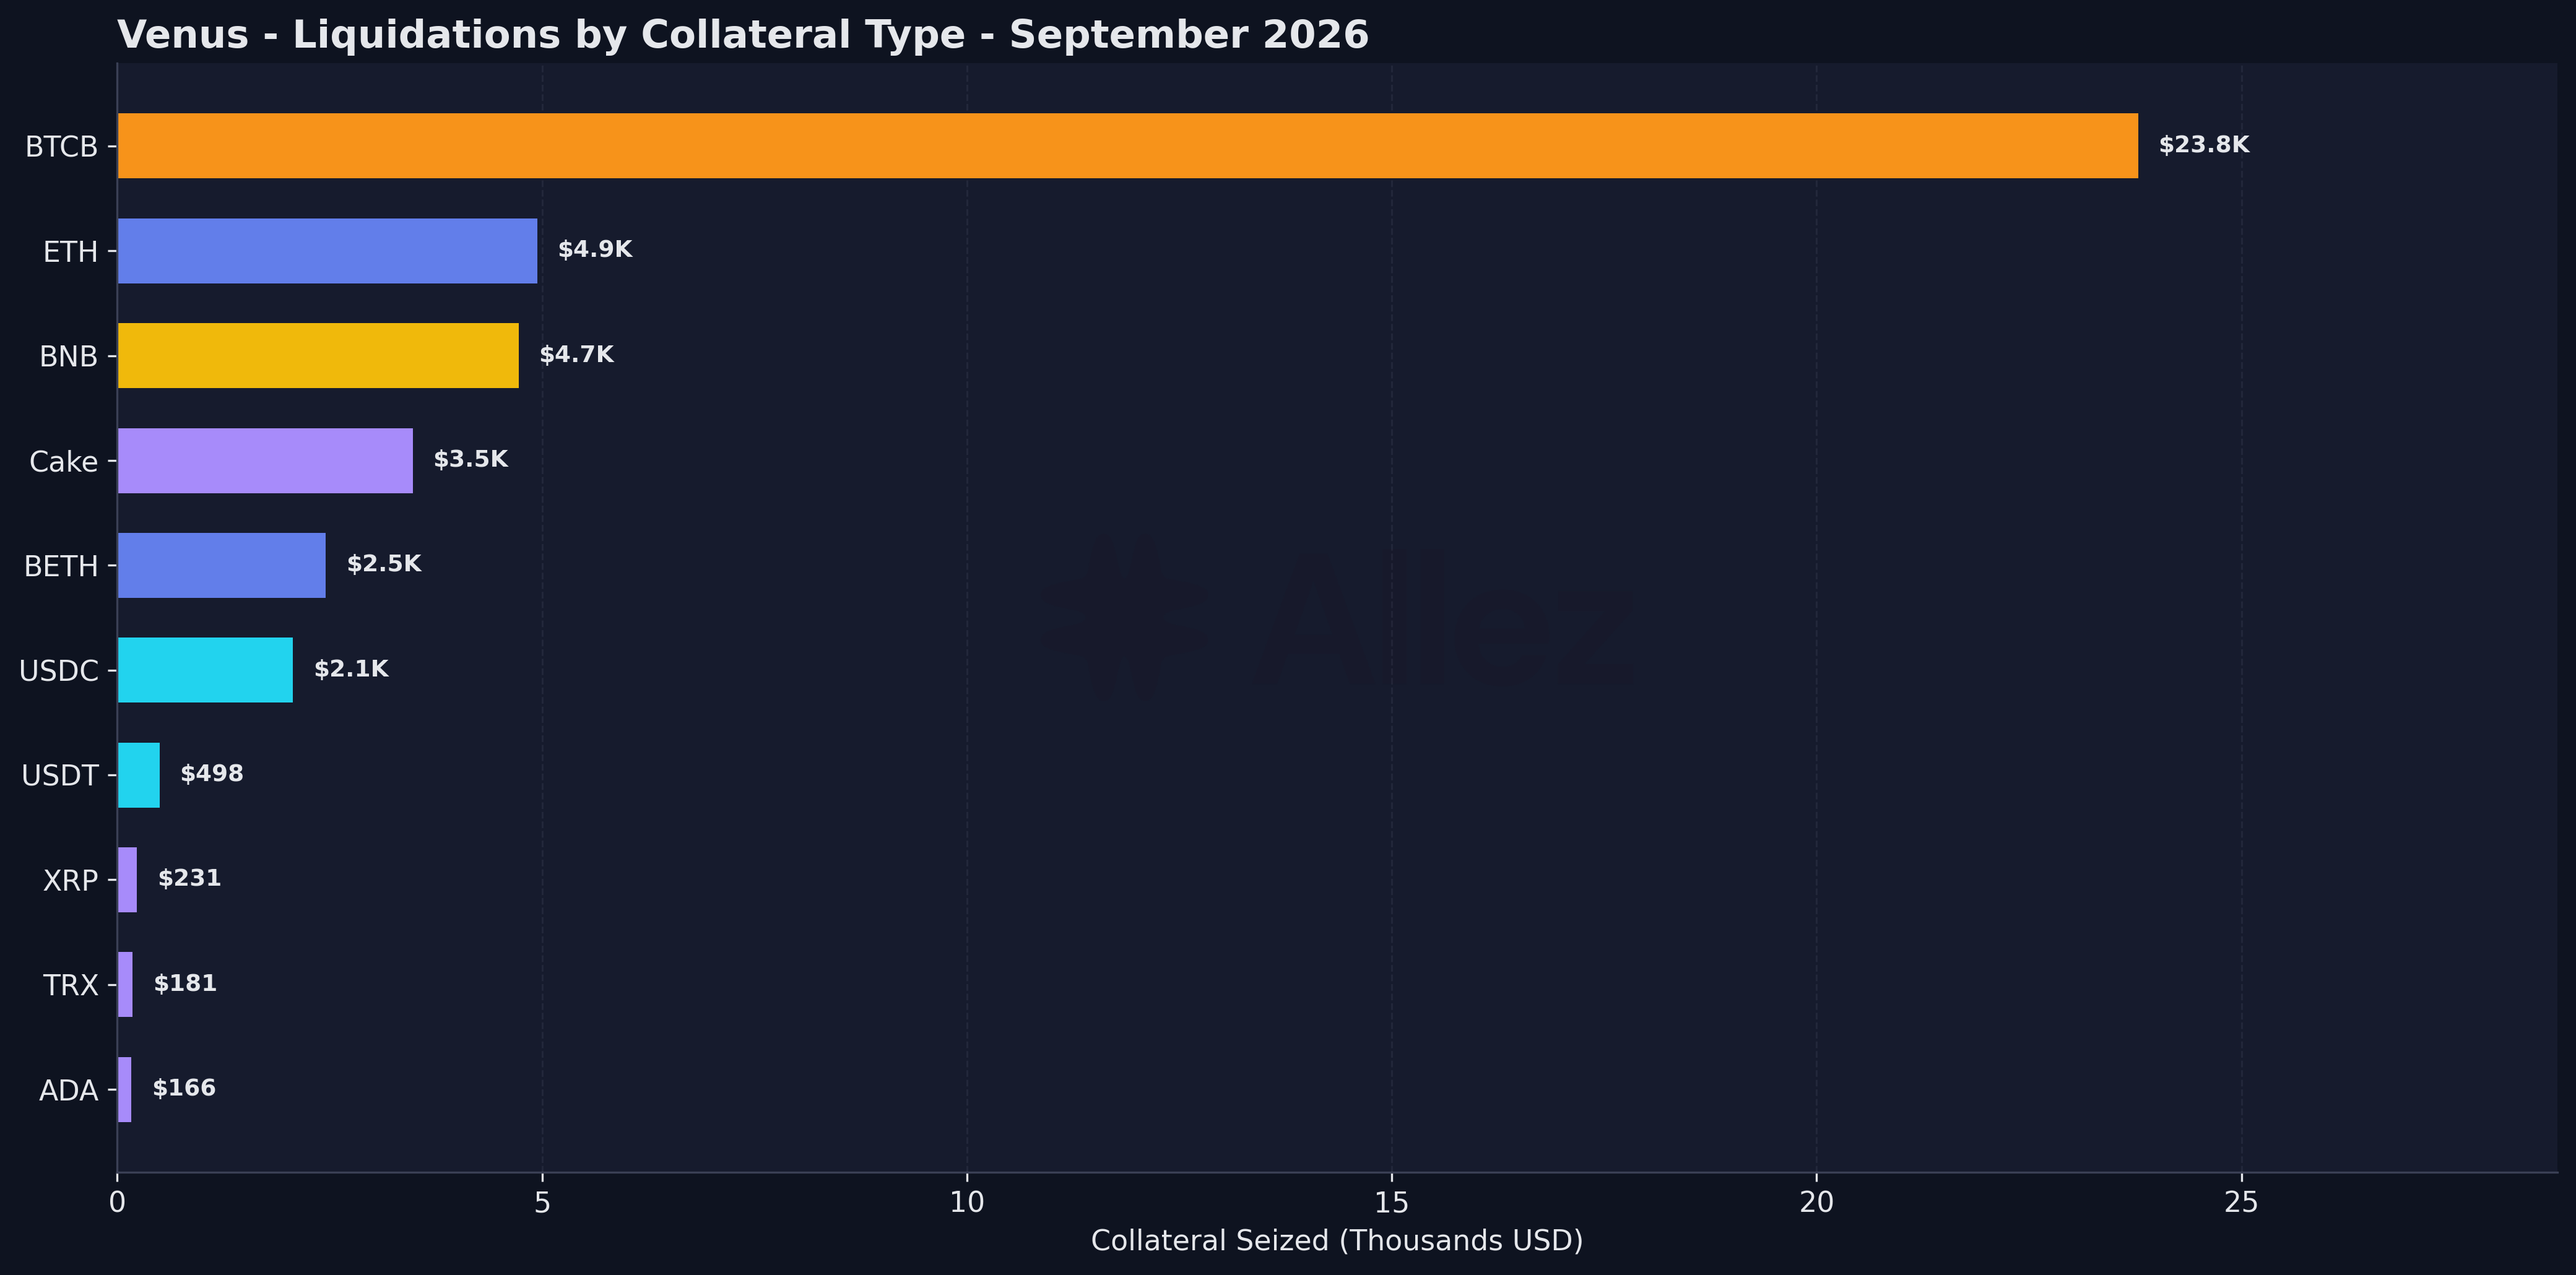
| Collateral seized | $42,761 |
| Debt repaid | $38,728 |
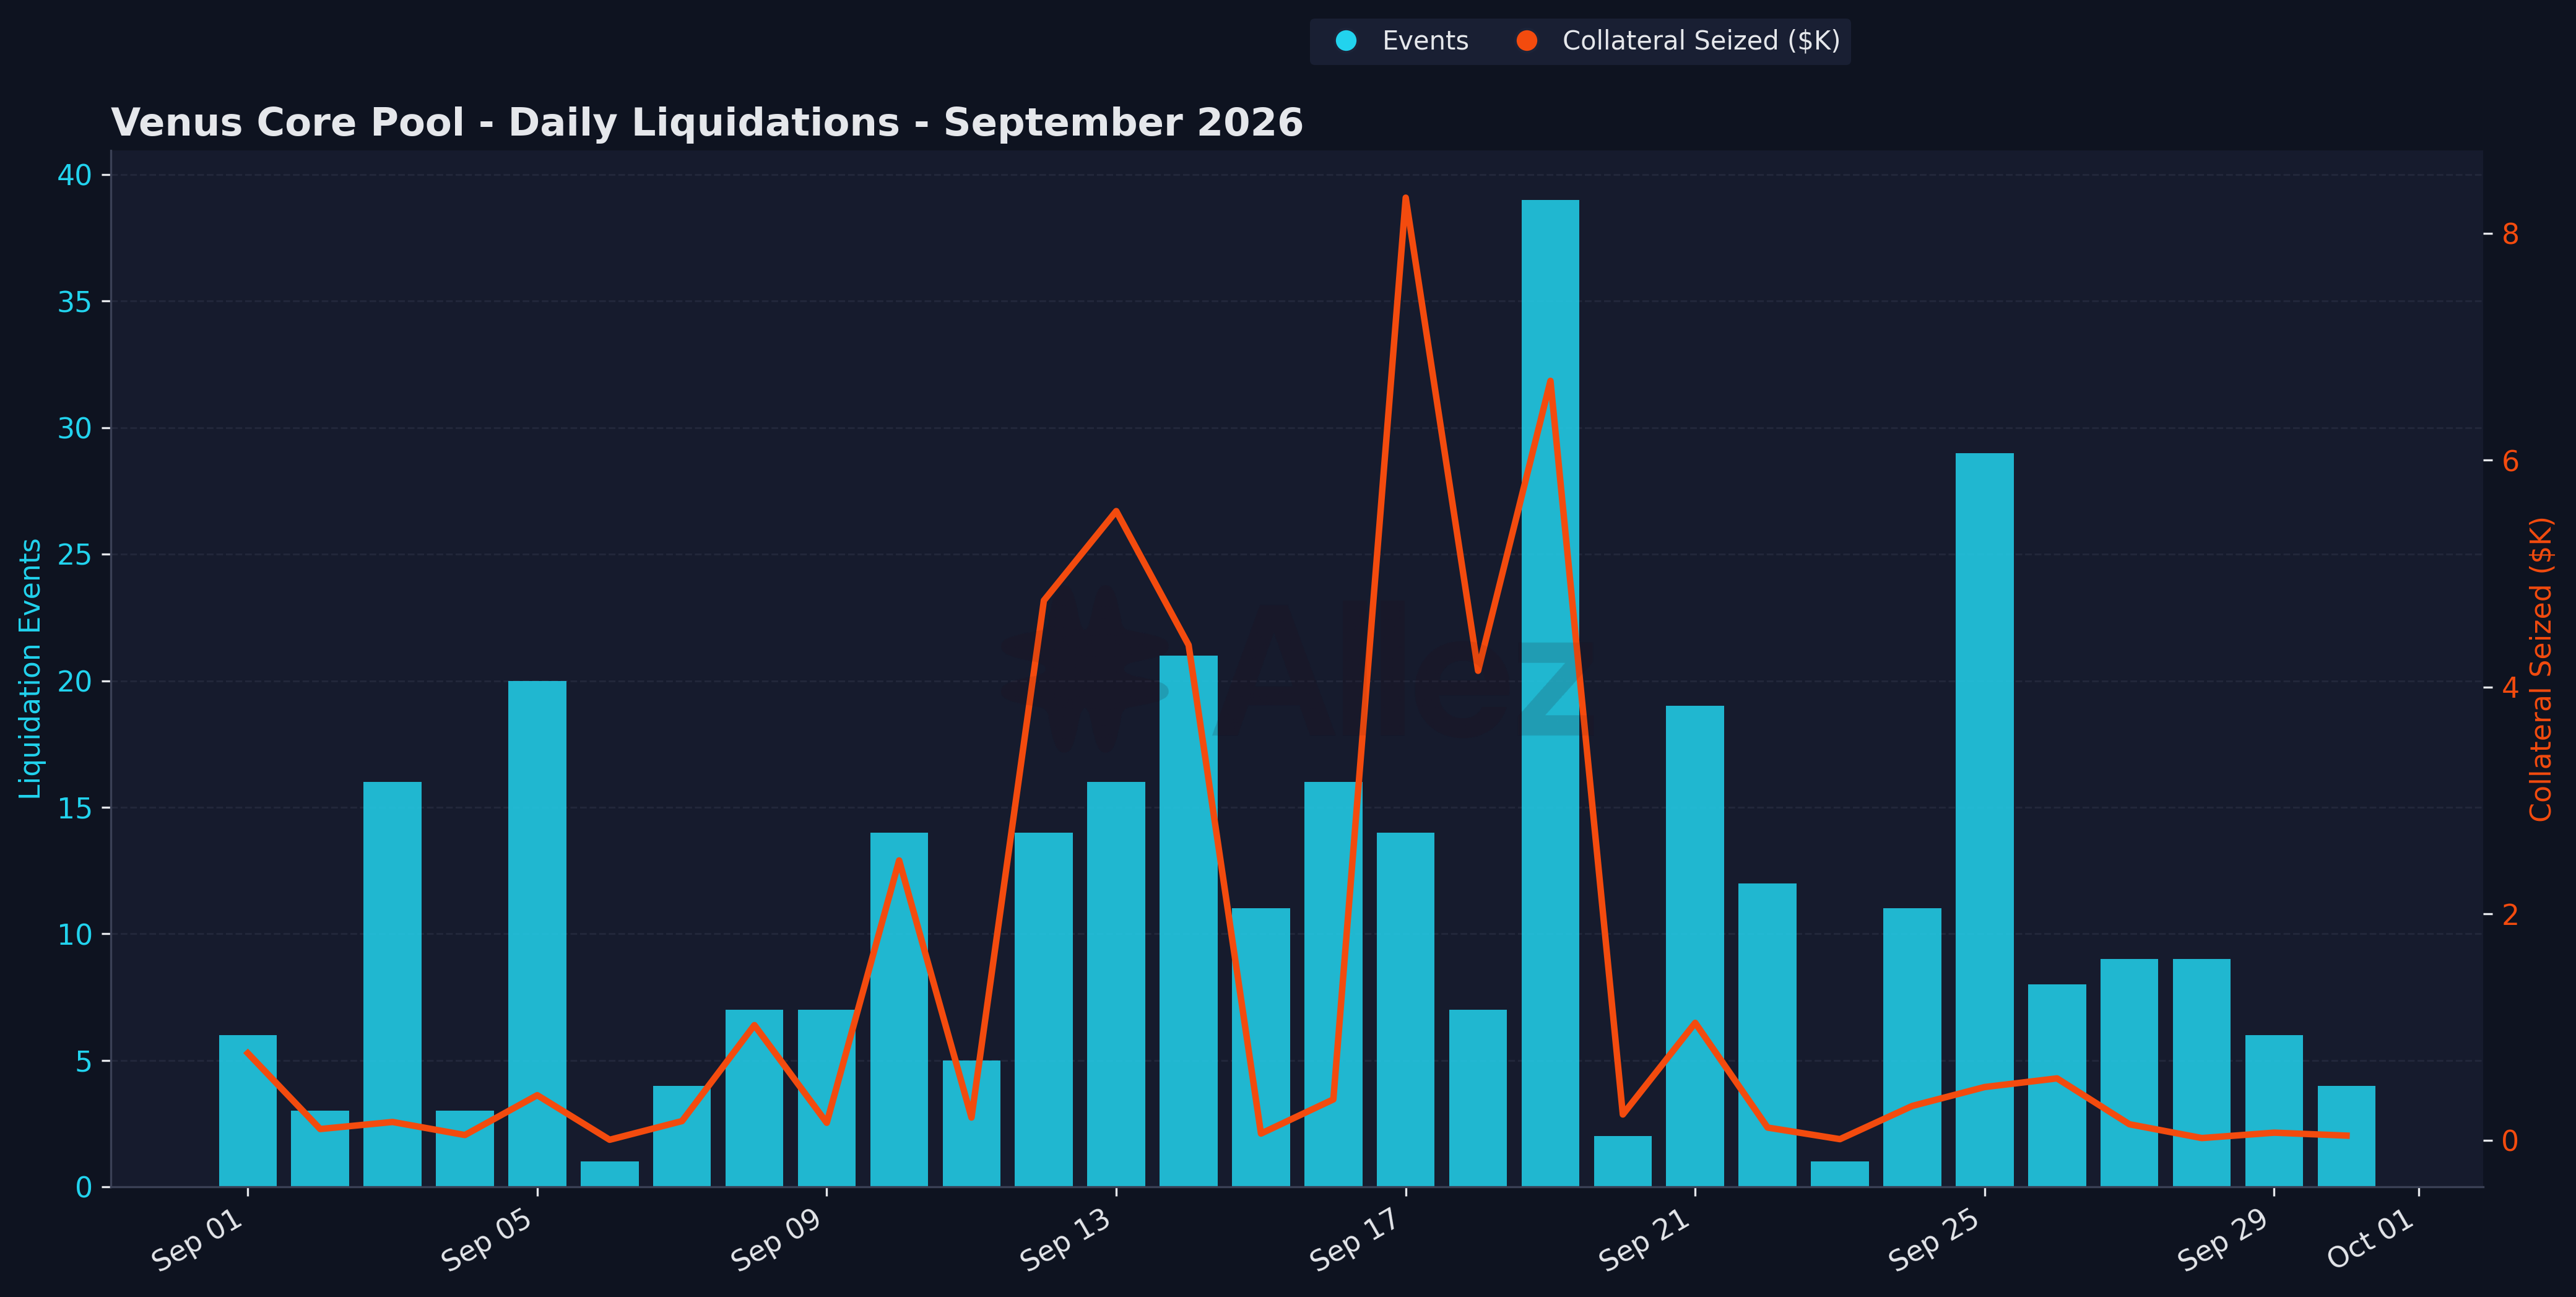
| Peak day (by value) | Sep 17 (14 events, $8,315) |
| Peak day (by count) | Sep 19 (39 events, $6,699) |
Liquidation activity was minimal across the month: 334 events seized $42.8K (August: 443 events, $3.12M).
Health factor distribution (September 30, 2026):
| Tier | HF Range | Debt | Correlated | Uncorrelated | Uncorrelated MoM | Accounts |
|---|---|---|---|---|---|---|
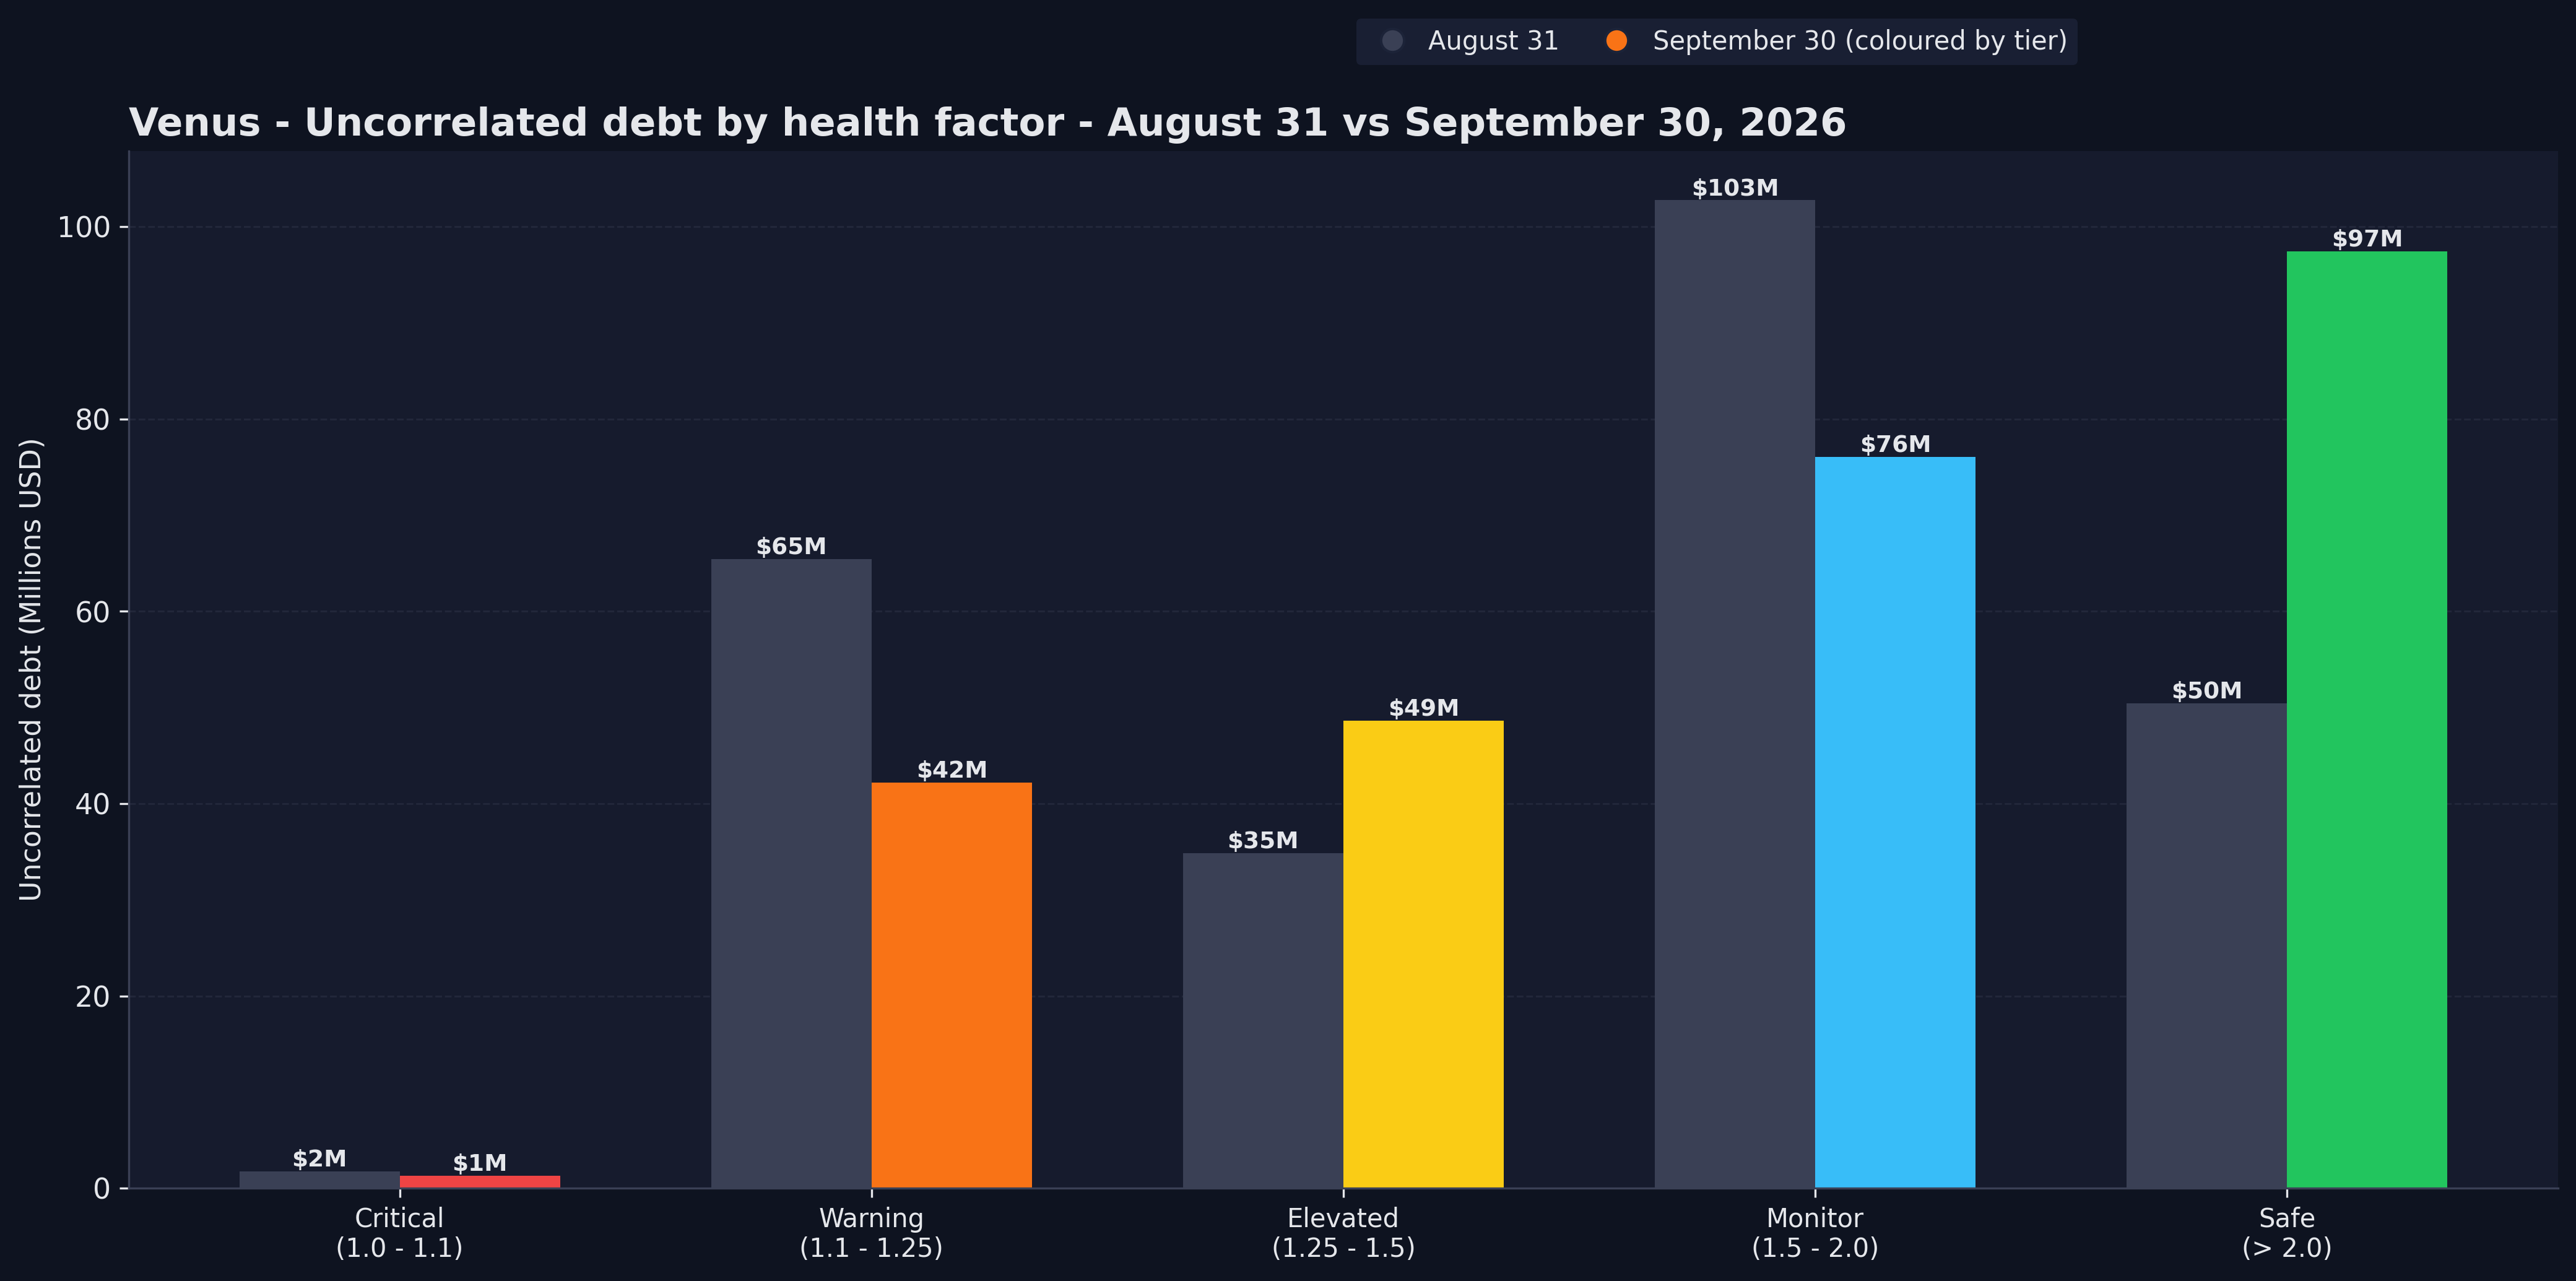
| Critical | 1.0 - 1.1 | $39.9M | $38.6M | $1.3M | -27.0% | 929 |
| Warning | 1.1 - 1.25 | $88.3M | $46.1M | $42.2M | -35.5% | 1,392 |
| Elevated | 1.25 - 1.5 | $57.8M | $9.1M | $48.6M | +39.5% | 2,546 |
| Monitor | 1.5 - 2.0 | $119.7M | $43.6M | $76.1M | -26.0% | 3,439 |
| Safe | > 2.0 | $100.3M | $2.9M | $97.5M | +93.1% | 14,780 |
| Total | $406.0M | $140.3M | $265.7M | +4.0% | 23,086 |
As BNB, BTC and ETH rose, uncorrelated debt moved to higher health factors. Uncorrelated debt within 10% of liquidation fell to $1.3M (August: $1.8M).
Stablecoin debt by collateral (seven largest legs, $179.1M of the $190.6M market-level stablecoin debt):
| Collateral | Stablecoin Debt | Aug Debt | MoM | Within 10% of Liquidation |
|---|---|---|---|---|
| BTCB | $84.1M | $78.6M | +7.0% | $6.6M |
| SolvBTC | $37.7M | $40.0M | -5.8% | ~$0 |
| BNB | $27.6M | $27.8M | -0.7% | $0.1M |
| wBETH | $11.5M | $10.5M | +9.4% | ~$0 |
| ETH | $8.0M | $8.4M | -4.8% | ~$0 |
| USDT | $7.5M | $5.3M | +40.2% | $3.3M |
| asBNB | $2.7M | $1.7M | +58.1% | ~$0 |
Stablecoin debt backed by BTCB and within 10% of liquidation rose in September from $2.3M to $6.6M. Most of the increase comes from one account at a health factor of 1.08, which has $22.9M of debt against BTCB, $5.1M of it in USDT. Separately, $3.3M of the $7.5M borrowed against USDT collateral is within 10% of liquidation. With stablecoins on both sides, the main risk for those positions is a depeg.
Forward stress test:
The stress test applies a further price shock to every account. In the uniform case, all volatile collateral and debt move together, with stablecoins held at $1.
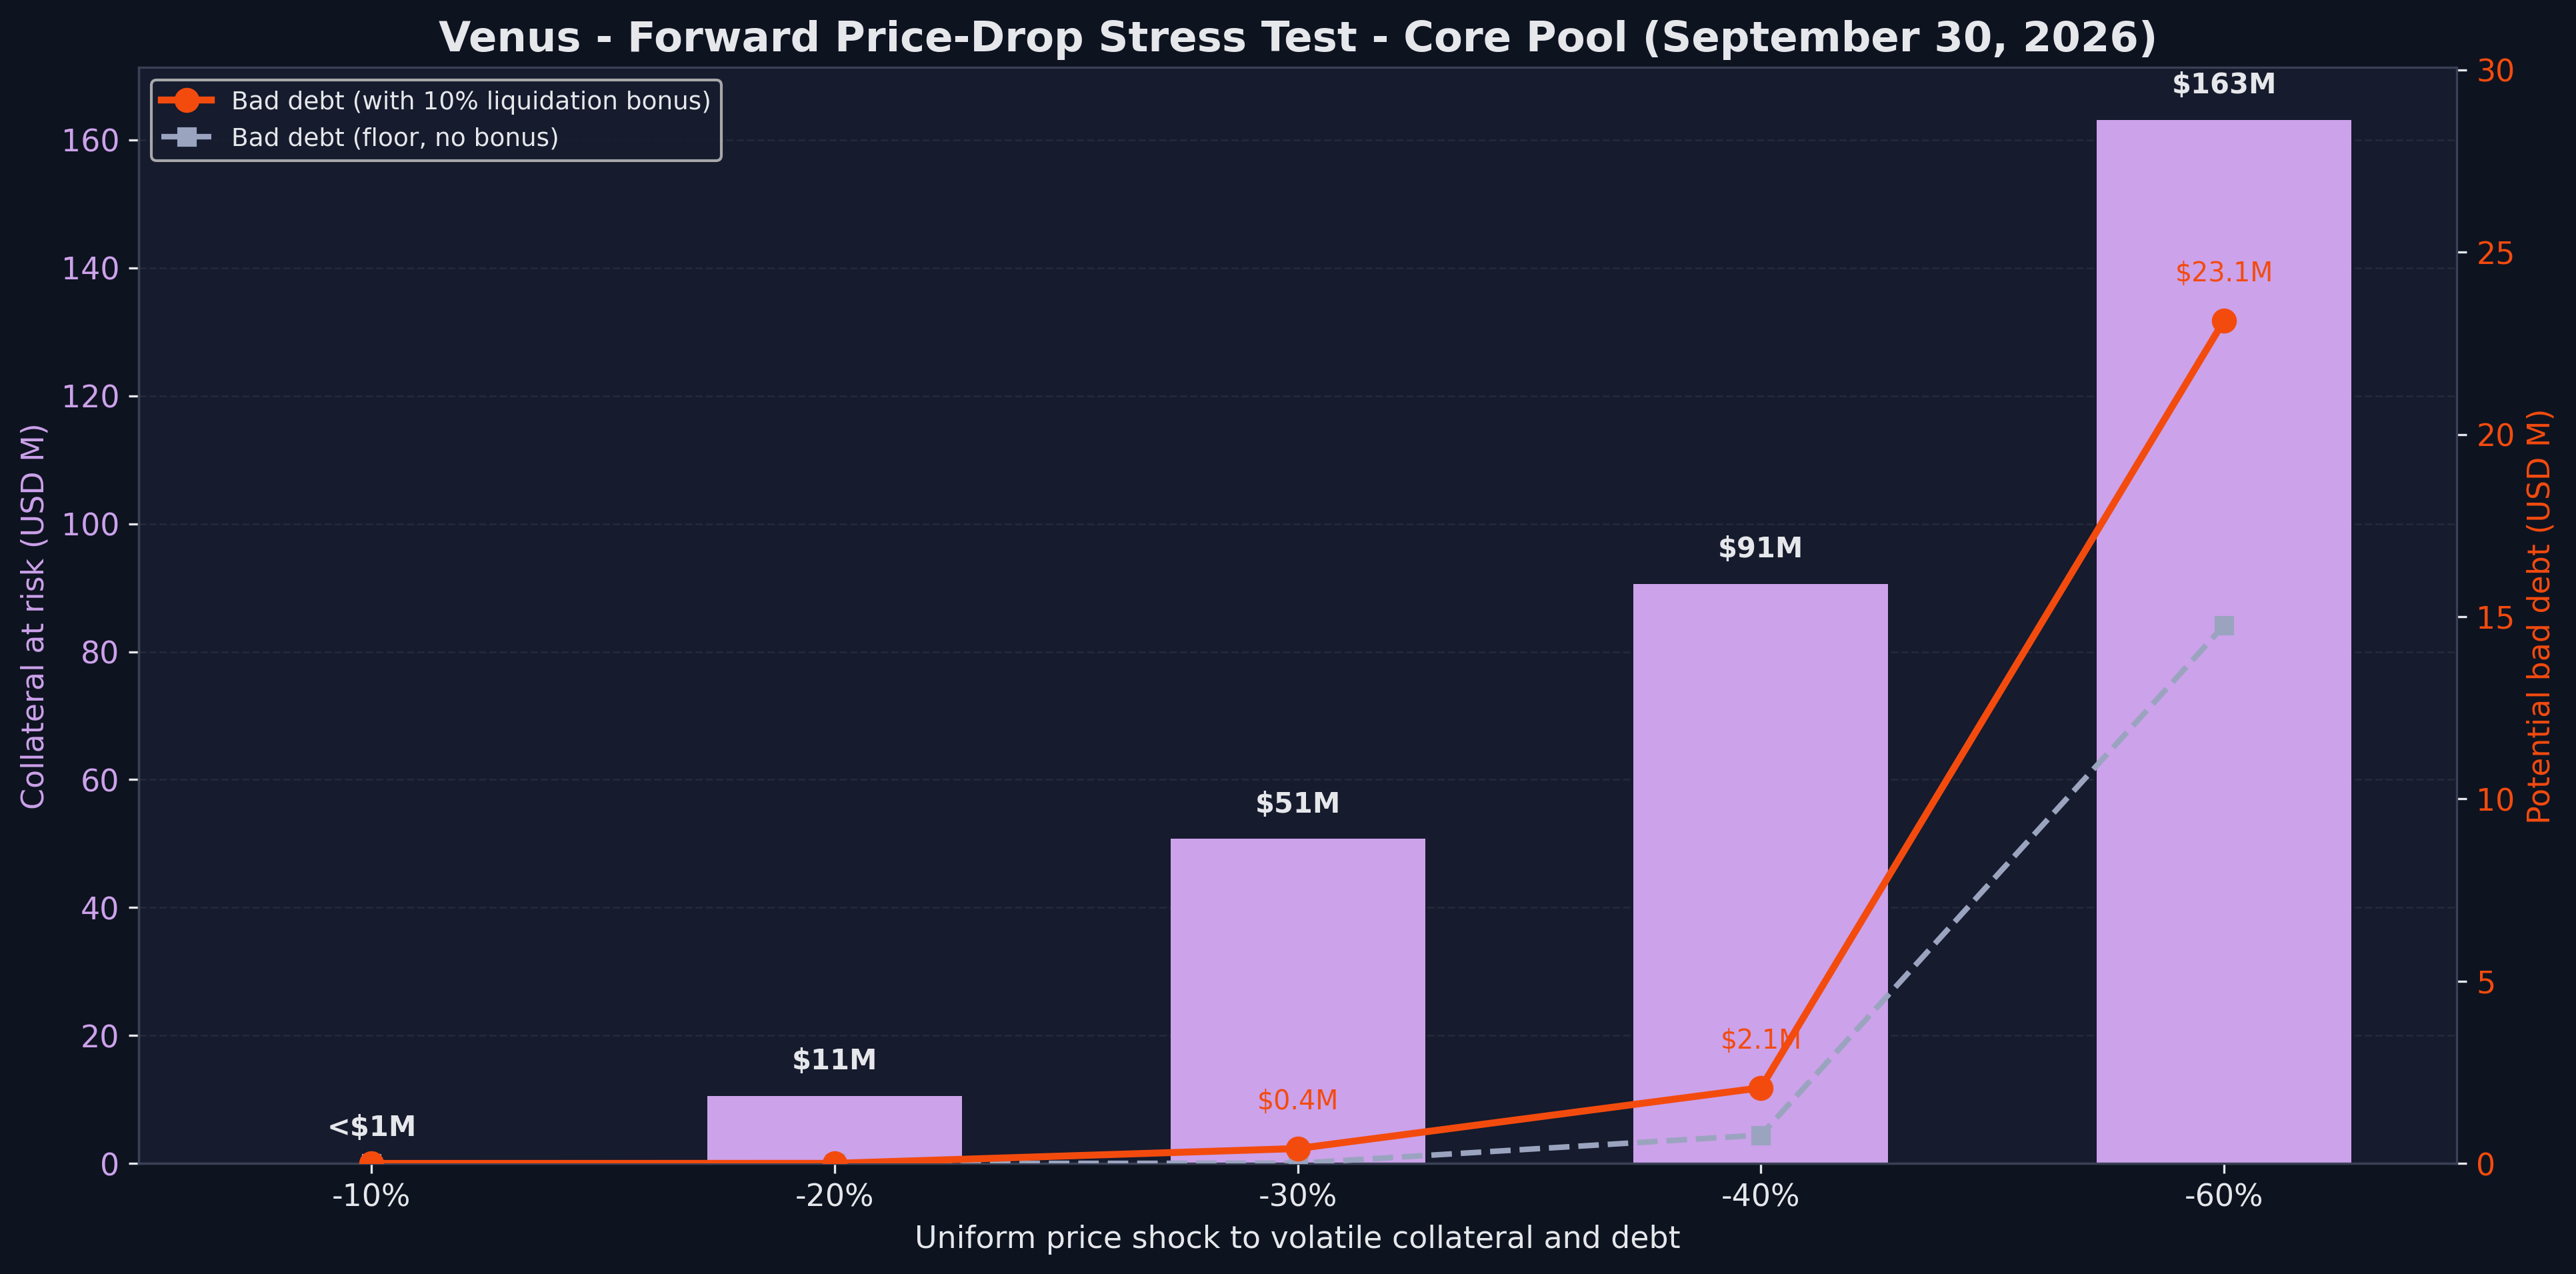
| Further price shock | Accounts liquidated | Collateral at risk | Aug 31 collateral at risk | Collateral-at-risk MoM | Bad debt (+10% bonus) | Aug 31 bad debt |
|---|---|---|---|---|---|---|
| No shock (baseline) | 4,677 | $0.05M | $0.04M | n/m | ~$0 | ~$0 |
| -10% | 4,639 | $0.1M | $0.04M | n/m | ~$0 | ~$0 |
| -20% | 4,682 | $10.5M | $11.3M | -6.3% | ~$0 | ~$0 |
| -30% | 4,905 | $50.7M | $23.4M | +116.6% | $0.4M | $0.7M |
| -40% | 5,811 | $90.6M | $67.8M | +33.7% | $2.1M | $2.4M |
| -60% | 7,598 | $163.2M | $152.1M | +7.2% | $23.1M | $26.5M |
Modeled bad debt is lower than in August at every level from -30% down. The largest single account at -30% is the BTCB borrower at health factor 1.08 ($21.7M of collateral).
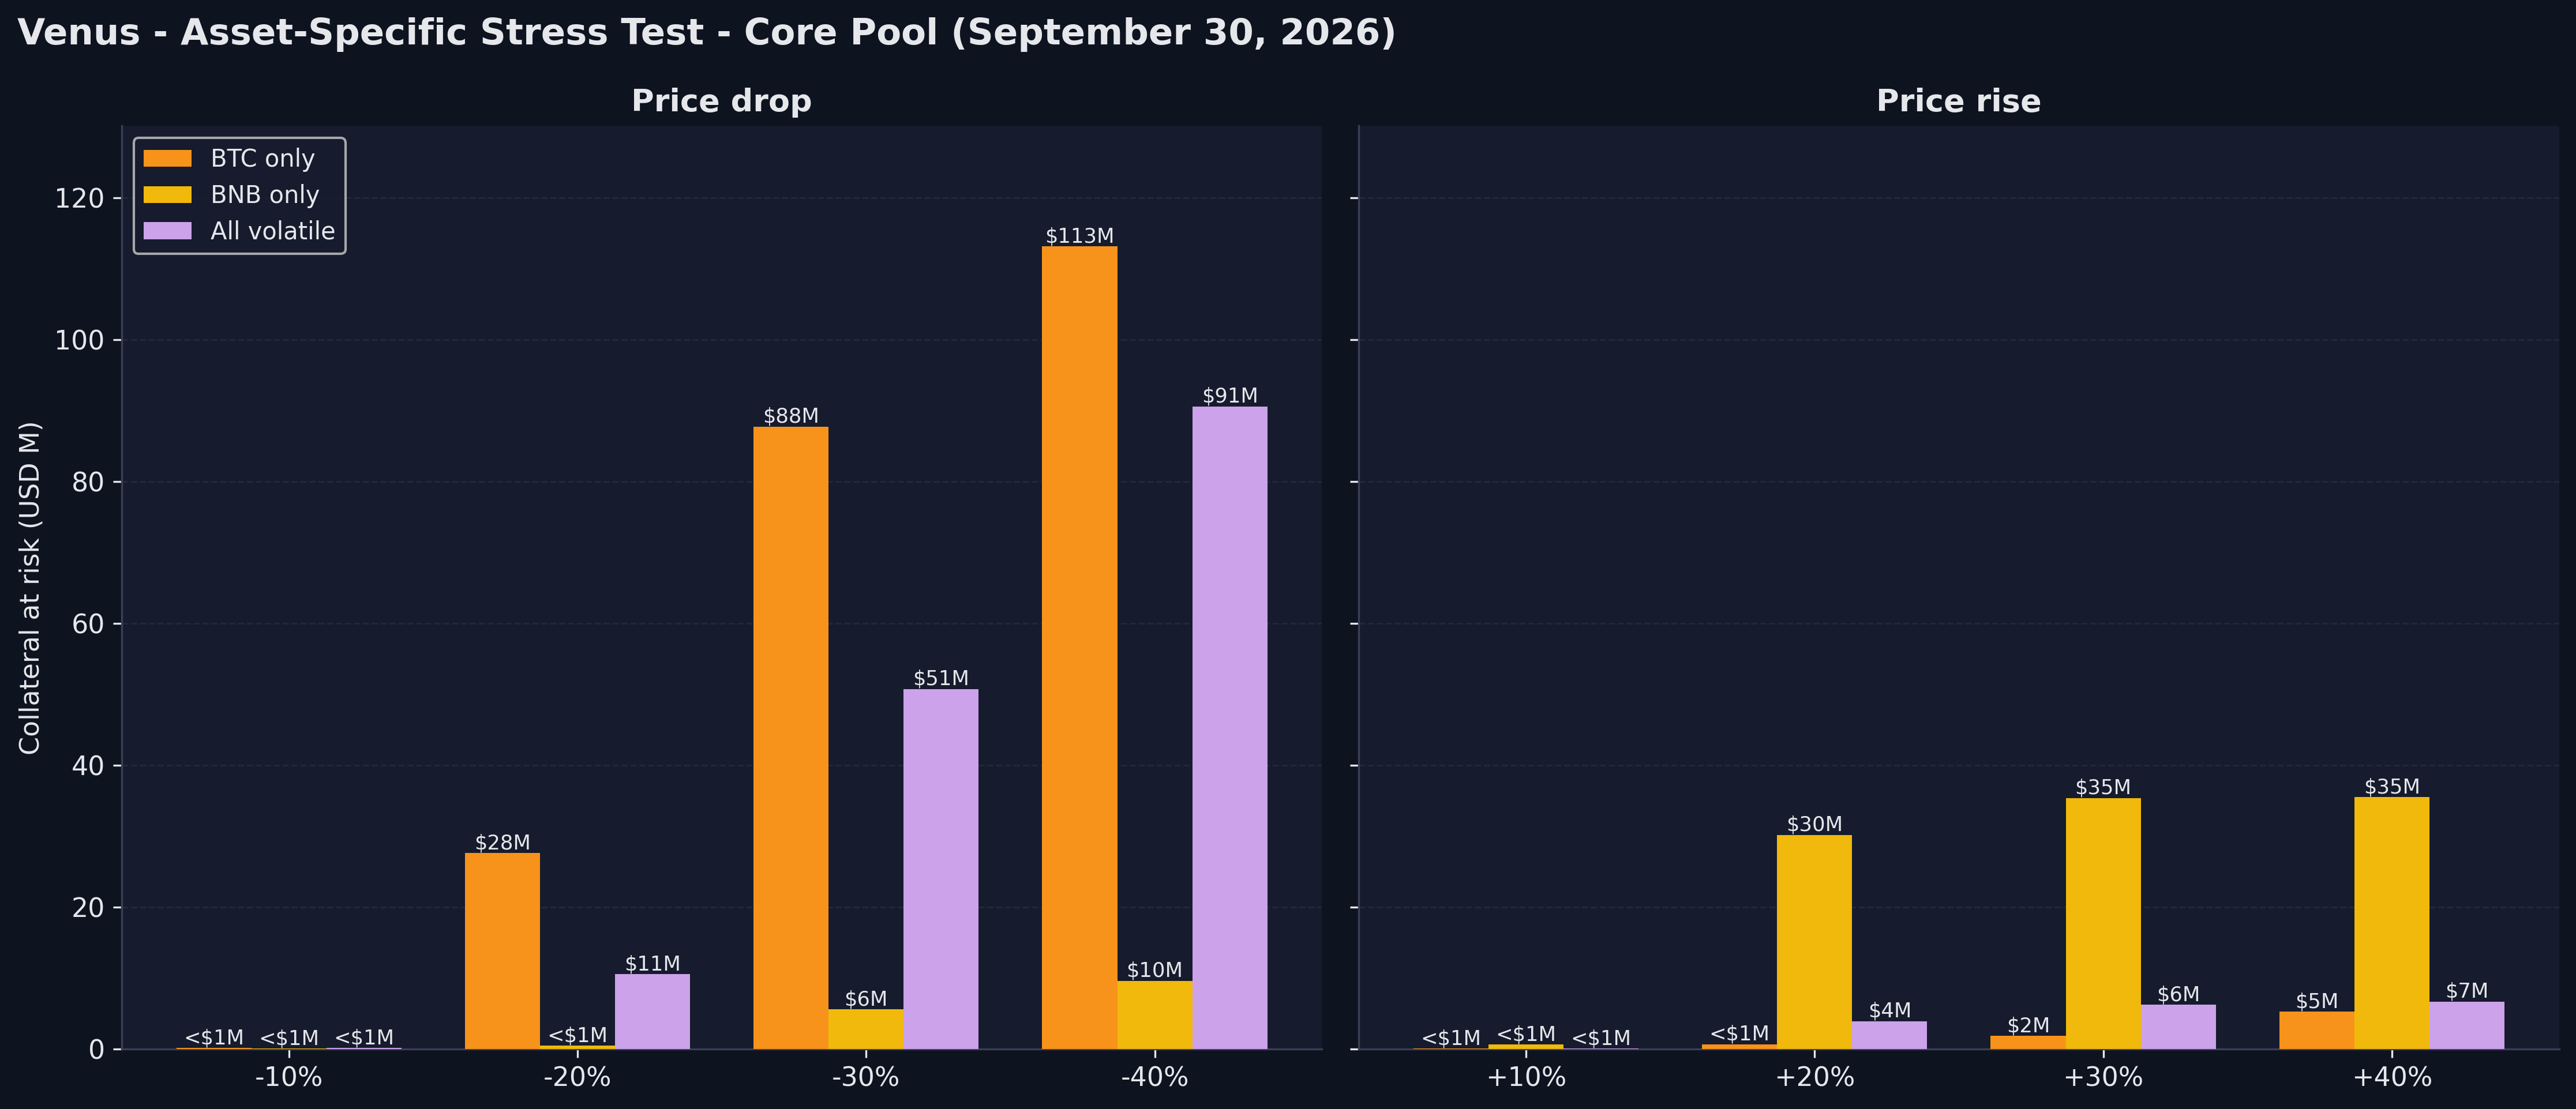
| Scenario | -10% | -20% | -30% | -40% |
|---|---|---|---|---|
| BTC only | $0.1M | $27.6M | $87.7M | $113.1M |
| BNB only | ~$0 | $0.5M | $5.6M | $9.6M |
| All volatile | $0.1M | $10.5M | $50.7M | $90.6M |
| Scenario | +10% | +20% | +30% | +40% |
|---|---|---|---|---|
| BNB only | $0.6M | $30.2M | $35.4M | $35.5M |
| BTC only | $0.1M | $0.6M | $1.8M | $5.2M |
| All volatile | $0.1M | $3.9M | $6.2M | $6.7M |
As some large accounts borrow BNB against BTC, BNB rising relative to BTC puts more collateral at risk than both moving together. A 20% BTC-only drop puts $27.6M at risk and a 20% BNB-only rise puts $30.2M, against $10.5M and $3.9M when all volatile assets move together. One account that borrows BNB against BTCB and stablecoins accounts for $24.4M and $29.3M of those totals.
Top borrowers and borrower concentration:
| Borrower | Total Debt | MoM | Primary Asset |
|---|---|---|---|
| 0xc482...82a8 | $33.0M | +24.2% | BTCB |
| 0x9614...8bf1 | $22.9M | +6.4% | BTCB, USDT |
| 0x5c18...fe77 | $20.3M | -50.2% | BNB |
| 0x3e87...d90c | $16.8M | -67.8% | BNB |
The four largest borrowers hold $93.0M, 22.9% of protocol debt (August: $140.8M, 32%). The two BNB borrowers reduced their BNB debt from 134,220 to 47,915 BNB, $92.7M to $36.8M.
4. Collateral Structure
Top collateral/borrow pairs:
| Collateral | Borrowed | Debt | Aug Debt | MoM | Users |
|---|---|---|---|---|---|
| BTCB | USDT | $64.2M | $60.7M | +5.8% | 2,181 |
| SolvBTC | BTCB | $39.4M | $35.4M | +11.3% | 21 |
| xSolvBTC | BTCB | $37.7M | $33.6M | +12.3% | 12 |
| SolvBTC | USDT | $33.4M | $35.8M | -6.7% | 41 |
| BTCB | BTCB | $30.2M | $34.0M | -11.2% | 603 |
| BTCB | BNB | $26.9M | $33.2M | -19.0% | 1,856 |
| BTCB | ETH | $17.4M | $2.0M | +764.1% | 353 |
BTCB borrowed against SolvBTC and xSolvBTC grew 11% to 12%. BNB borrowed against BTCB fell 19%, and ETH borrowed against BTCB is now one of the top pairs.
5. Utilization
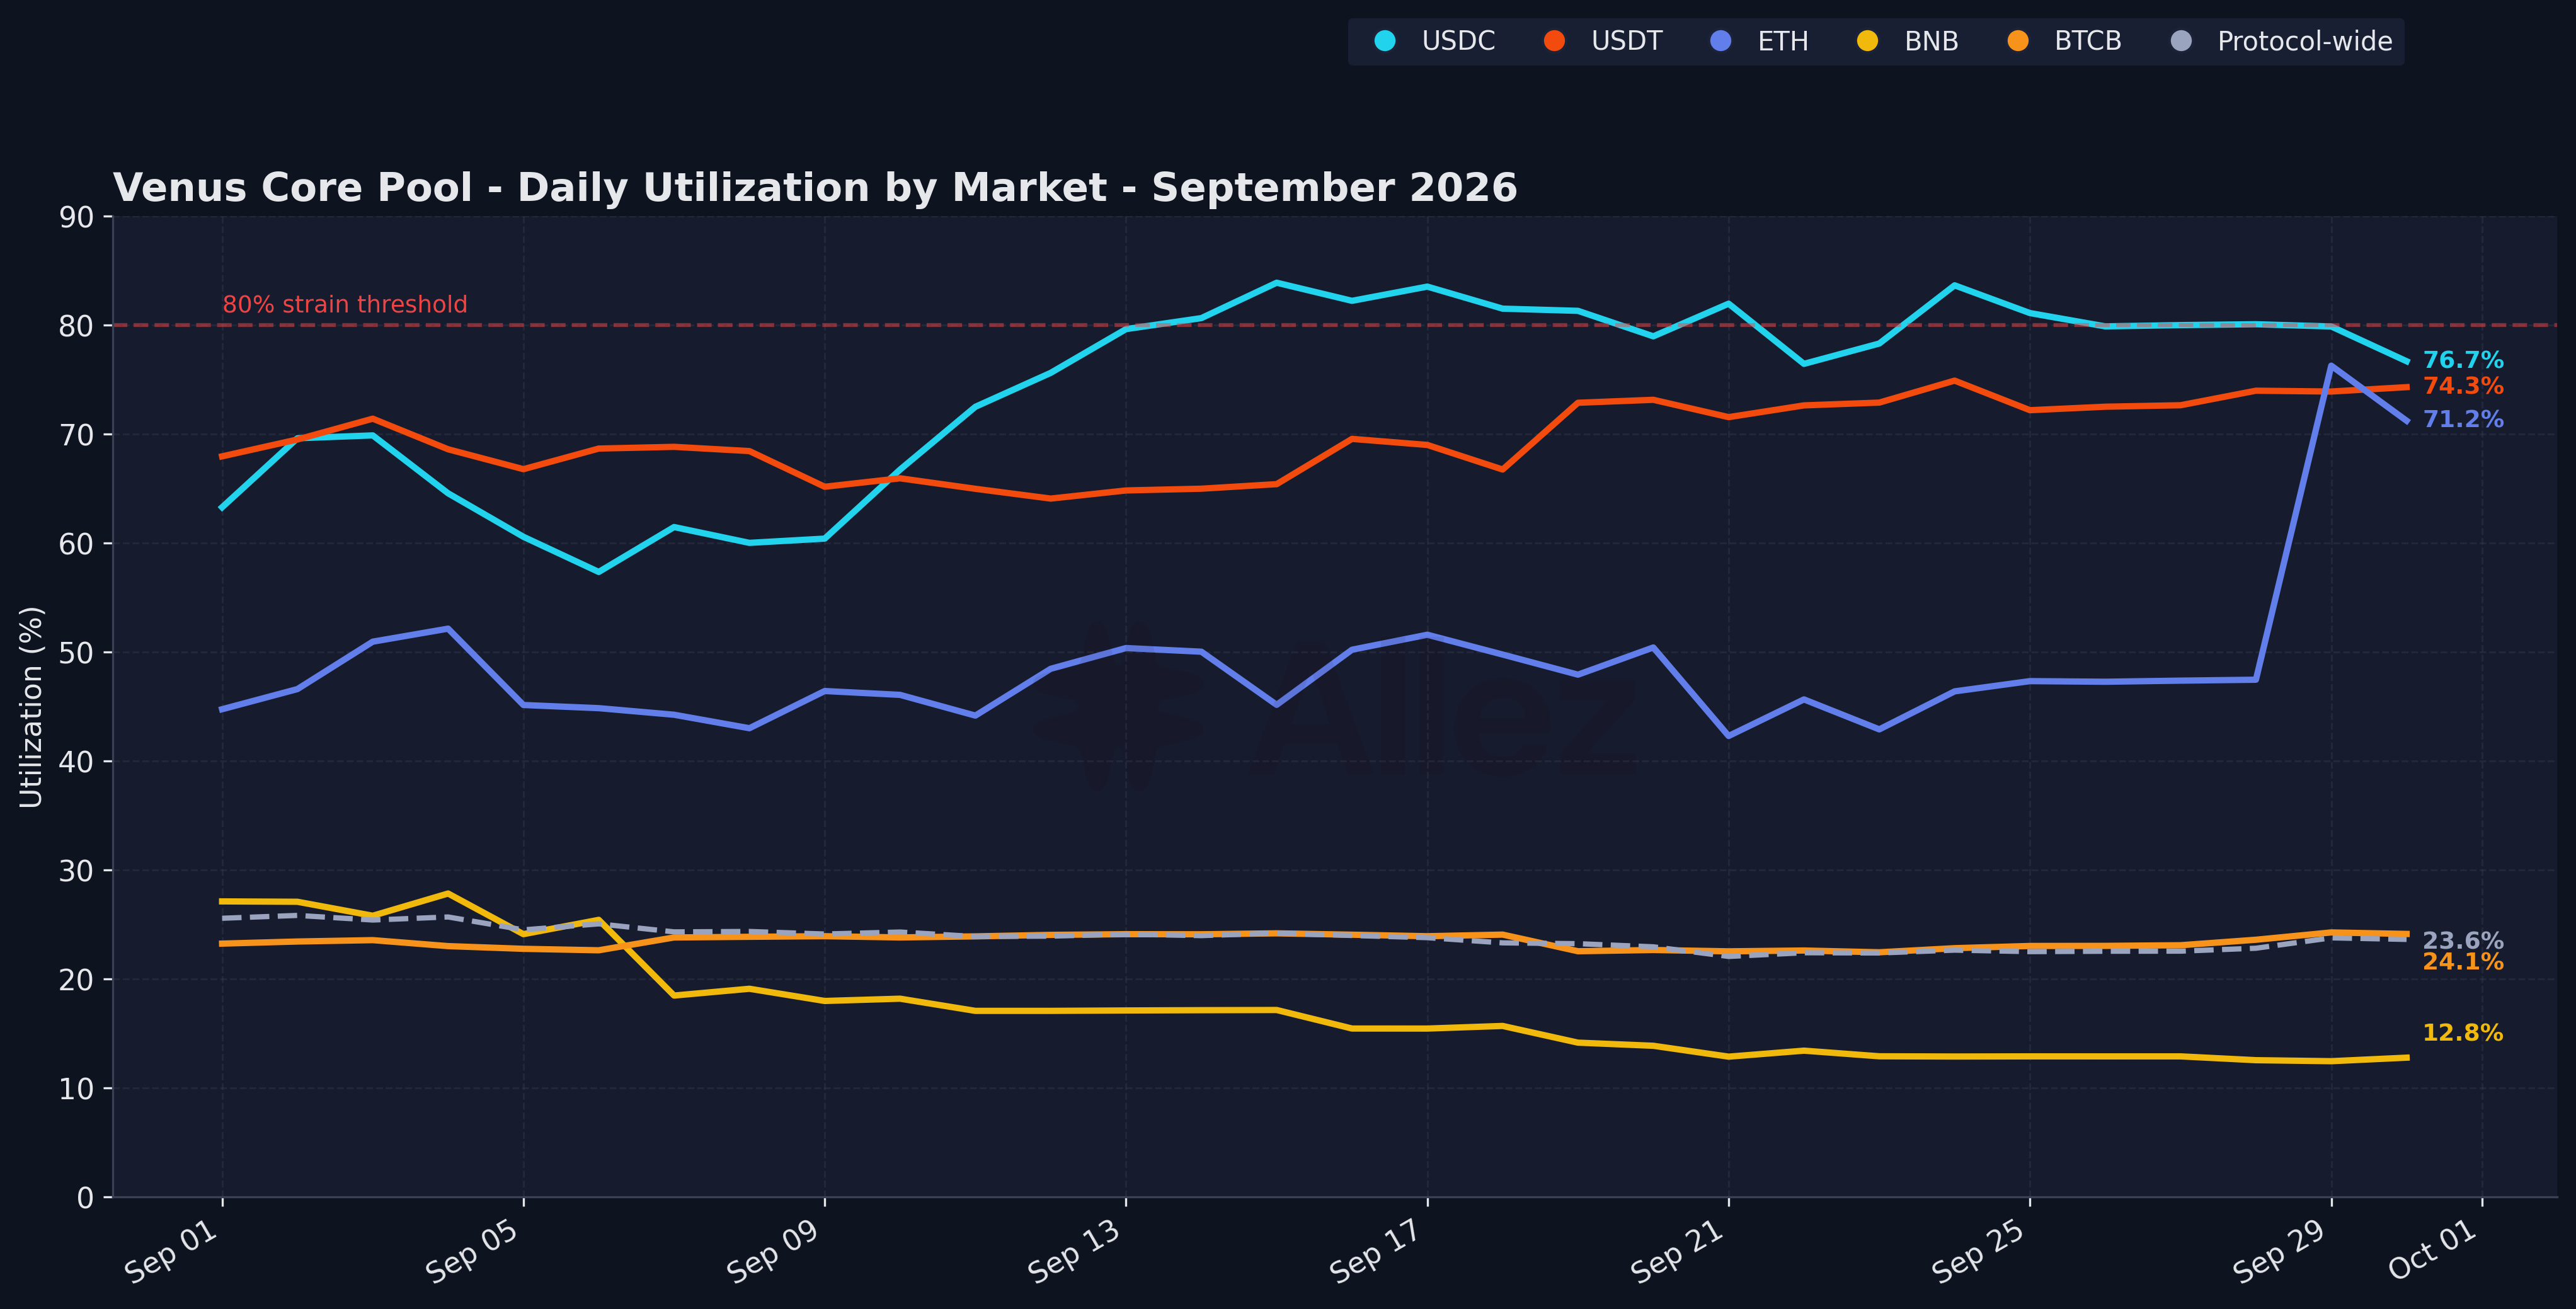
Protocol utilization eased from 25.9% to 23.6% as BNB borrowing fell (BNB utilization 29.2% to 12.8%). Stablecoin borrowing demand stayed strong: USDC was above 80% on 11 days, peaking at 83.9% on September 15, and closed at 76.7%. USDT closed at 74.3%. ETH utilization rose from 47.5% on September 28 to 76.3% on September 29, when 33 accounts, most of them new ETH borrowers, added $13.7M of ETH debt, $8.7M of it against BTCB. It closed the month at 71.2%.
6. Summary & Forward Look
Across September, position health materially improved in aggregate. Supply grew with tailwinds from appreciating BNB, BTC and ETH despite a modest deleveraging. Looking ahead, the protocol continues to produce opportunities for market participants including more fixed rate vaults, as well as continued expansion of the liquidity hub. From a risk perspective, the areas to watch are uncorrelated price movements between BTC and BNB which could push several large accounts to unwind.
August's watch items all improved: the four largest borrowers now hold 22.9% of debt (August: 32%), BNB debt fell $59.8M, and correlated debt within 10% of liquidation eased to $38.6M from $43.5M.
Things to watch in October:
-
BTC-only downside. $87.7M of collateral is at risk at a 30% BTC-only drop, against $50.7M in the uniform case.
-
BNB upside. $30.2M of collateral is at risk after a 20% BNB rise with other prices held. BNB rose 17.8% in August and 11.3% in September.
-
Stablecoin and ETH utilization. USDC spent 11 days above 80% and ETH utilization reached 76.3%. VIP-664's ETH E-mode group could add wBETH-backed ETH borrowing on top of that.
Readers can follow current Venus market and risk metrics on the Allez Venus Risk Dashboard.
Appendix: Asset Category Classification
| Category | Assets | Supply | Debt |
|---|---|---|---|
| BTC | BTCB, SolvBTC, xSolvBTC | $752.9M | $113.8M |
| BNB | BNB, WBNB, asBNB, slisBNB, PT-clisBNB | $541.9M | $63.9M |
| Stablecoins | USDT, USDC, U, USDe, sUSDe, lisUSD, FDUSD, DAI, USD1, BUSD, vhU, vhUSDT | $263.0M | $190.6M |
| ETH | ETH, wBETH, BETH | $79.5M | $35.4M |
| Altcoins | Cake, XRP, DOGE, ADA, DOT, FIL, LINK, UNI, AAVE, LTC, BCH, TRX, MATIC, THE, TWT, XVS, SOL | $79.7M | $2.3M |
| RWA | NVDAB, TSLAB, SPCXB, SKHYB (bStocks), XAUM (gold) | $0.7M | $0.0M |
Correlated positions hold collateral and debt in the same category (SolvBTC/BTCB, asBNB/BNB); uncorrelated positions borrow across categories and carry directional price exposure. The classification is account-level and does not measure e-mode enrollment.
Scope: Venus Core Pool on BNB Chain only.
This report represents independent risk analysis by Allez Labs for the Venus community.