October was a difficult month across DeFi markets - BNB declined 8.5% while the month concluded with the largest crypto hack ever. Through this, borrowers de-levered, repaying $48M of debt over the month with limited liquidations ($175k).
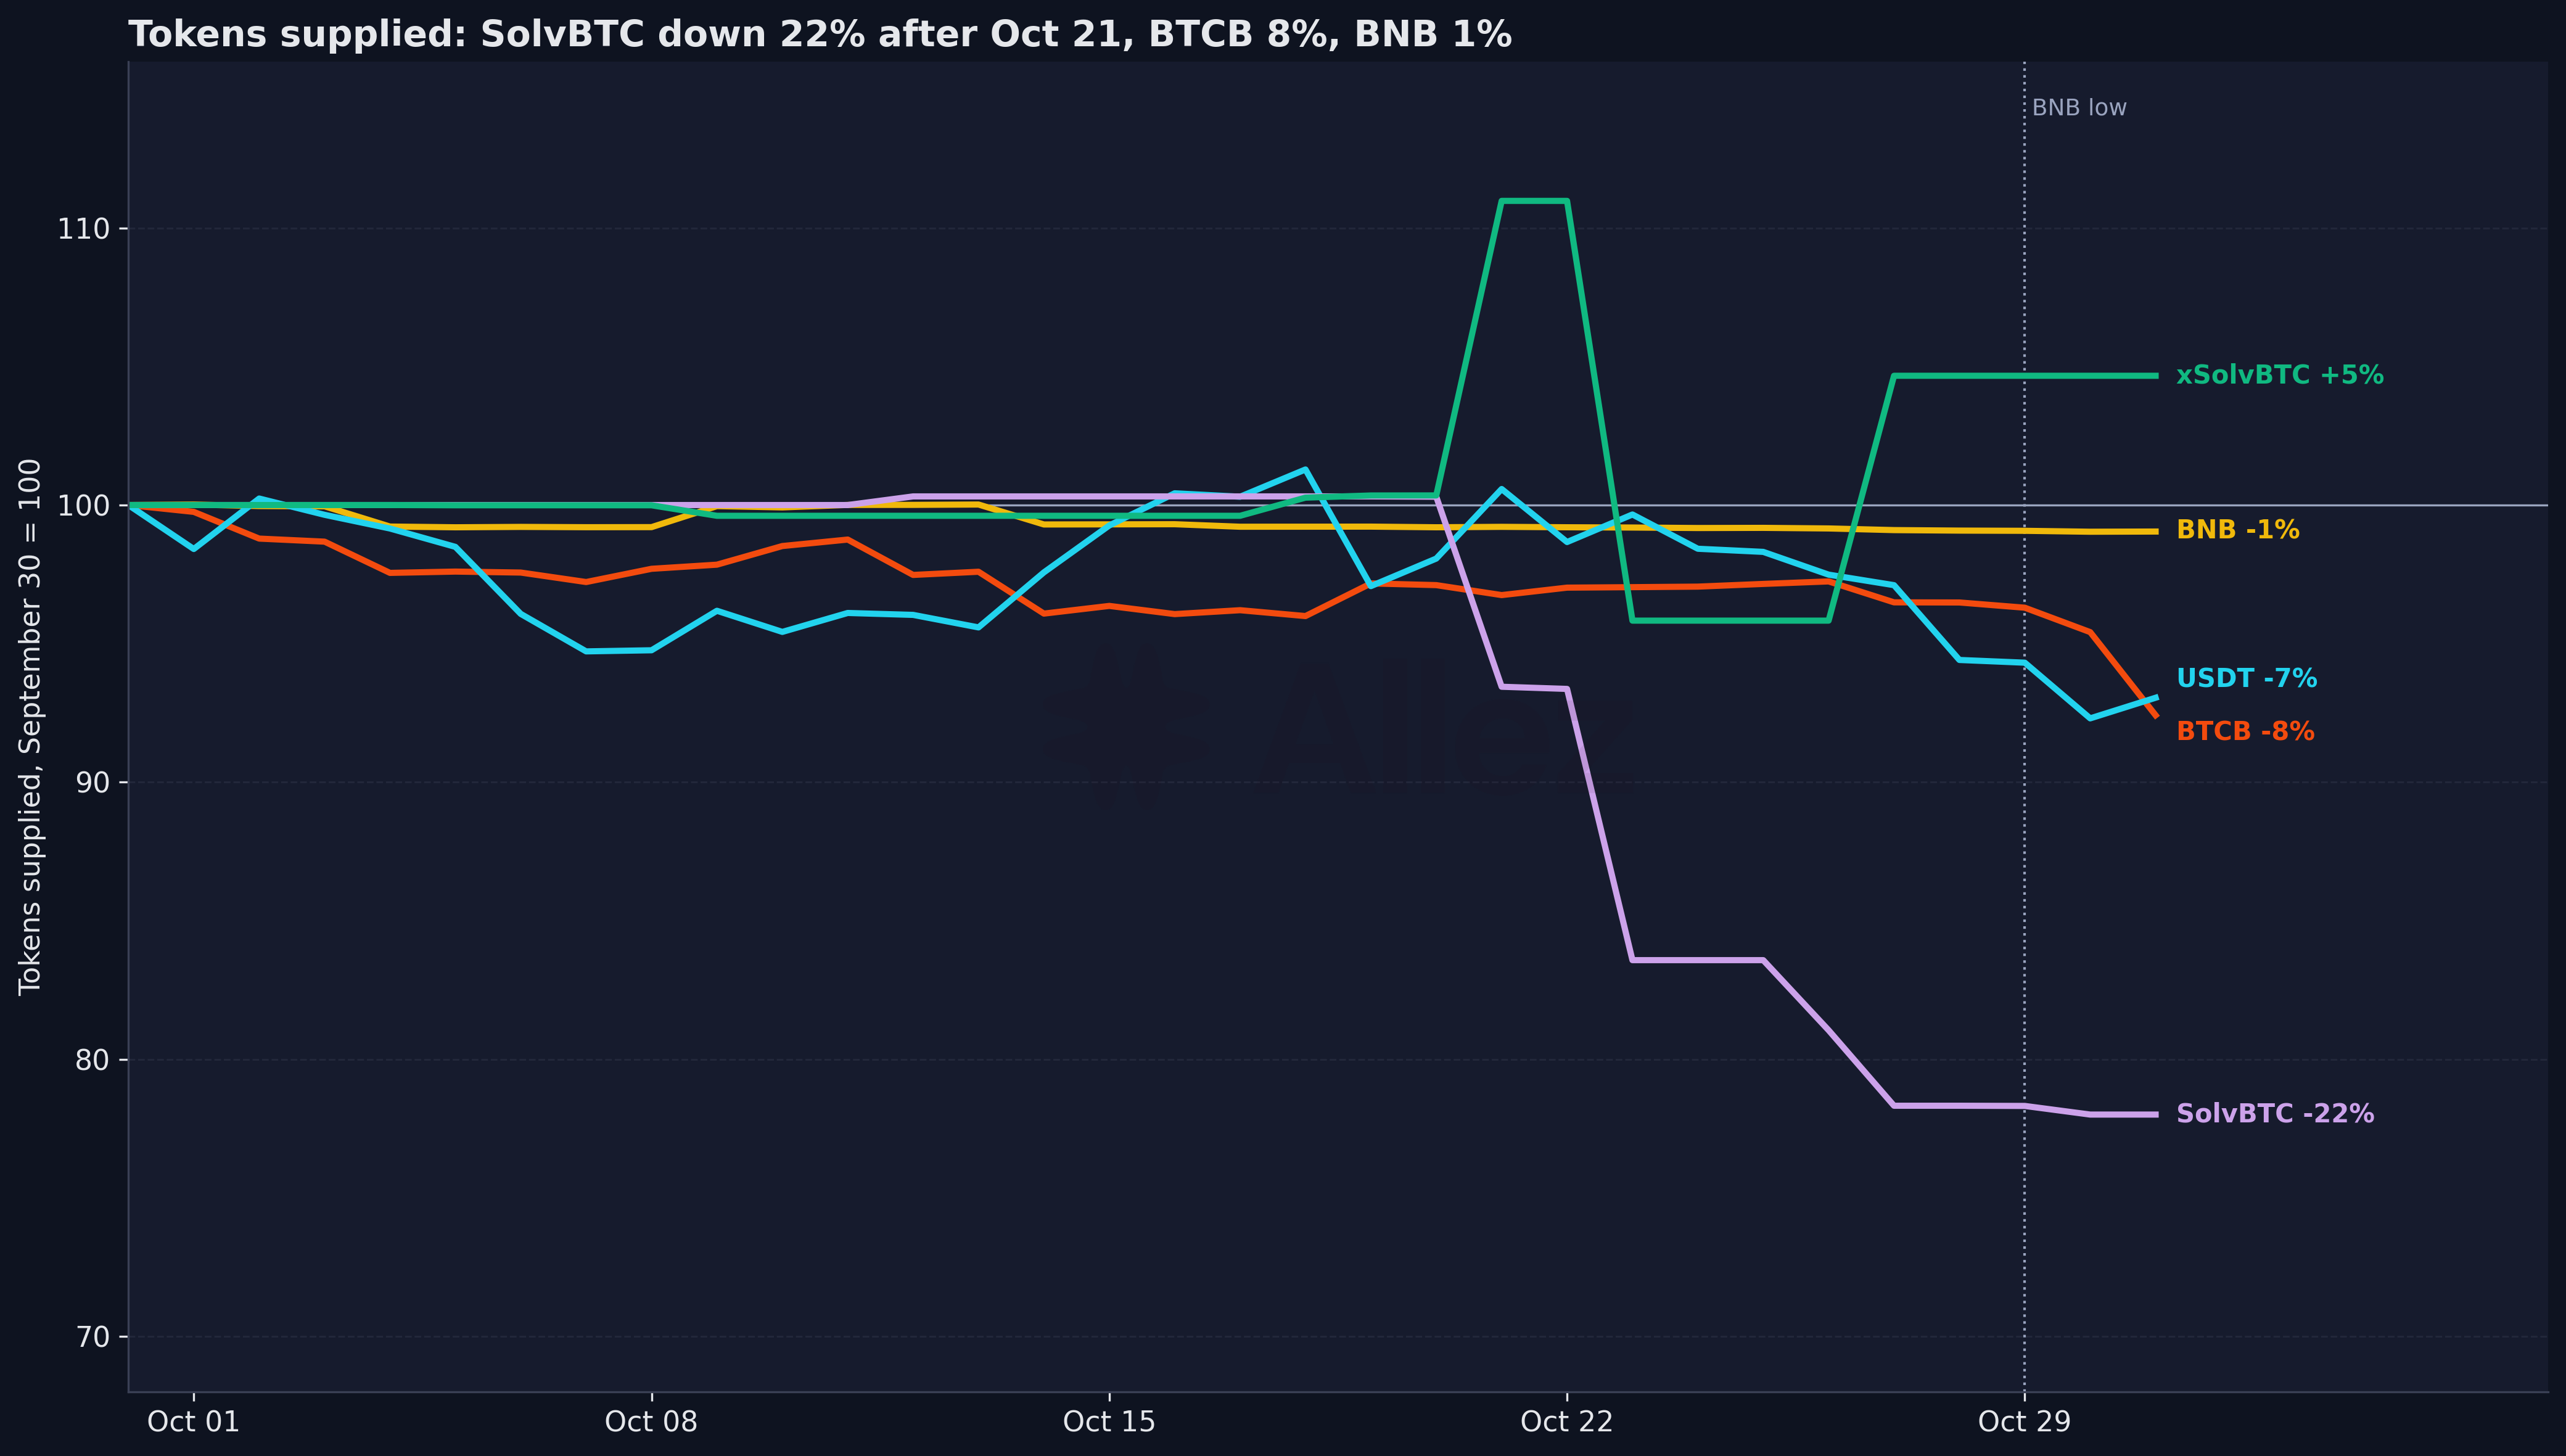
Total value supplied to Venus closed at $1.48B (-14.0%) while total debt ended the month at $337M (-16.9%). More than half of the supply side decline can be explained by price action ($133M of the $240M supply change), while net withdrawals, led by SolvBTC and BTCB, account for the rest.
The broader Venus ecosystem continued to grow, with Hub-Funded Spoke markets launching on October 23, with tokenized QQQ and SPY the first of these new markets; an ETH E-mode was launched; the Liquidity Hub continued to grow, 3.2x to $17.6M in total; and the protocol's automated risk system, 'EBrake' now covers the Liquidity Hub.
1. Market Context & BNB Price
-
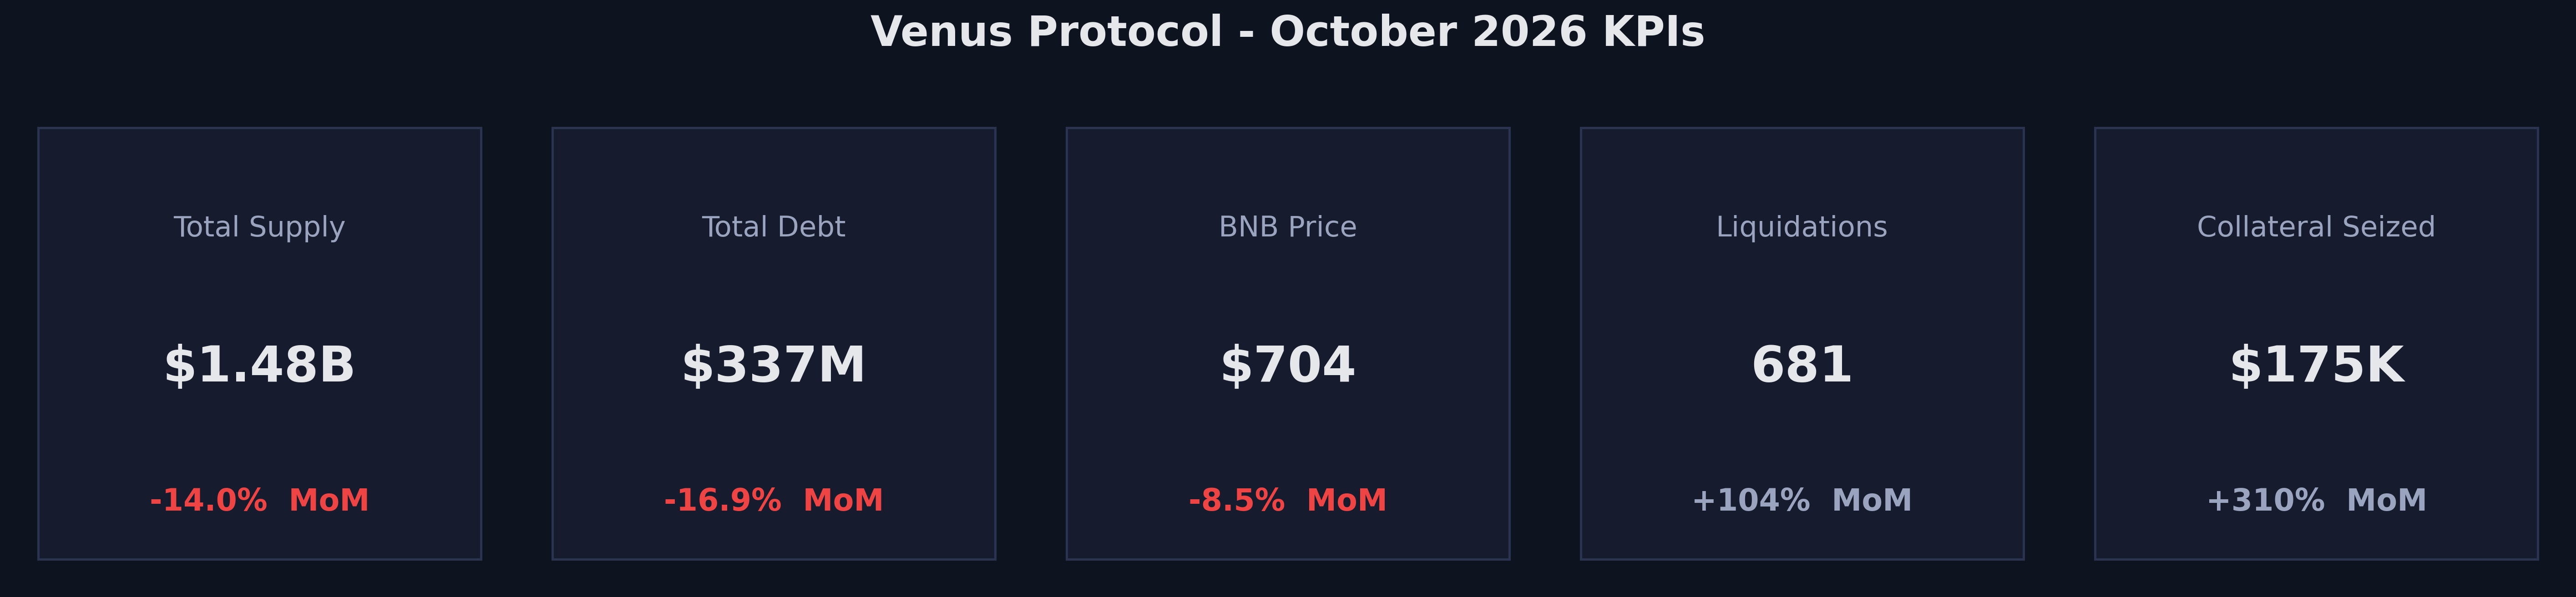
Total Supply: $1.48B (-14.0% MoM)
-
Total Debt: $337M (-16.9% MoM)
-
BNB Price: $704 (-8.5% MoM)
-
Liquidations: 681 events (+104% MoM)
-
Collateral Seized: $175K (+310% MoM)
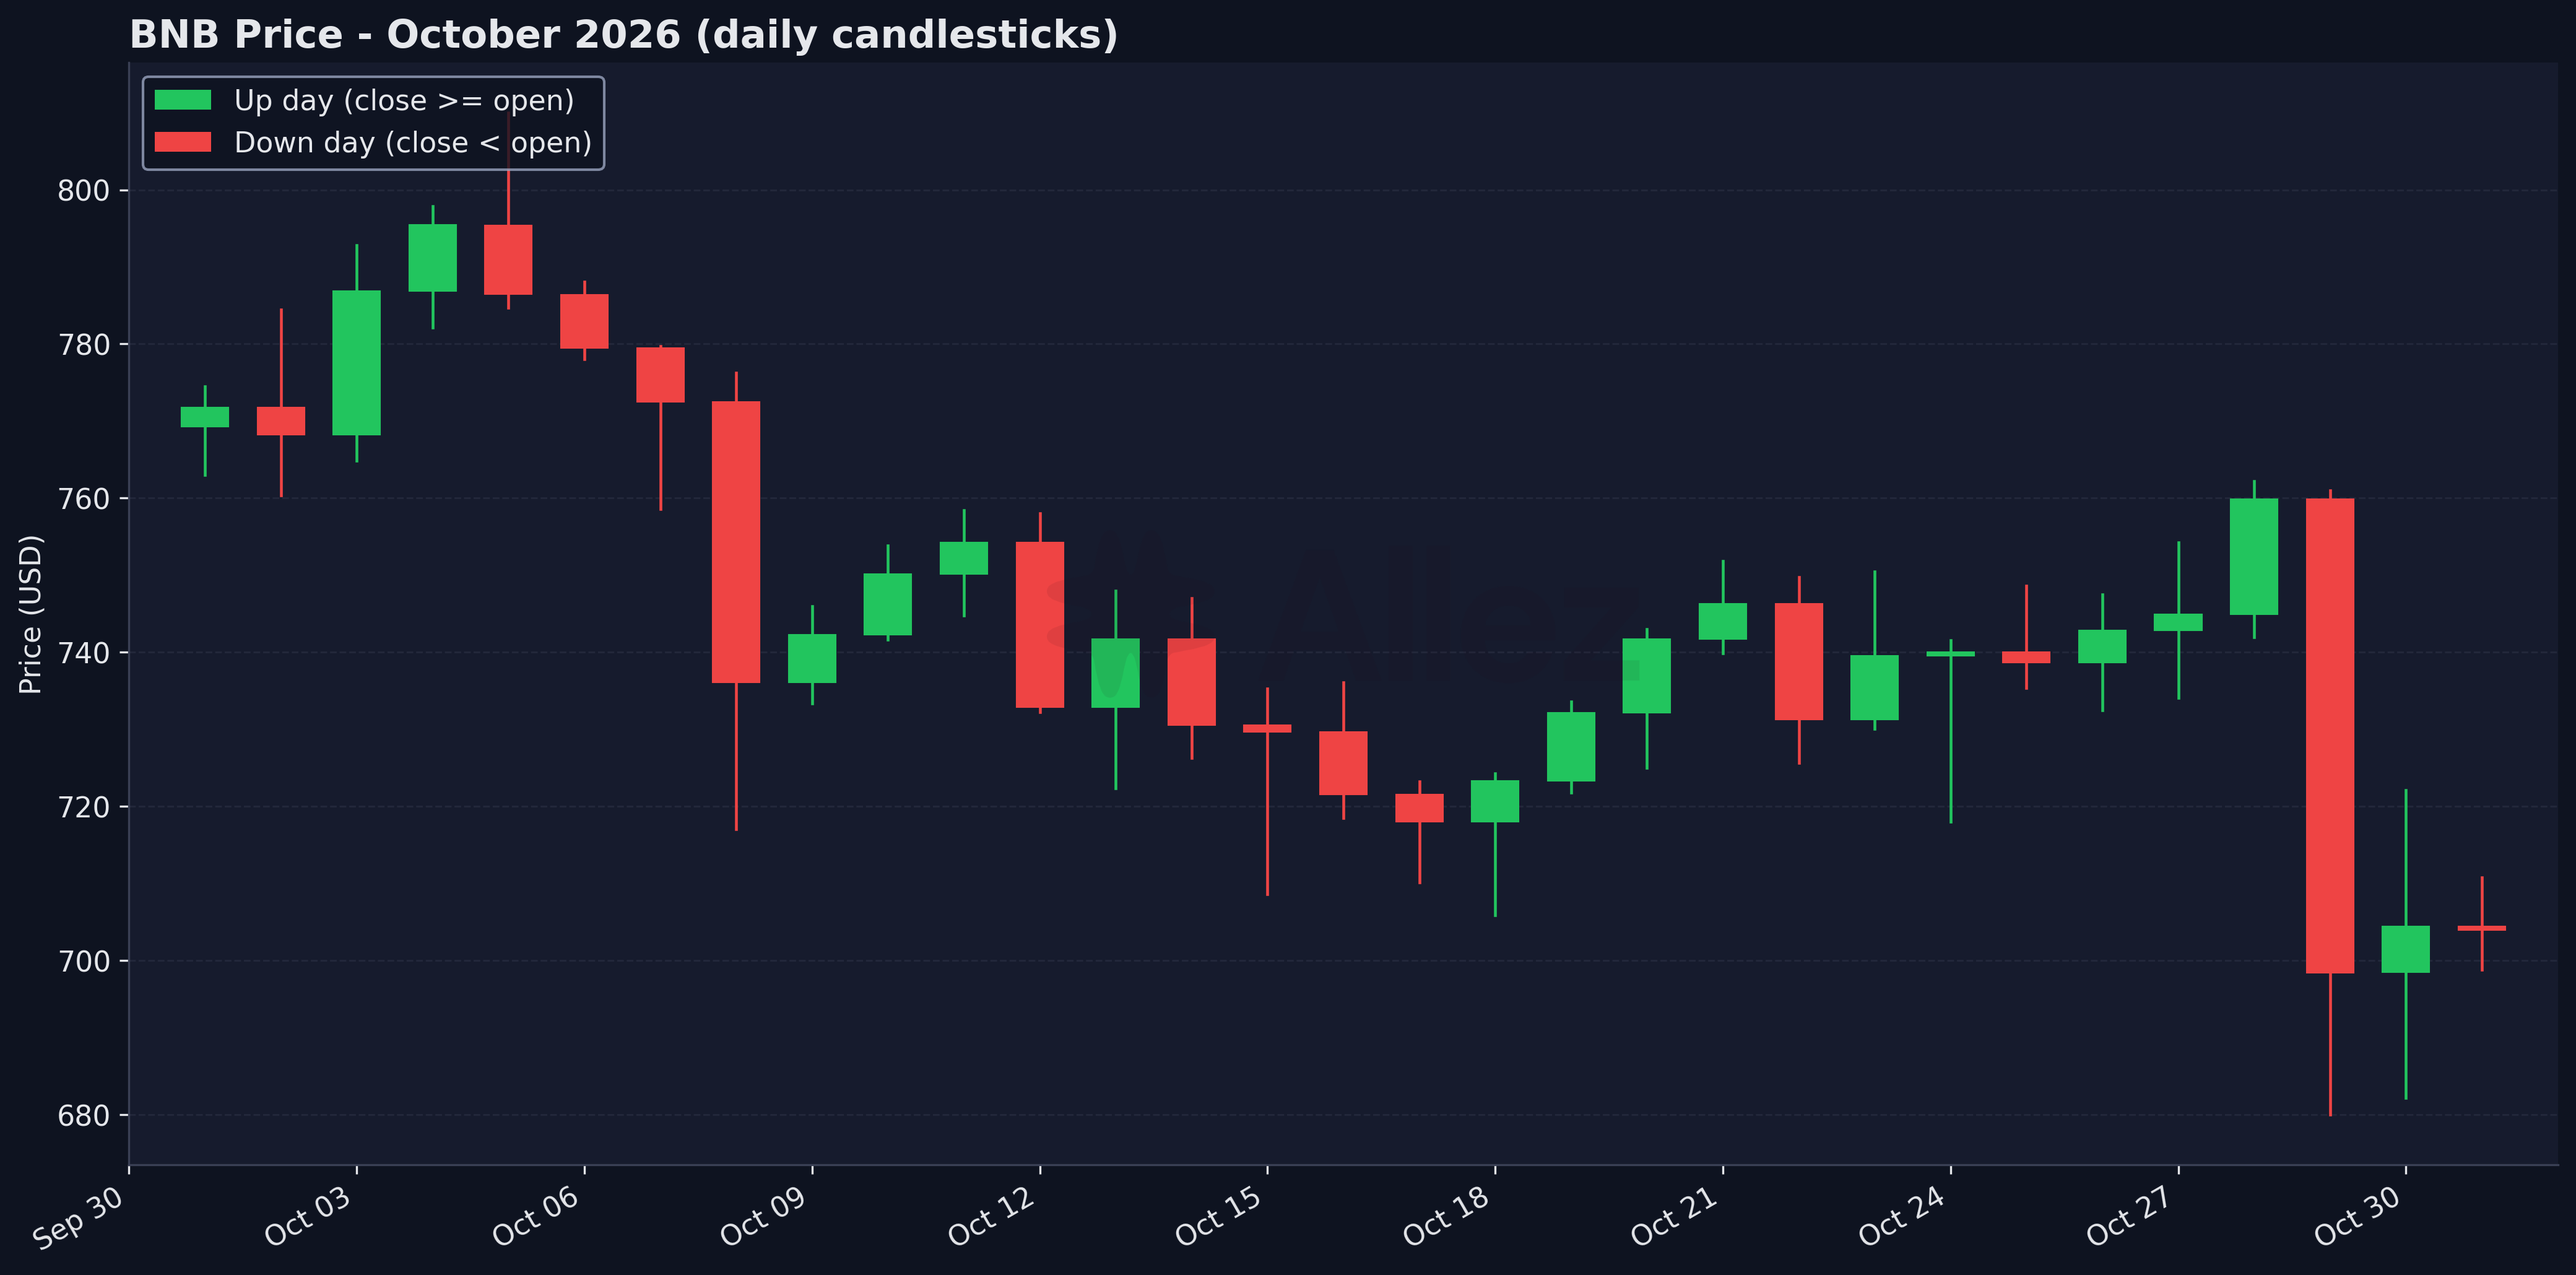
BNB opened October at $769, peaked at $810 on October 5, set its low of $680 on October 29 and closed at $704 (-8.5%). BTC fell 7.4% and ETH 16.2%.
Venus Ecosystem Updates:
-
VIP-664** (October 3).** ETH E-mode with wBETH collateral at 90% CF and 93% LT to support ETH looping.
-
VIP-666** and VIP-667 (October 12).** The Liquidity Hub added USDC Centrifuge, and Venus listed the Hash Global hBNB Fixed-Term Institutional Loan Vault.
-
Hub-Funded Spoke markets** (VIP-668 to VIP-670, October 23).** Spoke pools which represent the next phase of Venus market developments were launched with the first pool, allowing QQQB and SPYB collateral.
-
VIP-673** (October 30).** Venus' automated risk system, 'EBrake' is now enabled for the liquidity hub.
-
Network sunset (October 23). Venus continued deprecation of opBNB, Optimism and Unichain deployments.
-
Other. VIP-665 allocated $50K for October Prime rewards; VIP-672 upgraded Prime with support for migrating leveraged positions.
2. Supply & Market Overview
Top markets by supply (October 31, 2026):
| Market | Supply | MoM | Token MoM | Debt | Utilization |
|---|---|---|---|---|---|
| BTCB | $402.8M | -14.5% | -7.6% | $81.6M | 20.3% |
| BNB | $394.7M | -9.5% | -1.0% | $31.6M | 8.0% |
| USDT | $169.0M | -7.0% | -7.0% | $142.5M | 84.3% |
| SolvBTC | $155.6M | -27.8% | -22.0% | $0.2M | 0.1% |
| WBNB | $69.6M | -9.6% | -1.0% | $7.4M | 10.7% |
| xSolvBTC | $64.4M | -3.1% | +4.7% | $0.0M | 0.0% |
| ETH | $44.1M | -9.3% | +8.2% | $17.6M | 39.9% |
| U | $32.8M | +14.2% | +14.3% | $19.4M | 59.0% |
| USDC | $31.8M | -21.9% | -21.9% | $29.4M | 92.5% |
| wBETH | $25.1M | -18.4% | -2.8% | $0.8M | 3.1% |
Total supply ended at $1.48B, $240M below September. Lower prices account for $133M and net withdrawals, valued at October 31 prices, for $107M. SolvBTC ($43.9M) and BTCB ($33.1M) led the withdrawals; one account removed $21.1M of SolvBTC as it closed a BTCB loop (Section 5). One account also withdrew $15.9M of UNI. U was the largest inflow (+14.3% of tokens, $4.1M).
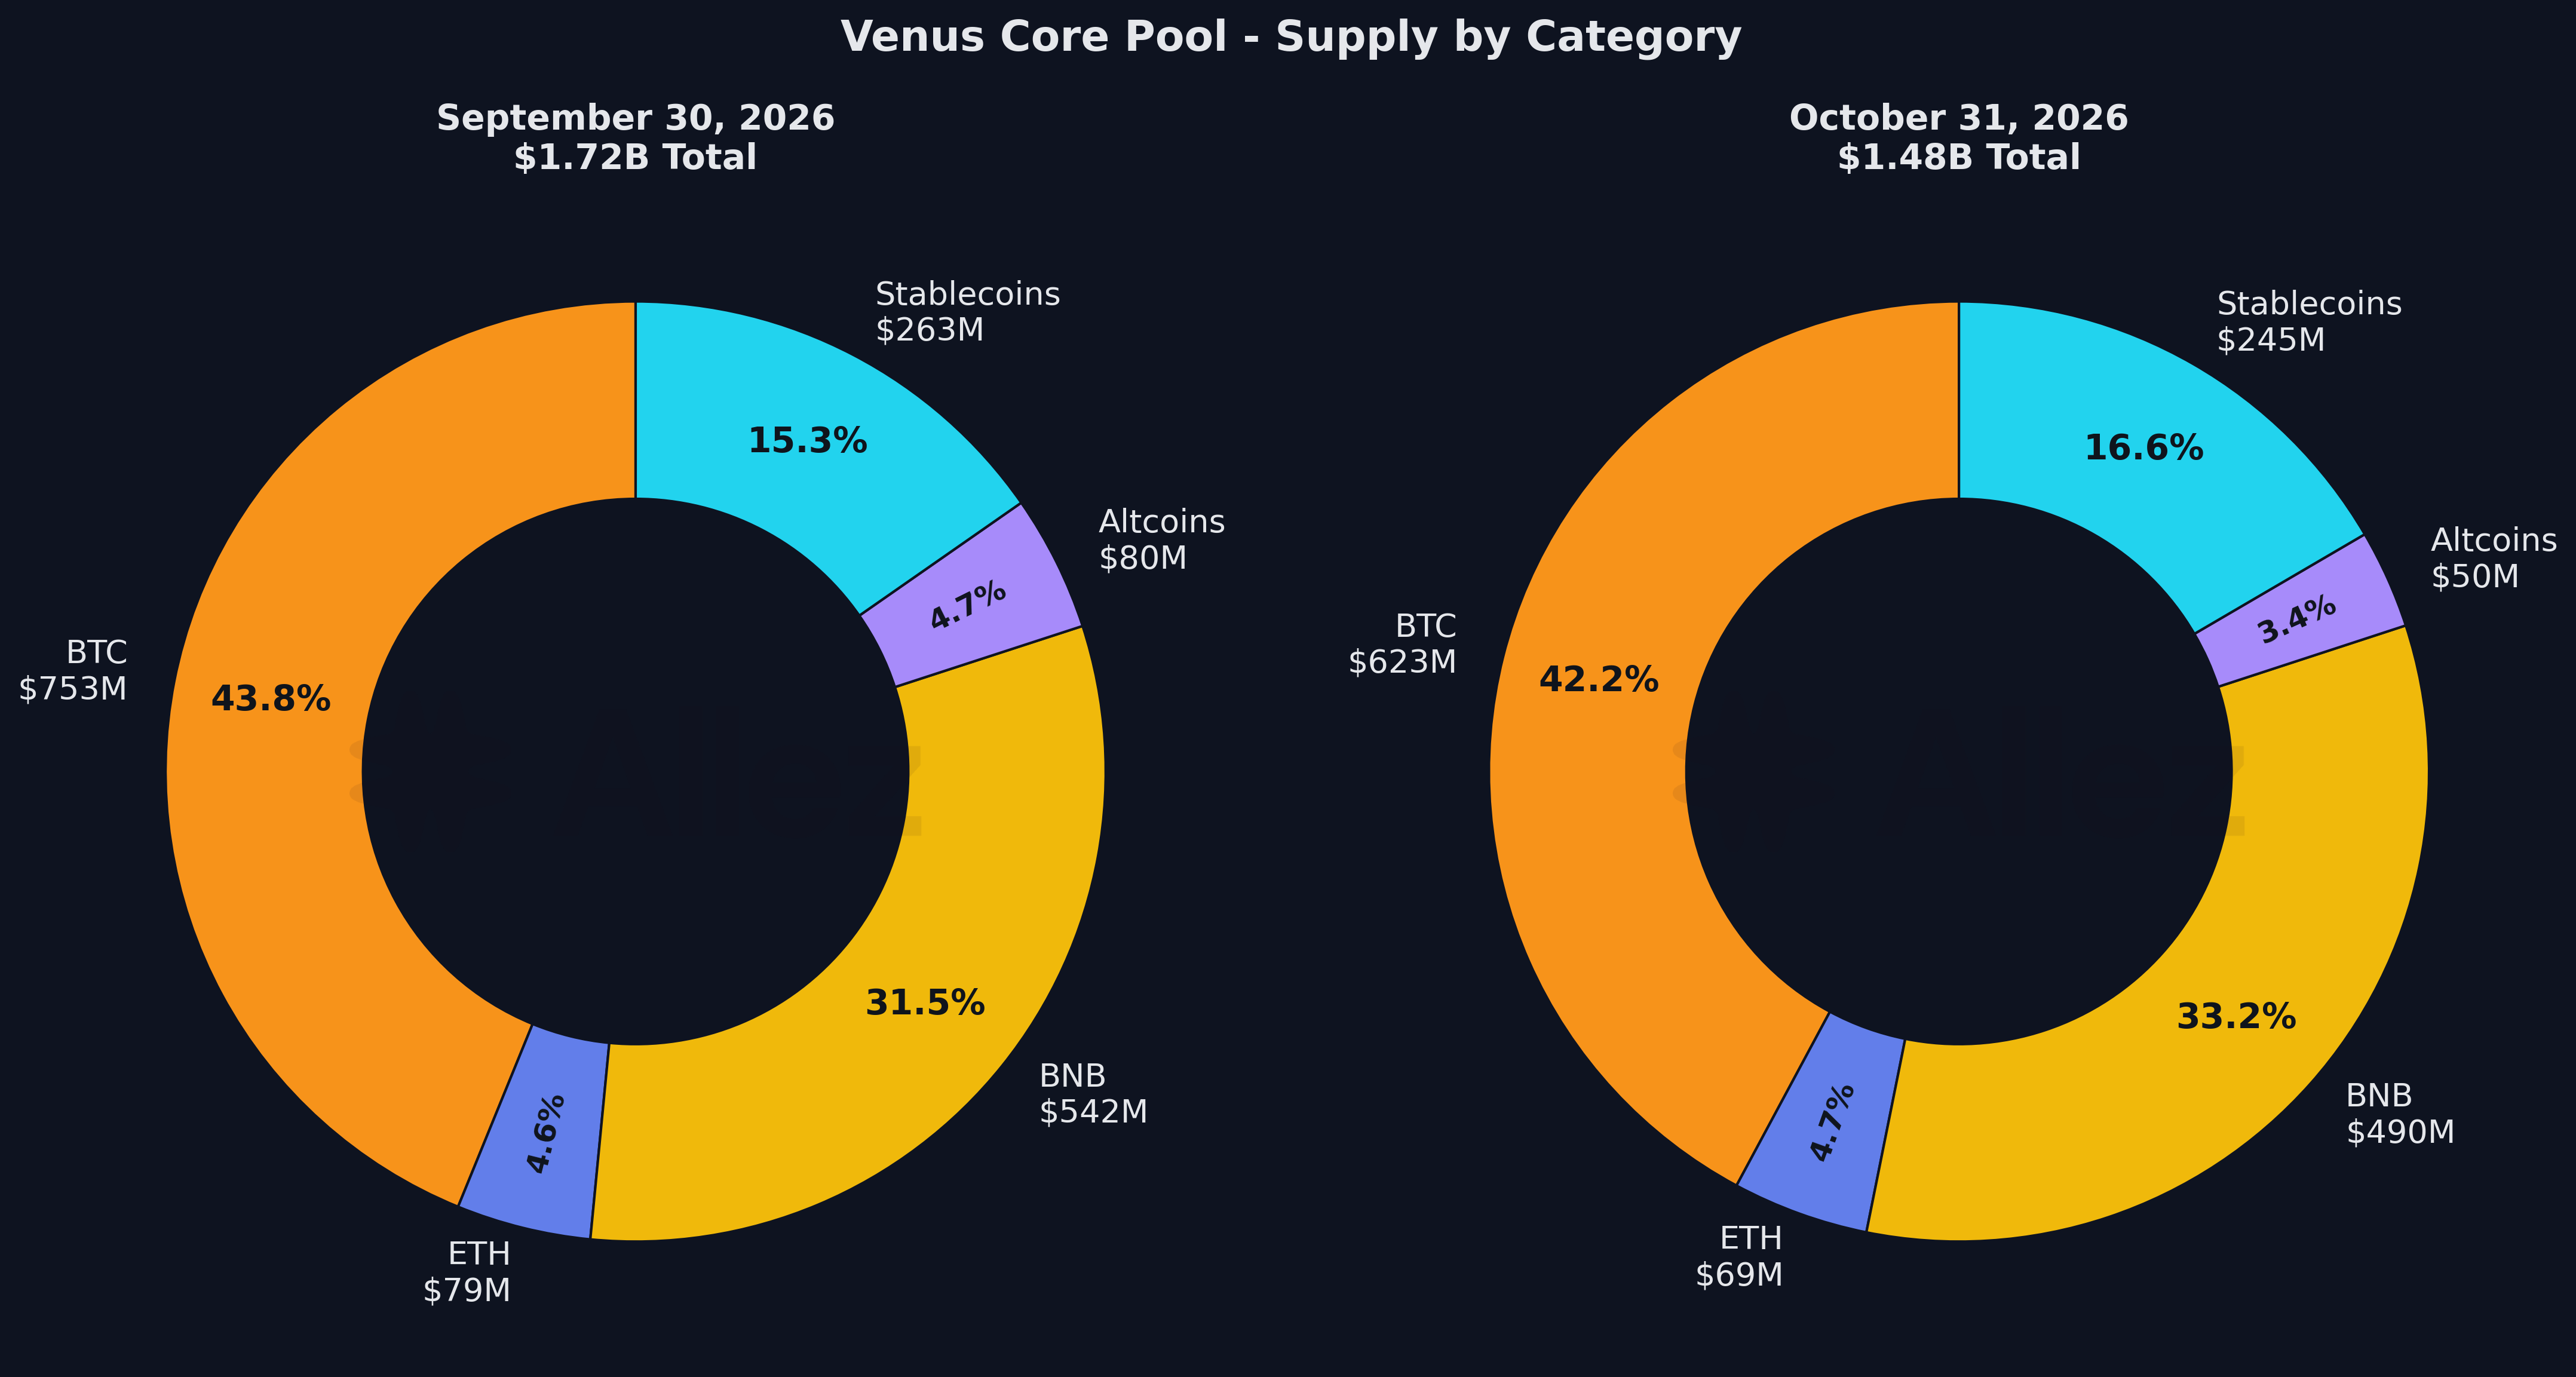
Category composition (October 31, 2026):
| Category | Supply | MoM | Share | Debt |
|---|---|---|---|---|
| BTC | $622.8M | -17.3% | 42.2% | $81.8M |
| BNB | $490.3M | -9.5% | 33.2% | $39.1M |
| Stablecoins | $245.0M | -6.9% | 16.6% | $197.2M |
| ETH | $69.3M | -12.8% | 4.7% | $18.3M |
| Altcoins (incl. $0.4M RWA) | $50.2M | -37.6% | 3.4% | $0.9M |
BTC's share eased 1.6pp on the SolvBTC and BTCB withdrawals. The altcoin decline is mostly the single UNI withdrawal.
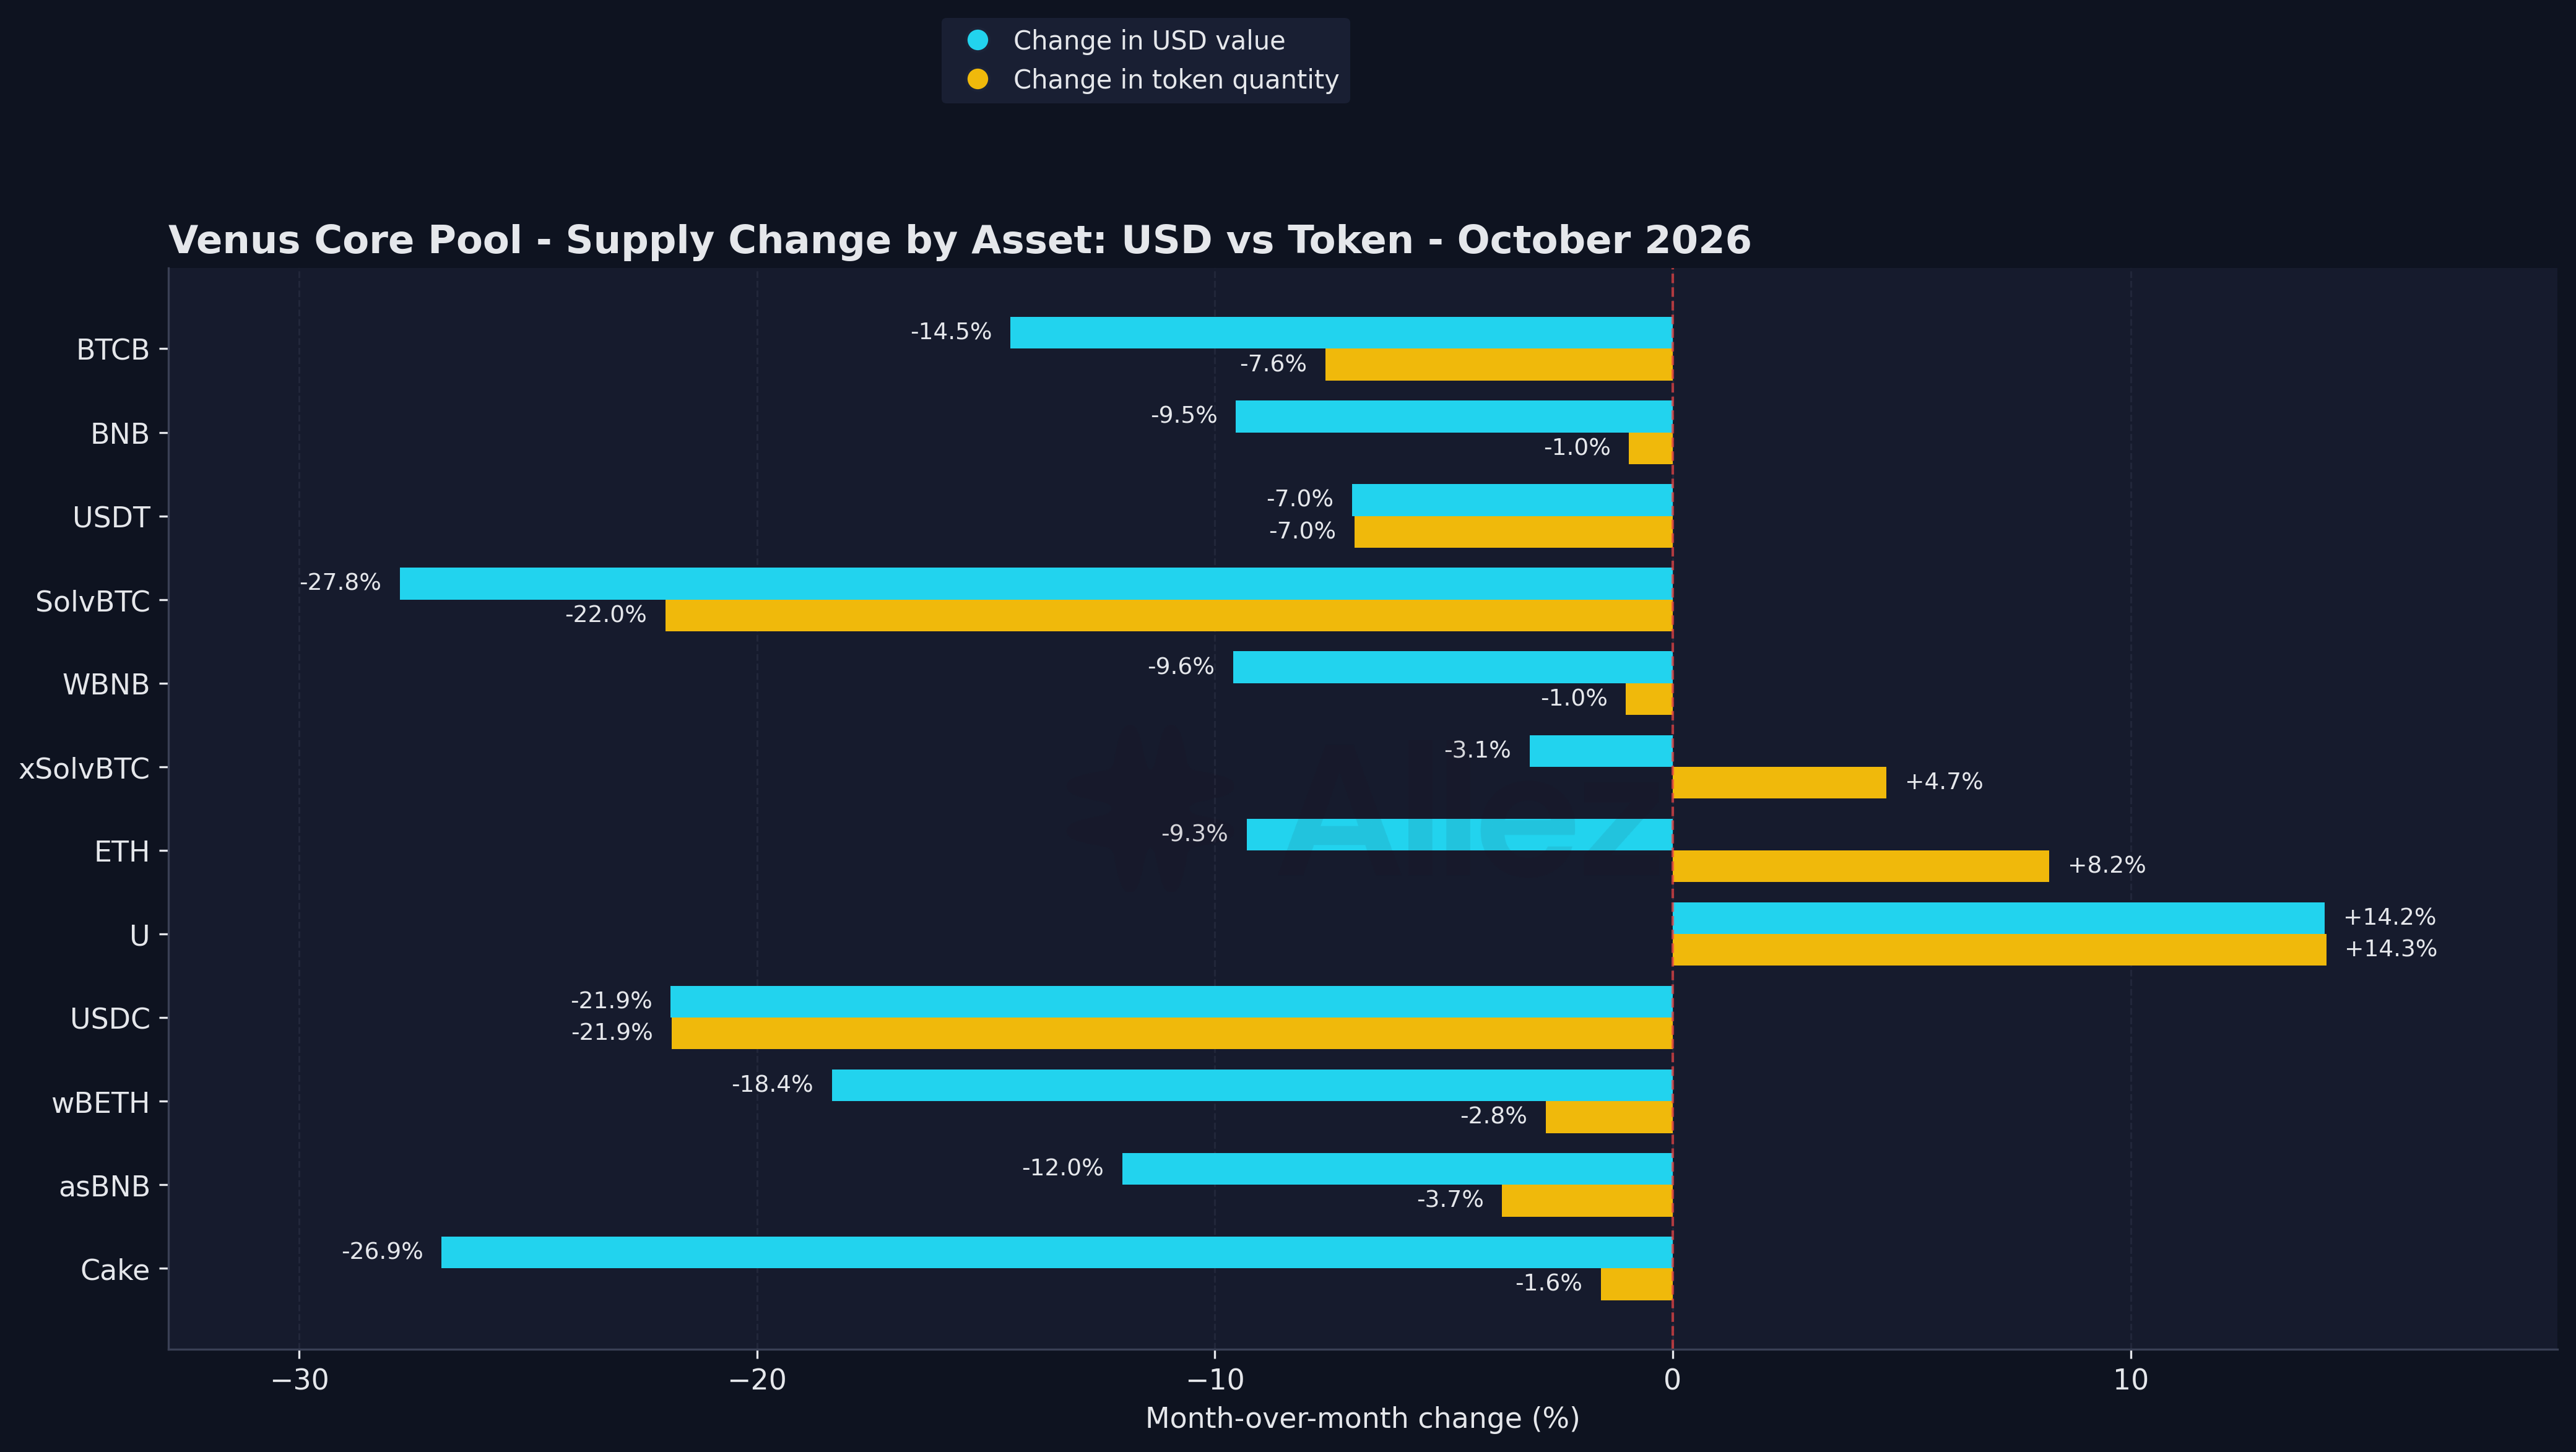
The decline in debt was mostly attributed to Borrowers repaying $48M of debt, while a decline in debt values reduced it by another $20M ($69M in total). Repayment was concentrated in BTCB ($23.6M), BNB ($19.3M) and ETH ($11.4M), while USDT was the only market where debt grew materially, up $7.5M to $142.5M, almost all of it borrowed against BTCB (+$7.0M on the BTCB/USDT pair).
3. Liquidity Hub
Liquidity Hub deposits grew 3.2x in October, from $5.5M to $17.6M, mostly stemming from U. $10M in liquidity was supplied on October 6, 10xing the supply. USDC deposits rose from $0.3M to $1.3M and USDT from $4.3M to $5.3M.
| Hub | Oct 1 | Oct 31 | Core Pool | Centrifuge | Other |
|---|---|---|---|---|---|
| U | $0.8M | $11.0M | $10.8M | - | $0.2M |
| USDT | $4.3M | $5.3M | $4.2M | $1.0M | $0.05M |
| USDC | $0.3M | $1.3M | $1.2M | $0.01M | $0.02M |
| Total | $5.5M | $17.6M | $16.3M | $1.0M | $0.3M |
At month-end, 93% of Hub deposits were lent into Core Pool markets. A share of Core Pool stablecoin supply now comes through the Hub. Since the first Spoke market (QQQ and SPY collateral) launched on October 23, the three hubs have lent it $0.1M, a small first allocation.
4. Risk & Liquidations
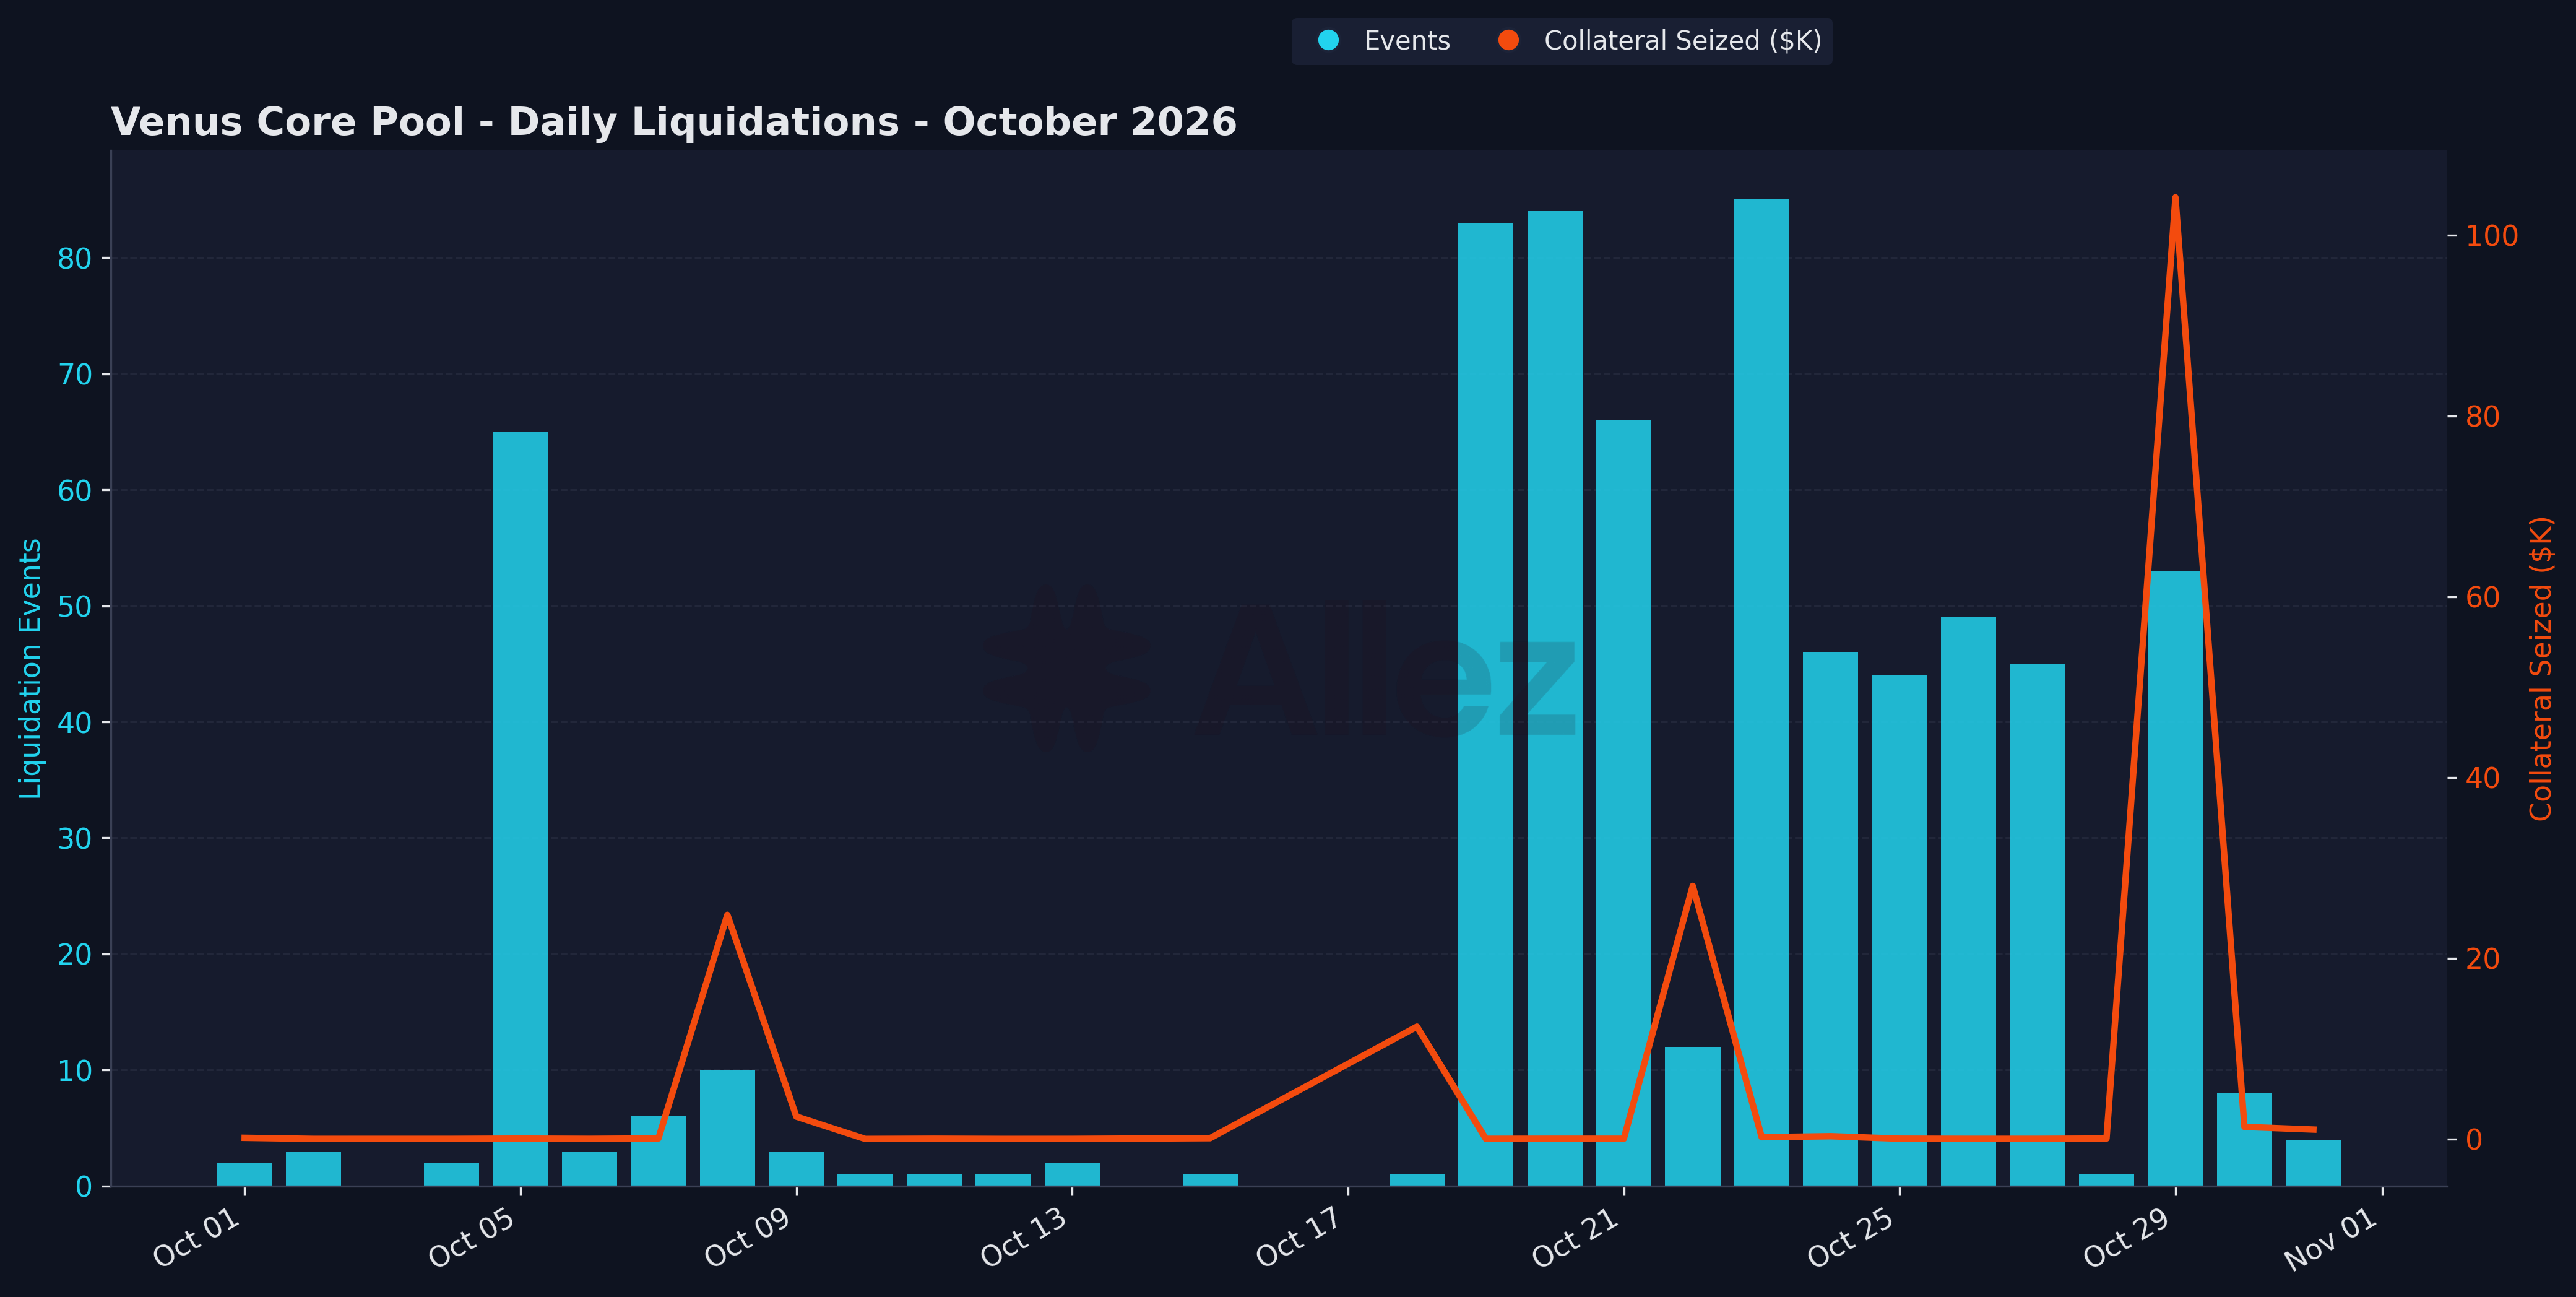
Liquidation summary:
| Metric | October Total |
|---|---|
| Total events | 681 |
| Collateral seized | $175,282 |
| Debt repaid | $158,026 |
| Peak day (by value) | Oct 29 (53 events, $104,181) |
| Peak day (by count) | Oct 23 (85 events, $196) |
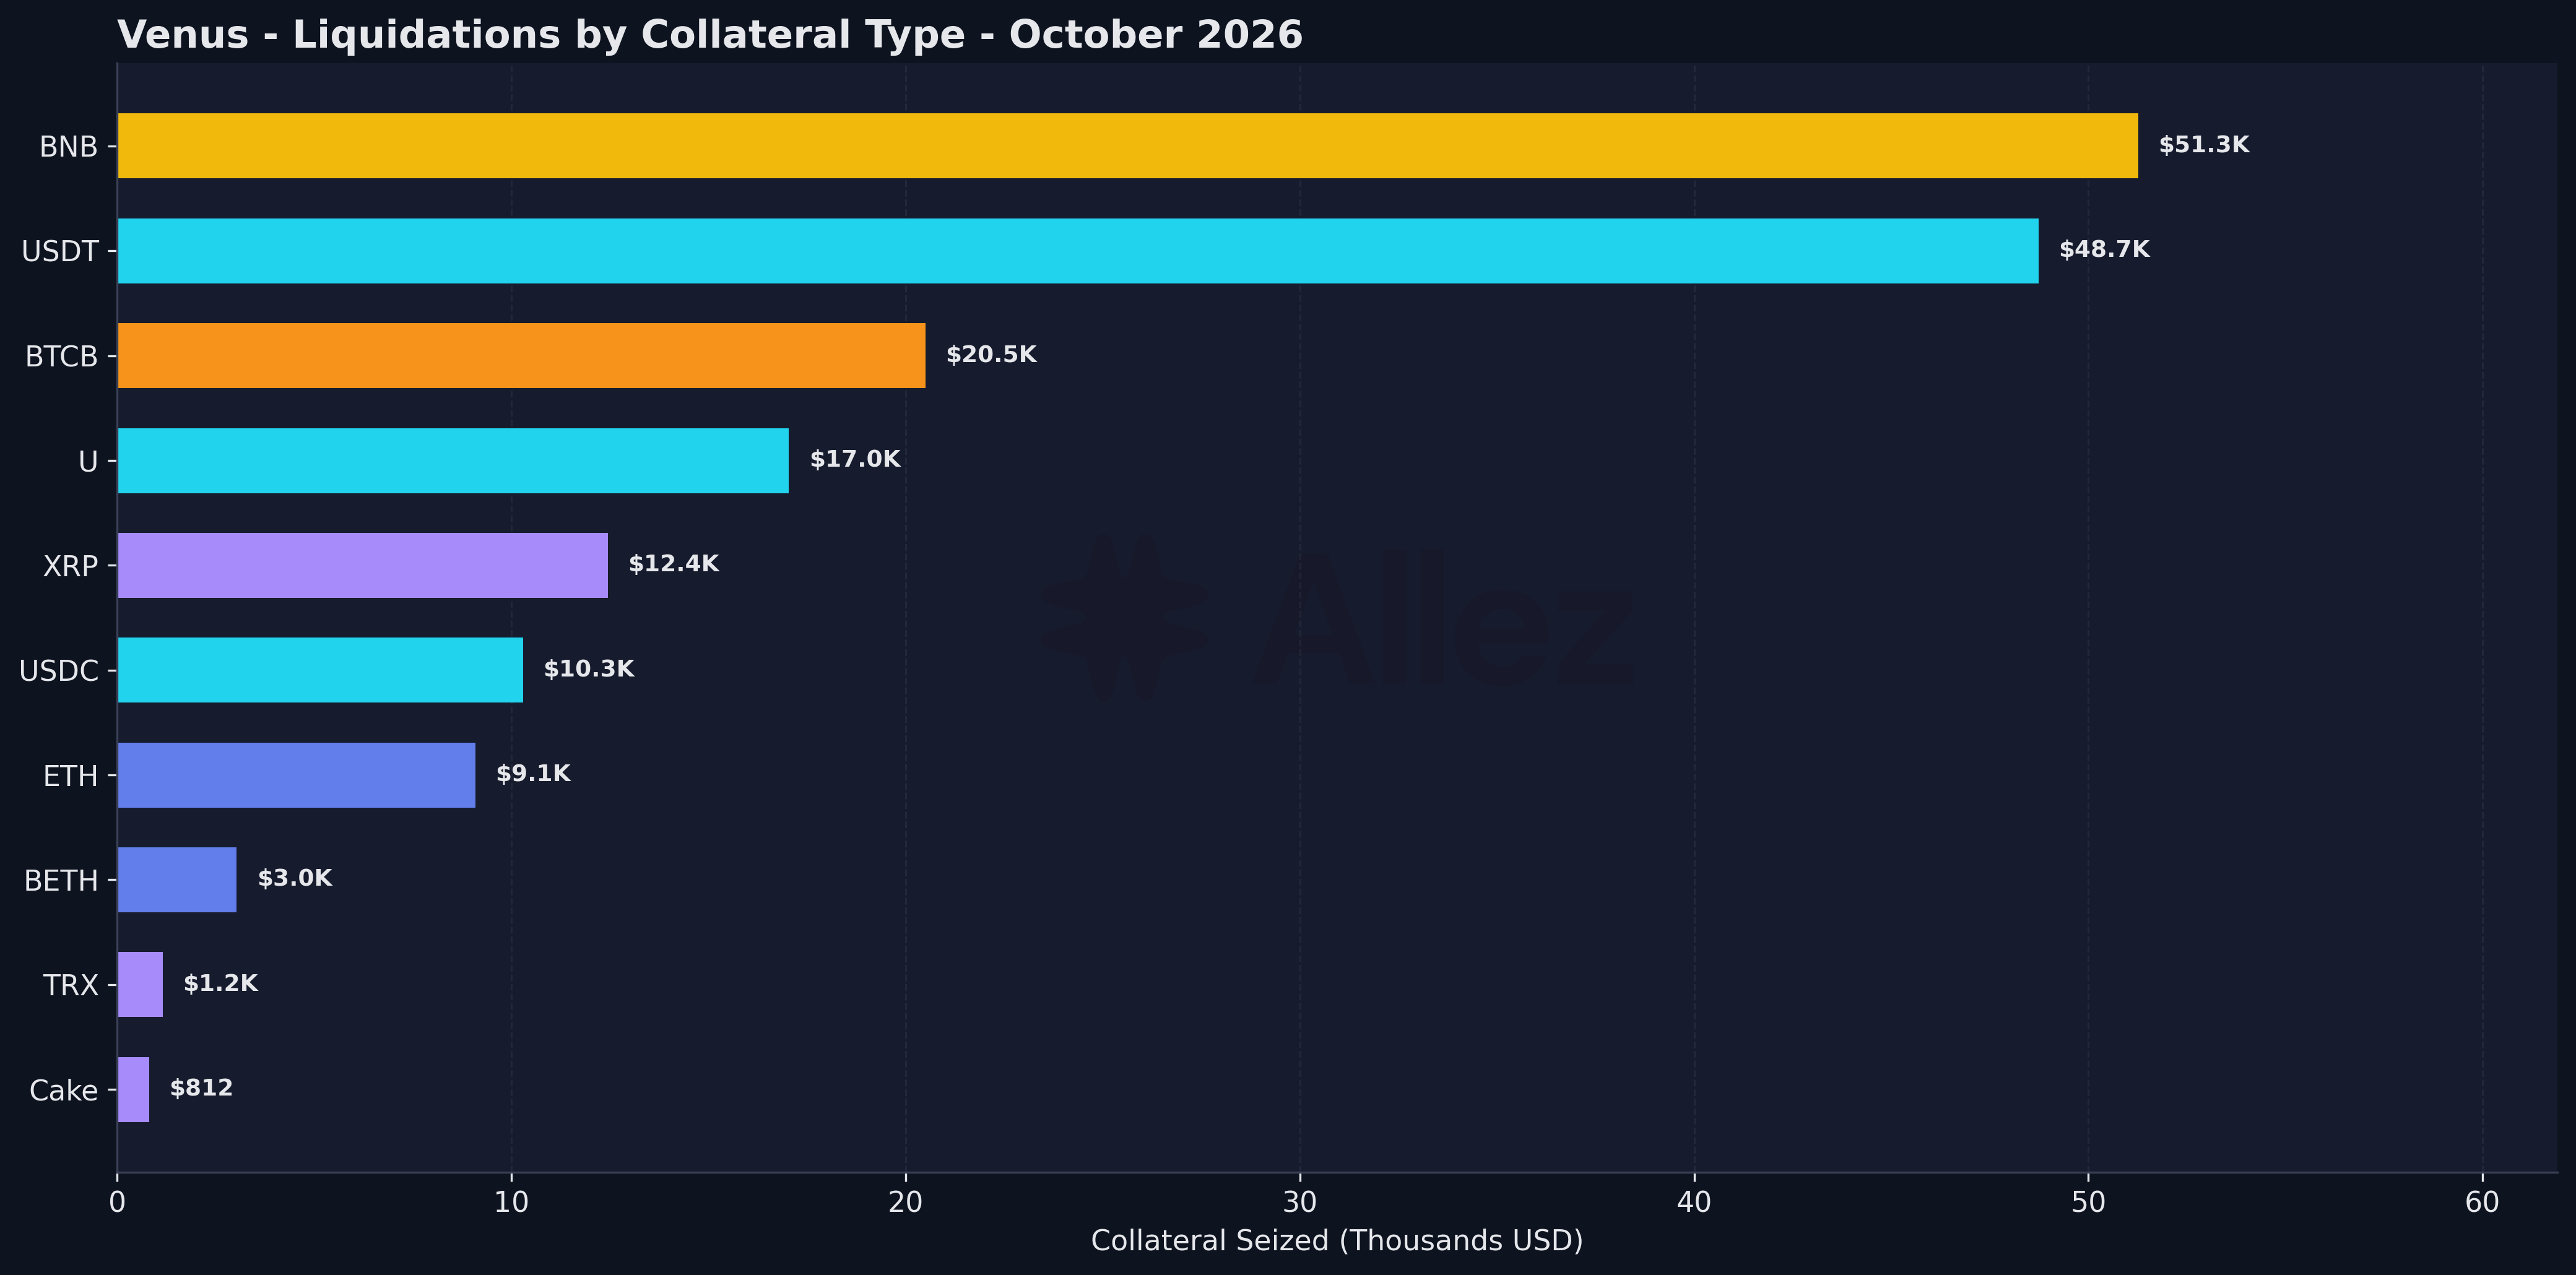
Total value liquidated remained small in value - in total, 681 events seized $175K (September: 334 events, $42.8K). Two collateral-debt pairs accounted for 57% of the seized value: BNB collateral against USDT debt ($51K, 14 events) and USDT collateral against BNB debt ($49K, 55 events).
October 29 (The day of the Binance hack) accounted for 59% of the month's liquidated value. Primarily from BNB and BTC collateralized stablecoin debt positions.
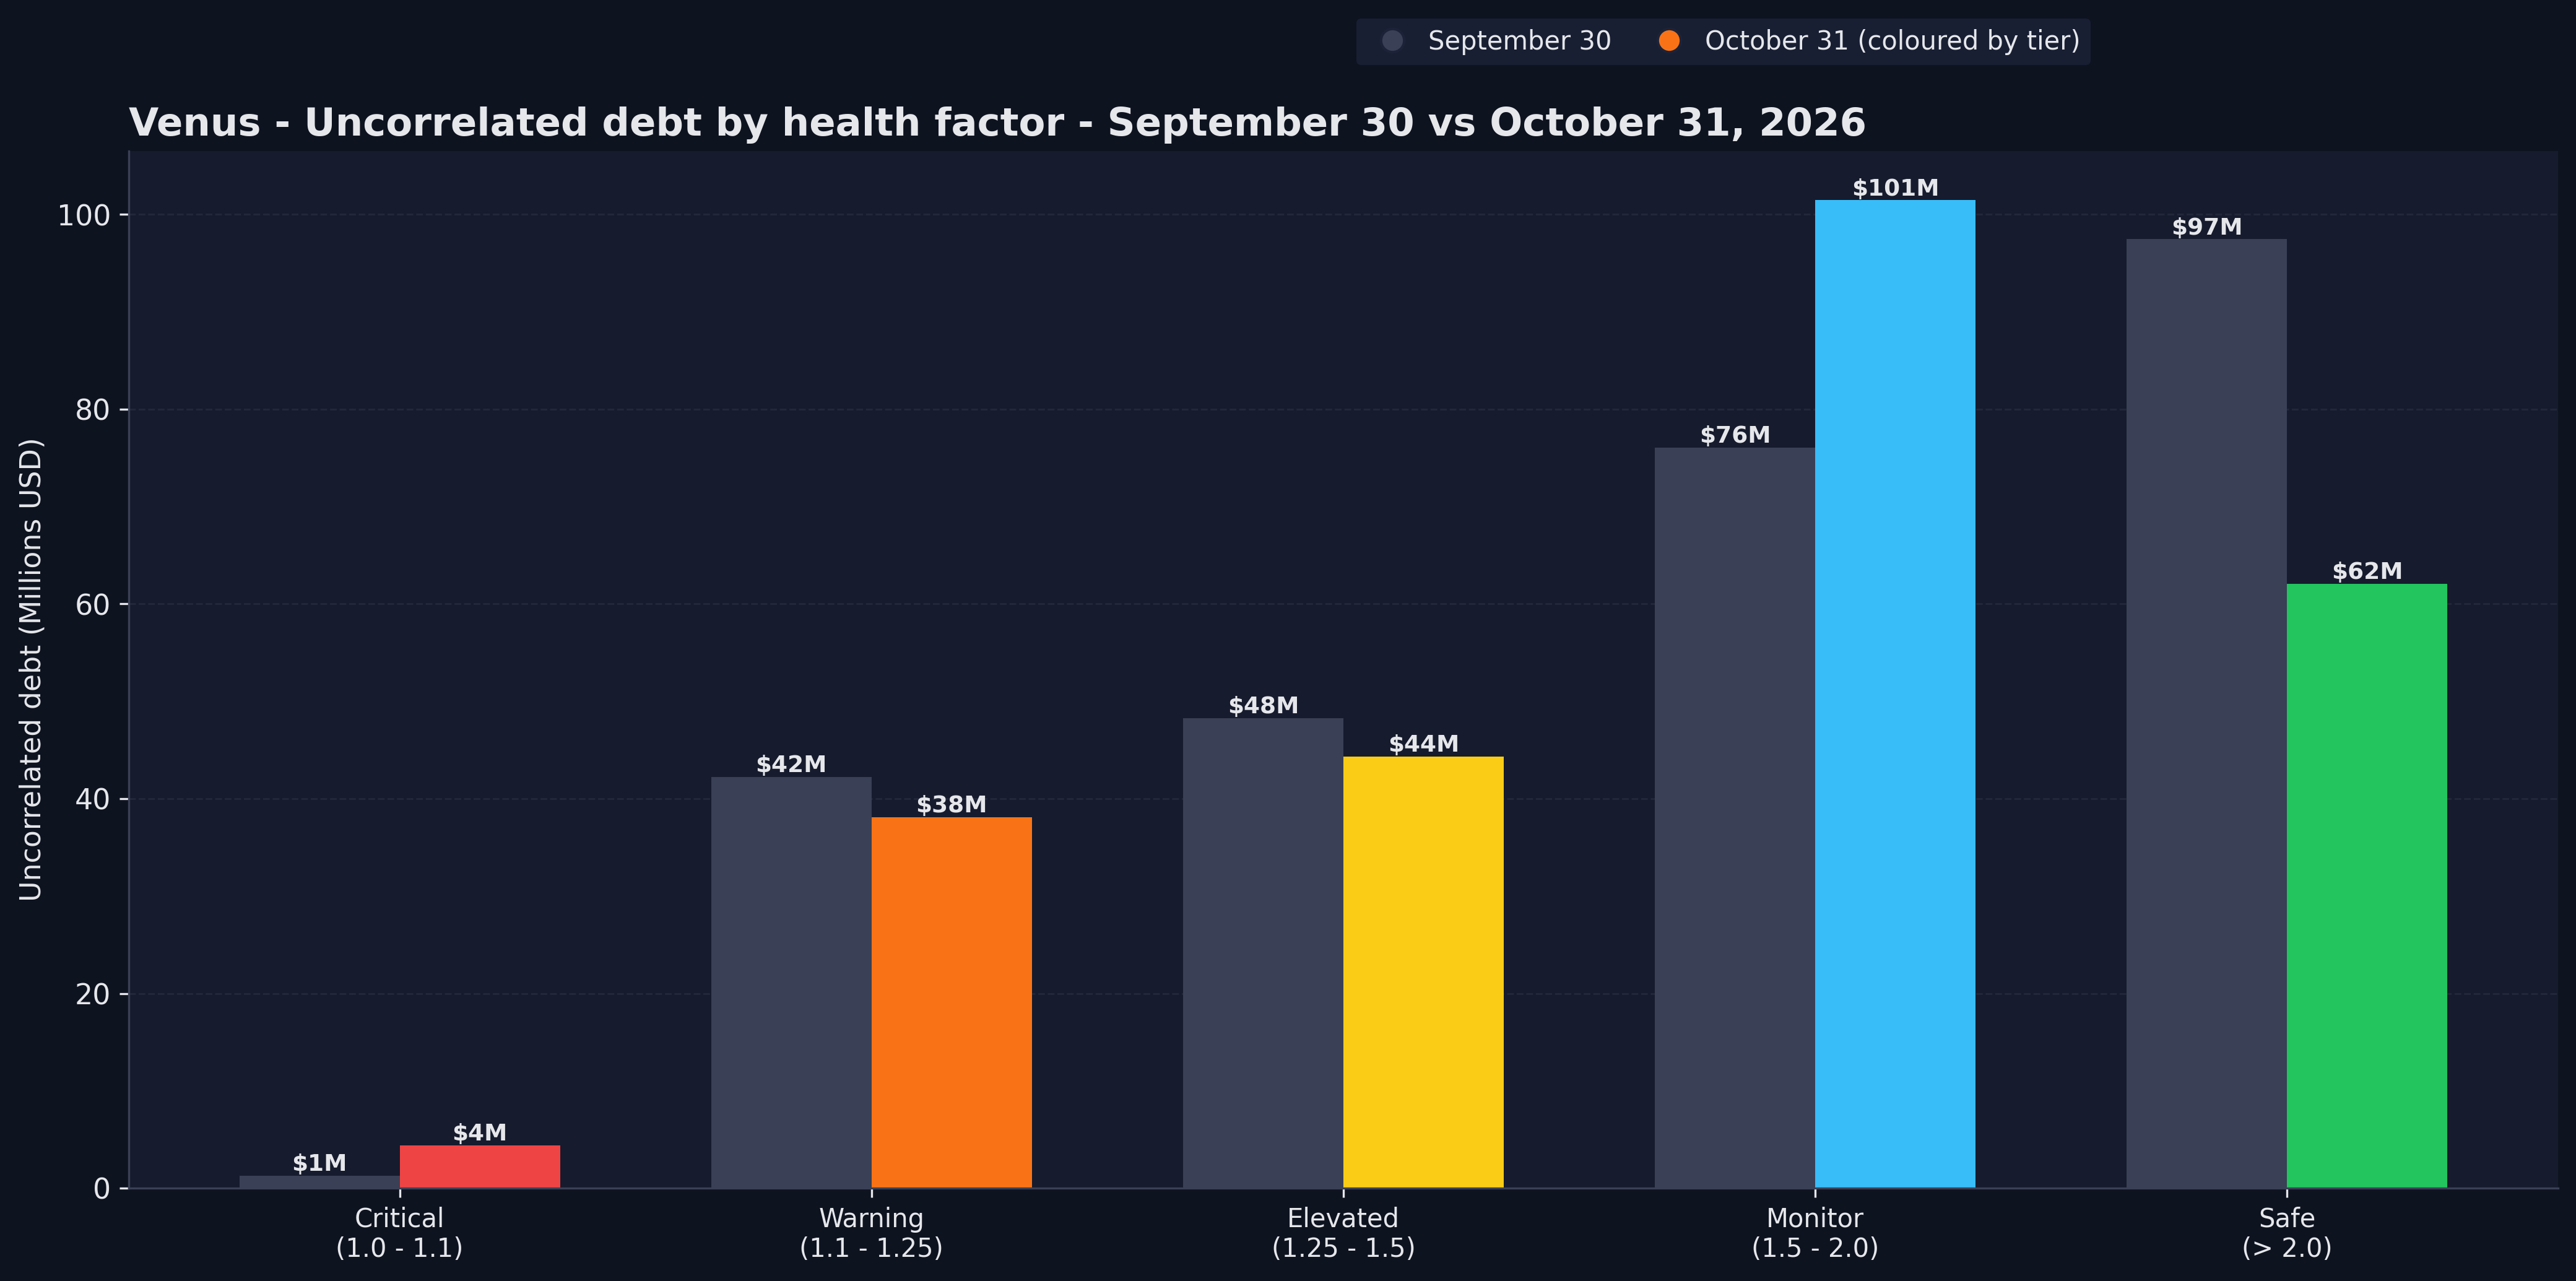
Health factor distribution (October 31, 2026):
| Tier | HF Range | Debt | Correlated | Uncorrelated | Uncorrelated MoM | Accounts |
|---|---|---|---|---|---|---|
| Critical | 1.0 - 1.1 | $20.4M | $16.0M | $4.4M | +240% | 900 |
| Warning | 1.1 - 1.25 | $84.4M | $46.3M | $38.1M | -9.7% | 1,486 |
| Elevated | 1.25 - 1.5 | $64.3M | $19.9M | $44.4M | -8.1% | 2,941 |
| Monitor | 1.5 - 2.0 | $103.9M | $2.4M | $101.5M | +33.4% | 3,090 |
| Safe | > 2.0 | $63.2M | $1.1M | $62.1M | -36.3% | 14,717 |
| Total | $336.1M | $85.7M | $250.4M | -5.6% | 23,134 |
Through the month, correlated debt fell 39%, from $141M to $86M. $23M of this drawdown stemmed from a single account which swapped BTCB debt to USDT.
Stablecoin debt by top collaterals ($185.8M of the $197.2M stablecoin debt):
| Collateral | Stablecoin Debt | Sep Debt | MoM | Within 10% of Liquidation |
|---|---|---|---|---|
| BTCB | $90.8M | $84.1M | +8.0% | $3.8M |
| SolvBTC | $39.5M | $37.7M | +5.0% | ~$0 |
| BNB | $26.8M | $27.6M | -2.7% | $0.4M |
| wBETH | $10.4M | $11.5M | -9.4% | ~$0 |
| ETH | $7.8M | $8.0M | -1.8% | $0.1M |
| USDT | $7.7M | $7.5M | +3.4% | $3.3M |
| asBNB | $2.7M | $2.7M | +2.6% | ~$0 |
The $3.3M borrowed against USDT collateral and within 10% of liquidation is unchanged; with stablecoins on both sides, its main risk is a depeg.
Forward stress test:
The stress test applies a further price shock to every account. It excludes one legacy market with unreliable interest data. In the uniform case, all volatile collateral and debt move together, with stablecoins held at $1.
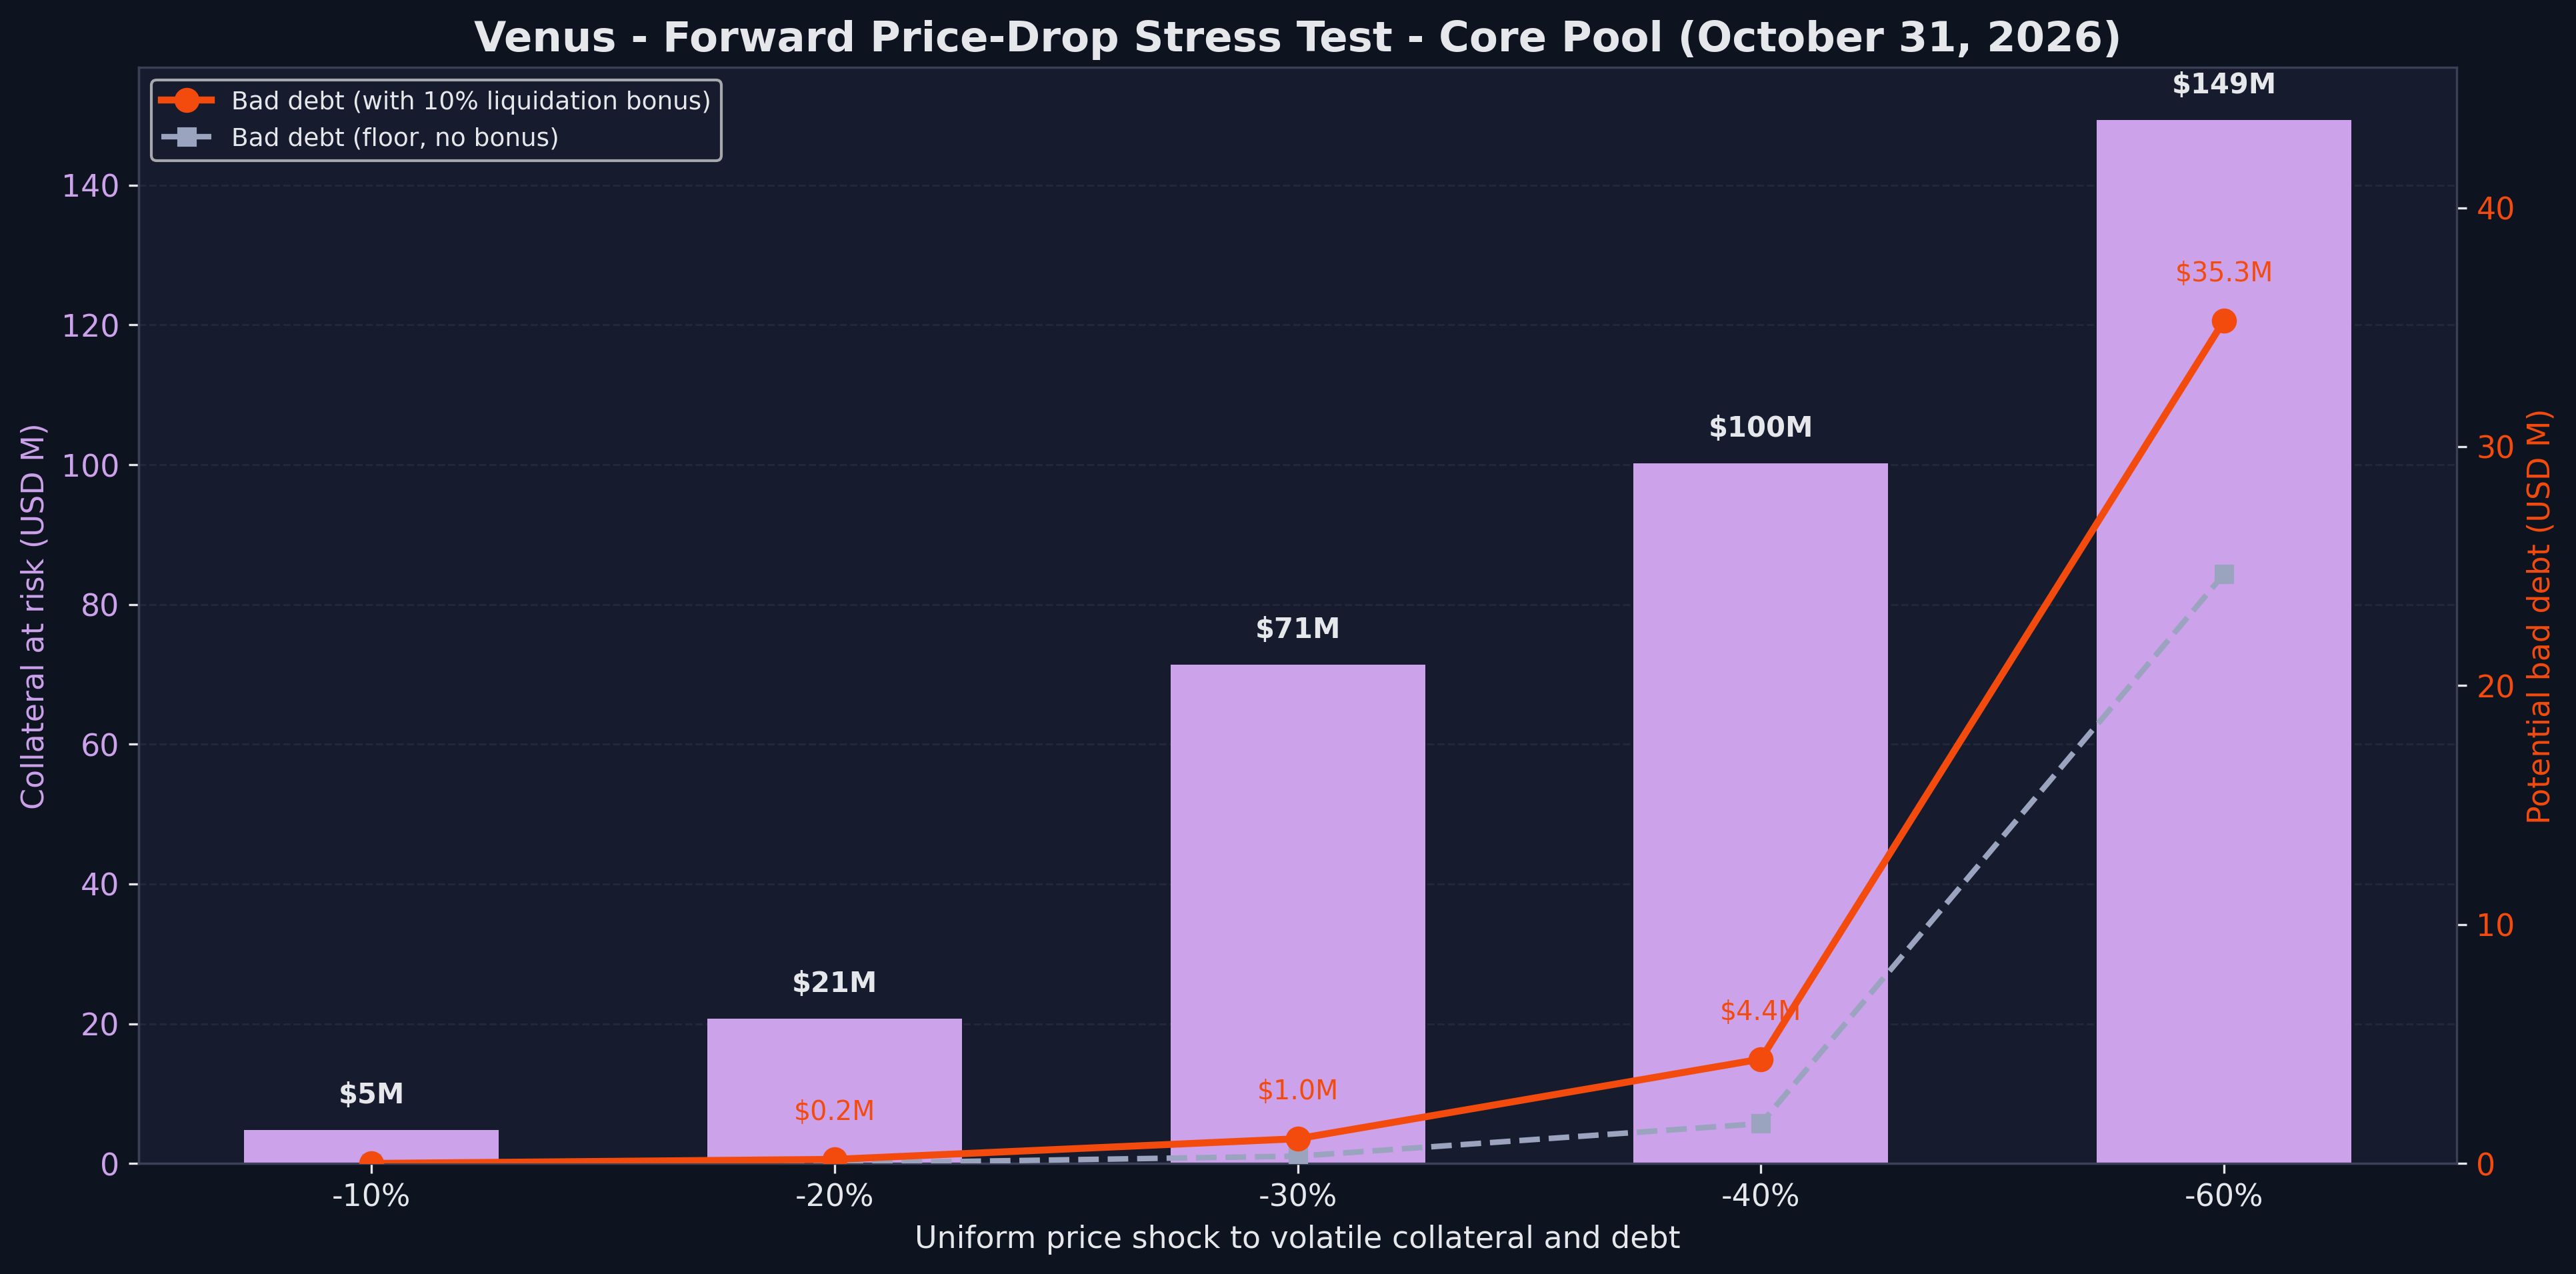
| Further price shock | Accounts eligible for liquidation | Collateral at risk | Change vs Sep 30 | Bad debt (+10% bonus) | Sep 30 bad debt |
|---|---|---|---|---|---|
| No shock (baseline) | 4,704 | $0.04M | -$0.01M | ~$0 | ~$0 |
| -10% | 4,762 | $4.8M | +$4.7M | ~$0 | ~$0 |
| -20% | 4,971 | $20.7M | +$10.2M | $0.2M | ~$0 |
| -30% | 5,795 | $71.4M | +$20.7M | $1.0M | $0.4M |
| -40% | 6,638 | $100.2M | +$9.6M | $4.4M | $2.1M |
| -60% | 8,116 | $149.4M | -$13.4M | $35.3M | $23.1M |
Collateral at risk is higher than on Sep 30 at every shock from -10% to -40%, even though debt fell, as October's price decline moved more uncorrelated accounts closer to liquidation. The largest single account at -30% is the BTCB-collateralized borrower at a health factor of 1.14 ($16.3M of collateral).
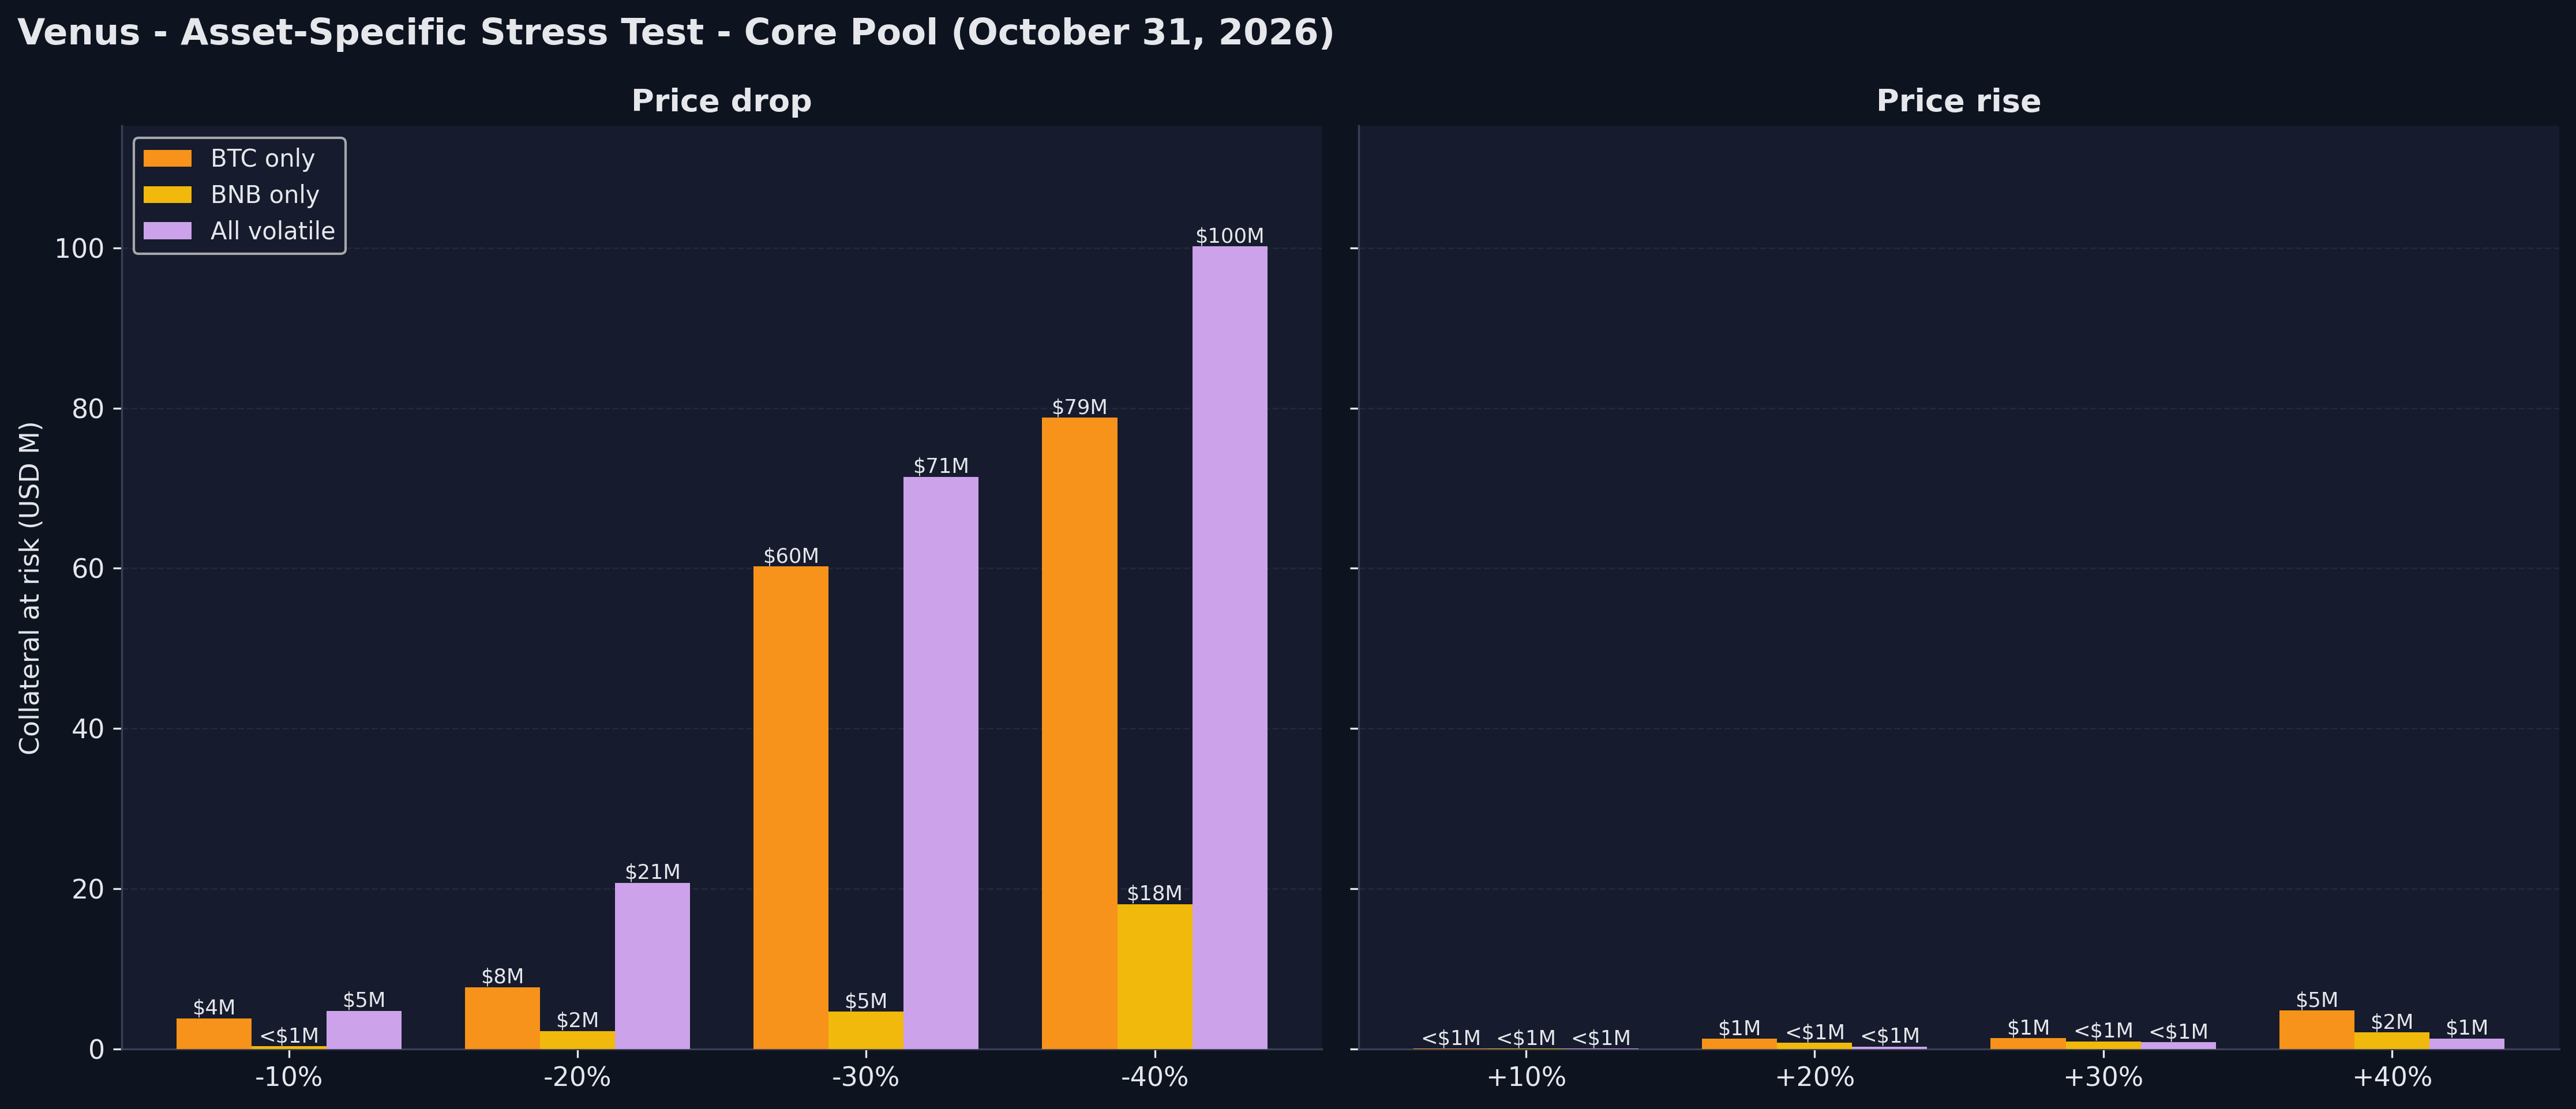
| Scenario | -10% | -20% | -30% | -40% | -30% (Sep 30) |
|---|---|---|---|---|---|
| BTC only | $3.8M | $7.7M | $60.2M | $78.8M | $87.7M |
| BNB only | $0.3M | $2.2M | $4.6M | $18.1M | $5.6M |
| All volatile | $4.8M | $20.7M | $71.4M | $100.2M | $50.7M |
| Scenario | +10% | +20% | +30% | +40% | +20% (Sep 30) |
|---|---|---|---|---|---|
| BNB only | ~$0 | $0.8M | $0.9M | $2.1M | $30.2M |
| BTC only | ~$0 | $1.3M | $1.3M | $4.8M | $0.6M |
| All volatile | ~$0 | $0.3M | $0.8M | $1.3M | $3.9M |
The BNB-rise exposure flagged in September has largely gone: a 20% BNB rise now puts $0.8M at risk, against $30.2M in September, after the account that borrowed BNB against BTCB and stablecoins repaid its $20.3M of BNB debt. BTC remains the main sensitivity. A 30% BTC-only drop puts $60.2M at risk, with $16.3M from a single account with a health factor of 1.14, reaching liquidation at a BTC drop of 21.3%.
BTC rarely falls alone over a week, rather declines in BTC are typically accompanied by broader falls in the market across all of the 'macro' crypto assets. Since 2020 there has only been one occasion where BTC fell 20% or more in a week and BNB fell less than 10% (Jan 2021).
Borrower concentration:
| Borrower | Total Debt | MoM | Primary Debt Asset |
|---|---|---|---|
| 0xc482...82a8 | $17.2M | -48.1% | BTCB |
| 0x9614...8bf1 | $16.4M | -28.4% | BTCB, USDT |
| 0x3e87...d90c | $15.3M | -8.7% | BNB |
| 0x77ec...de6d | $9.2M | +11.7% | USDT, U |
The four largest borrowers together hold $58M, 17.2% of protocol debt, compared to 22.9% last month. Most of the decline in concentration stems from repayment by these borrowers - the two largest cut their BTCB debt by 44% and 50% respectively (from 607 to 327 BTCB, or $50.8M to $25.3M), while BTC fell 7.4%.
5. Collateral Structure
Top collateral/borrow pairs:
| Collateral | Borrowed | Debt | Sep Debt | MoM | Users |
|---|---|---|---|---|---|
| BTCB | USDT | $71.2M | $64.2M | +10.9% | 2,201 |
| xSolvBTC | BTCB | $39.1M | $37.7M | +3.6% | 12 |
| SolvBTC | USDT | $35.0M | $33.4M | +4.9% | 40 |
| SolvBTC | BTCB | $20.8M | $39.4M | -47.1% | 19 |
| BTCB | USDC | $14.7M | $14.9M | -1.3% | 1,083 |
| BNB | USDT | $14.5M | $14.5M | 0.0% | 2,401 |
| BTCB | BTCB | $14.5M | $30.2M | -52.0% | 596 |
BTCB borrowed against SolvBTC halved: the largest borrower closed its SolvBTC leg and now borrows $17.2M of BTCB against xSolvBTC only. Stablecoin borrowing against BTC collateral grew, with BTCB/USDT up 10.9% to $71.2M.
6. Utilization
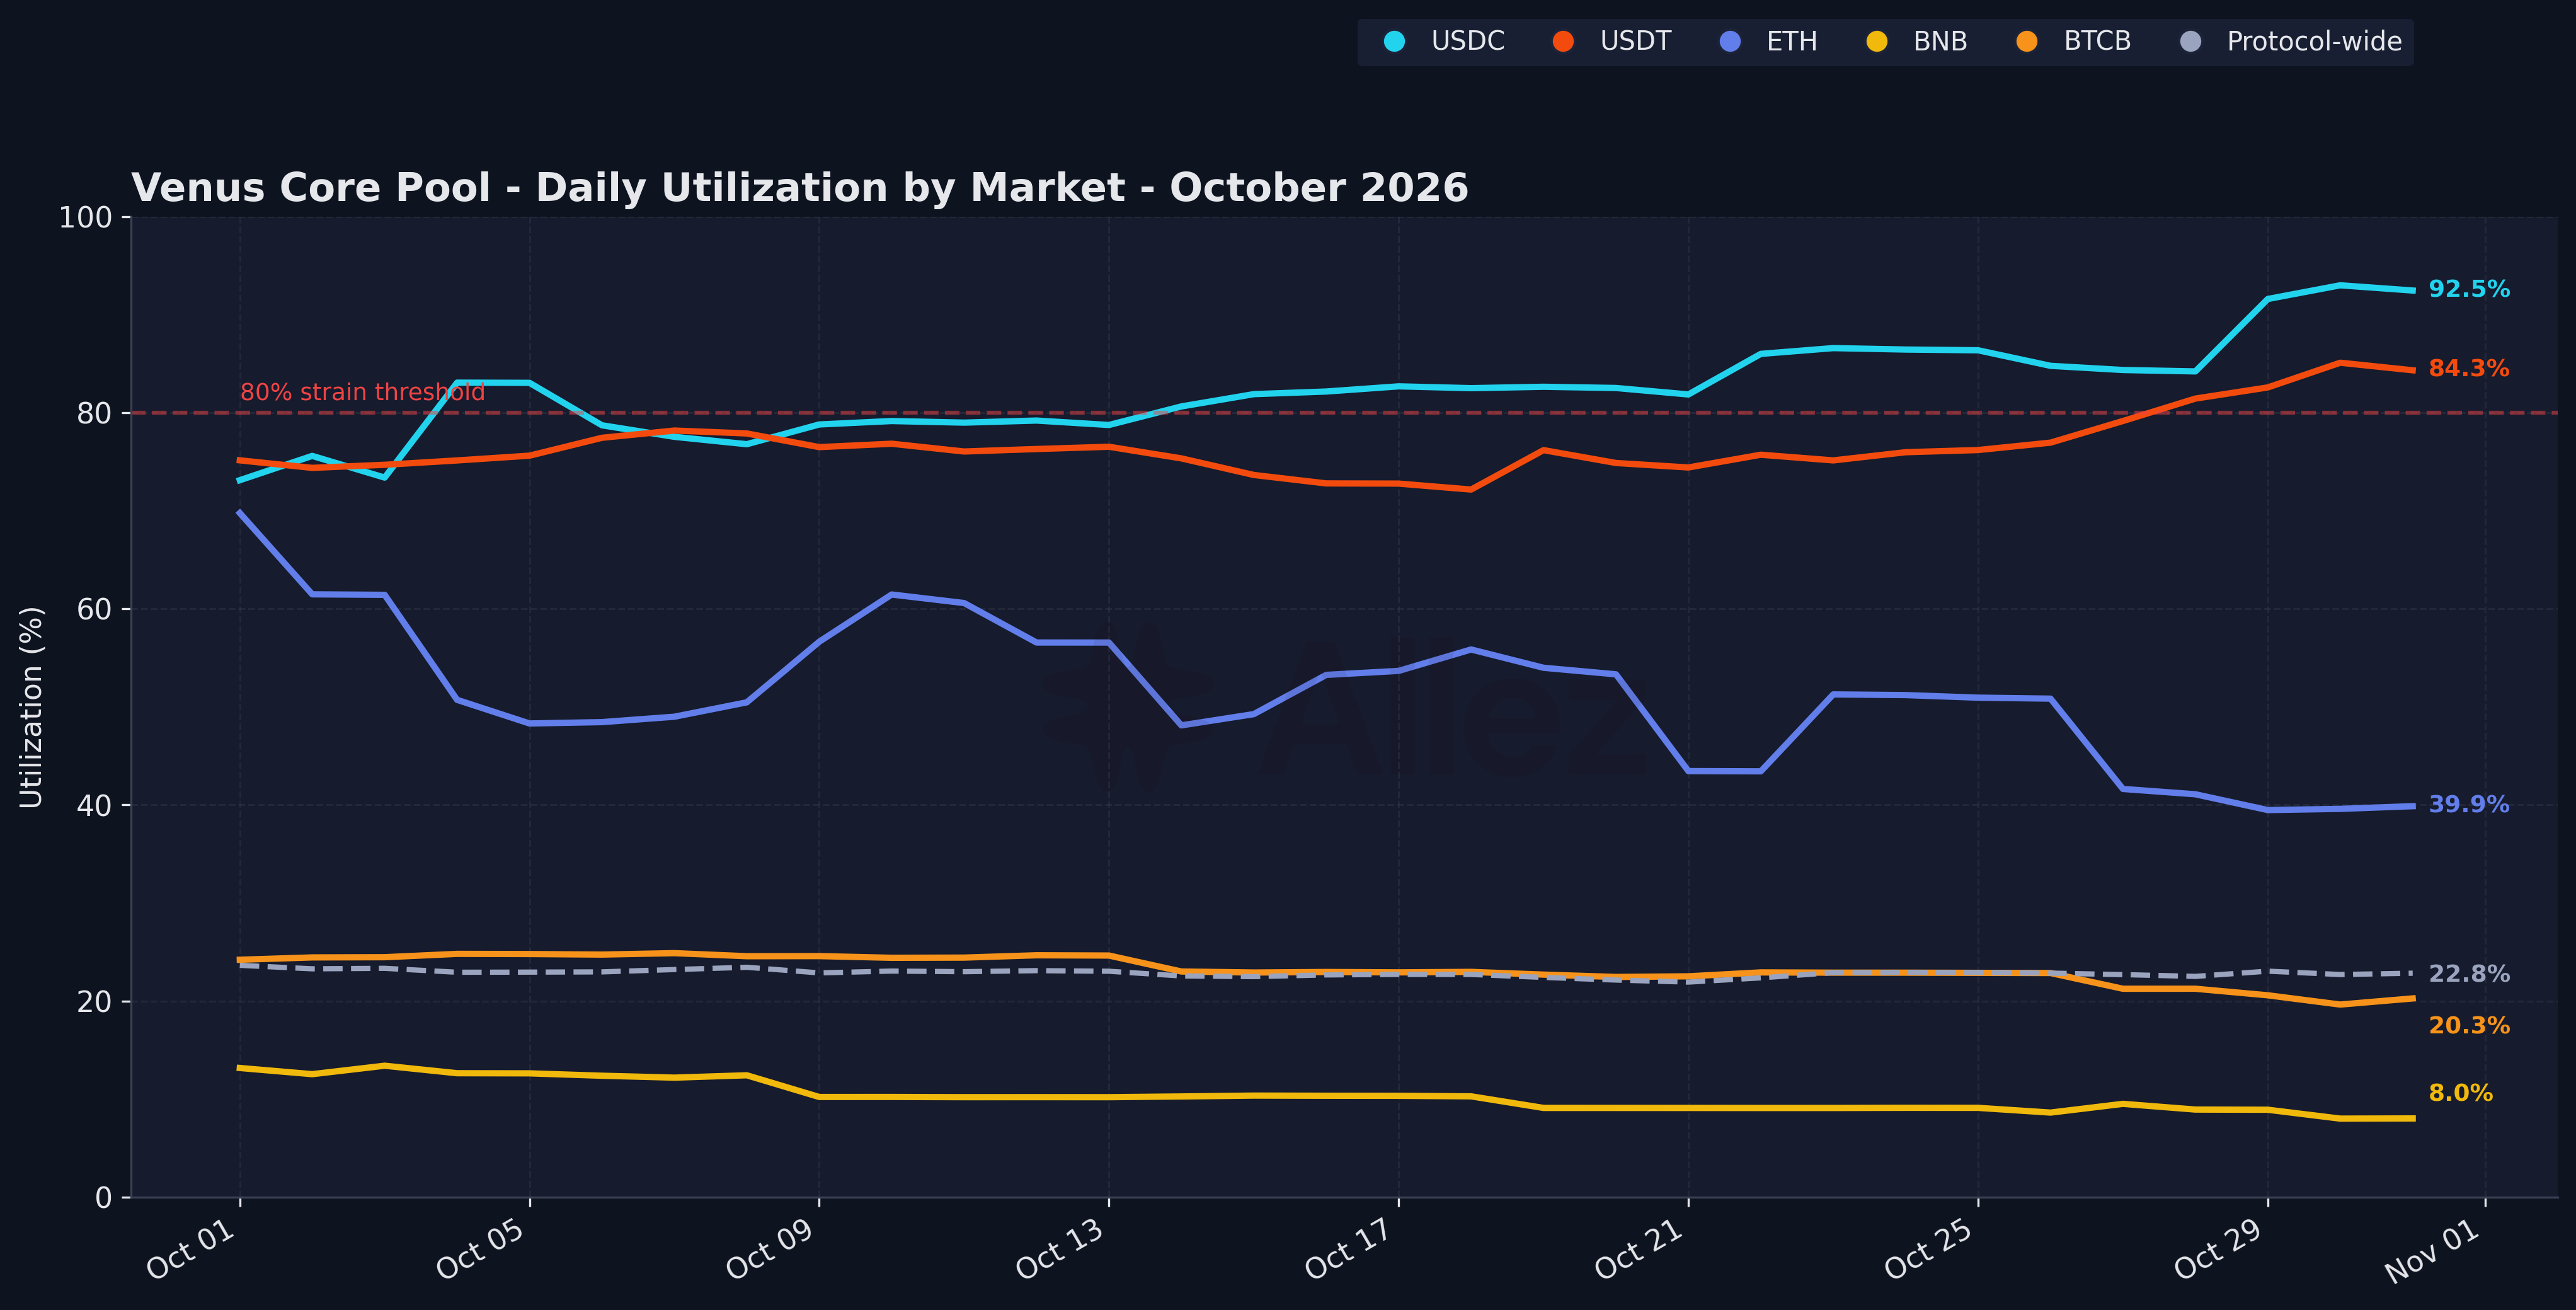
Protocol utilization was unchanged over the course of the month at 23%, while stablecoin markets tightened. USDC utilization rose to 93% as supply fell 22% at the end of the month, driving borrow rates to 9% from 5% at the start. USDT had a similar story, rising to 84% utilization and 5.6% borrow rates.
7. Summary & Forward Look
Leverage fell on Venus. Borrowers repaid $48M and the largest BNB position closed. Despite the difficult month, where Binance was hacked and BTC, BNB and other macro crypto assets fell, liquidation volume remained modest - staying below $200K.
On September's watch items, BTC-only collateral at risk (30% drop) fell 31%, protocol liquidation risk to BNB price appreciation fell to nearly zero as BNB borrowers repaid. ETH utilization eased and USDC utilization rose.
To watch in November:
-
USDC and USDT utilization. USDC closed at 92.5% with $2.4M available to withdraw, and USDT at 84.3%. While utilization remains this high, borrow rates will be elevated (USDC 9.4%, USDT 5.6% at month end).
-
Liquidity Hub growth. Hub deposits grew 3.2x to $17.6M in October. The Hub can allocate to the Core Pool, fixed-rate markets and Spoke markets.
-
RWA markets. The first Hub-Funded Spoke markets, tokenized QQQ and SPY, launched on October 23, and Venus listed the hBNB Fixed-Term Institutional Loan Vault.
Readers can follow current Venus market and risk metrics on the Allez Venus Risk Dashboard.
If there's something specific you'd like covered next month, or any feedback on what's here, let us know in the comments below.
Appendix: Asset Category Classification
| Category | Assets | Supply | Debt |
|---|---|---|---|
| BTC | BTCB, SolvBTC, xSolvBTC | $622.8M | $81.8M |
| BNB | BNB, WBNB, asBNB, slisBNB, PT-clisBNB | $490.3M | $39.1M |
| Stablecoins | USDT, USDC, U, USDe, sUSDe, lisUSD, FDUSD, DAI, USD1, BUSD, vhUSDC, vhUSDT | $245.0M | $197.2M |
| ETH | ETH, wBETH, BETH | $69.3M | $18.3M |
| Altcoins | Cake, XRP, DOGE, ADA, DOT, FIL, LINK, UNI, AAVE, LTC, BCH, TRX, MATIC, THE, TWT, XVS, SOL | $49.8M | $0.9M |
| RWA | NVDAB, TSLAB, SPCXB, SKHYB (bStocks), XAUM (gold) | $0.4M | $0.0M |
Correlated positions hold collateral and debt in the same category (SolvBTC/BTCB, asBNB/BNB); uncorrelated positions borrow across categories and carry directional price exposure. The classification is account-level and does not measure E-mode enrollment.
Scope: Venus Core Pool on BNB Chain only.
This report represents independent risk analysis by Allez Labs for the Venus community.