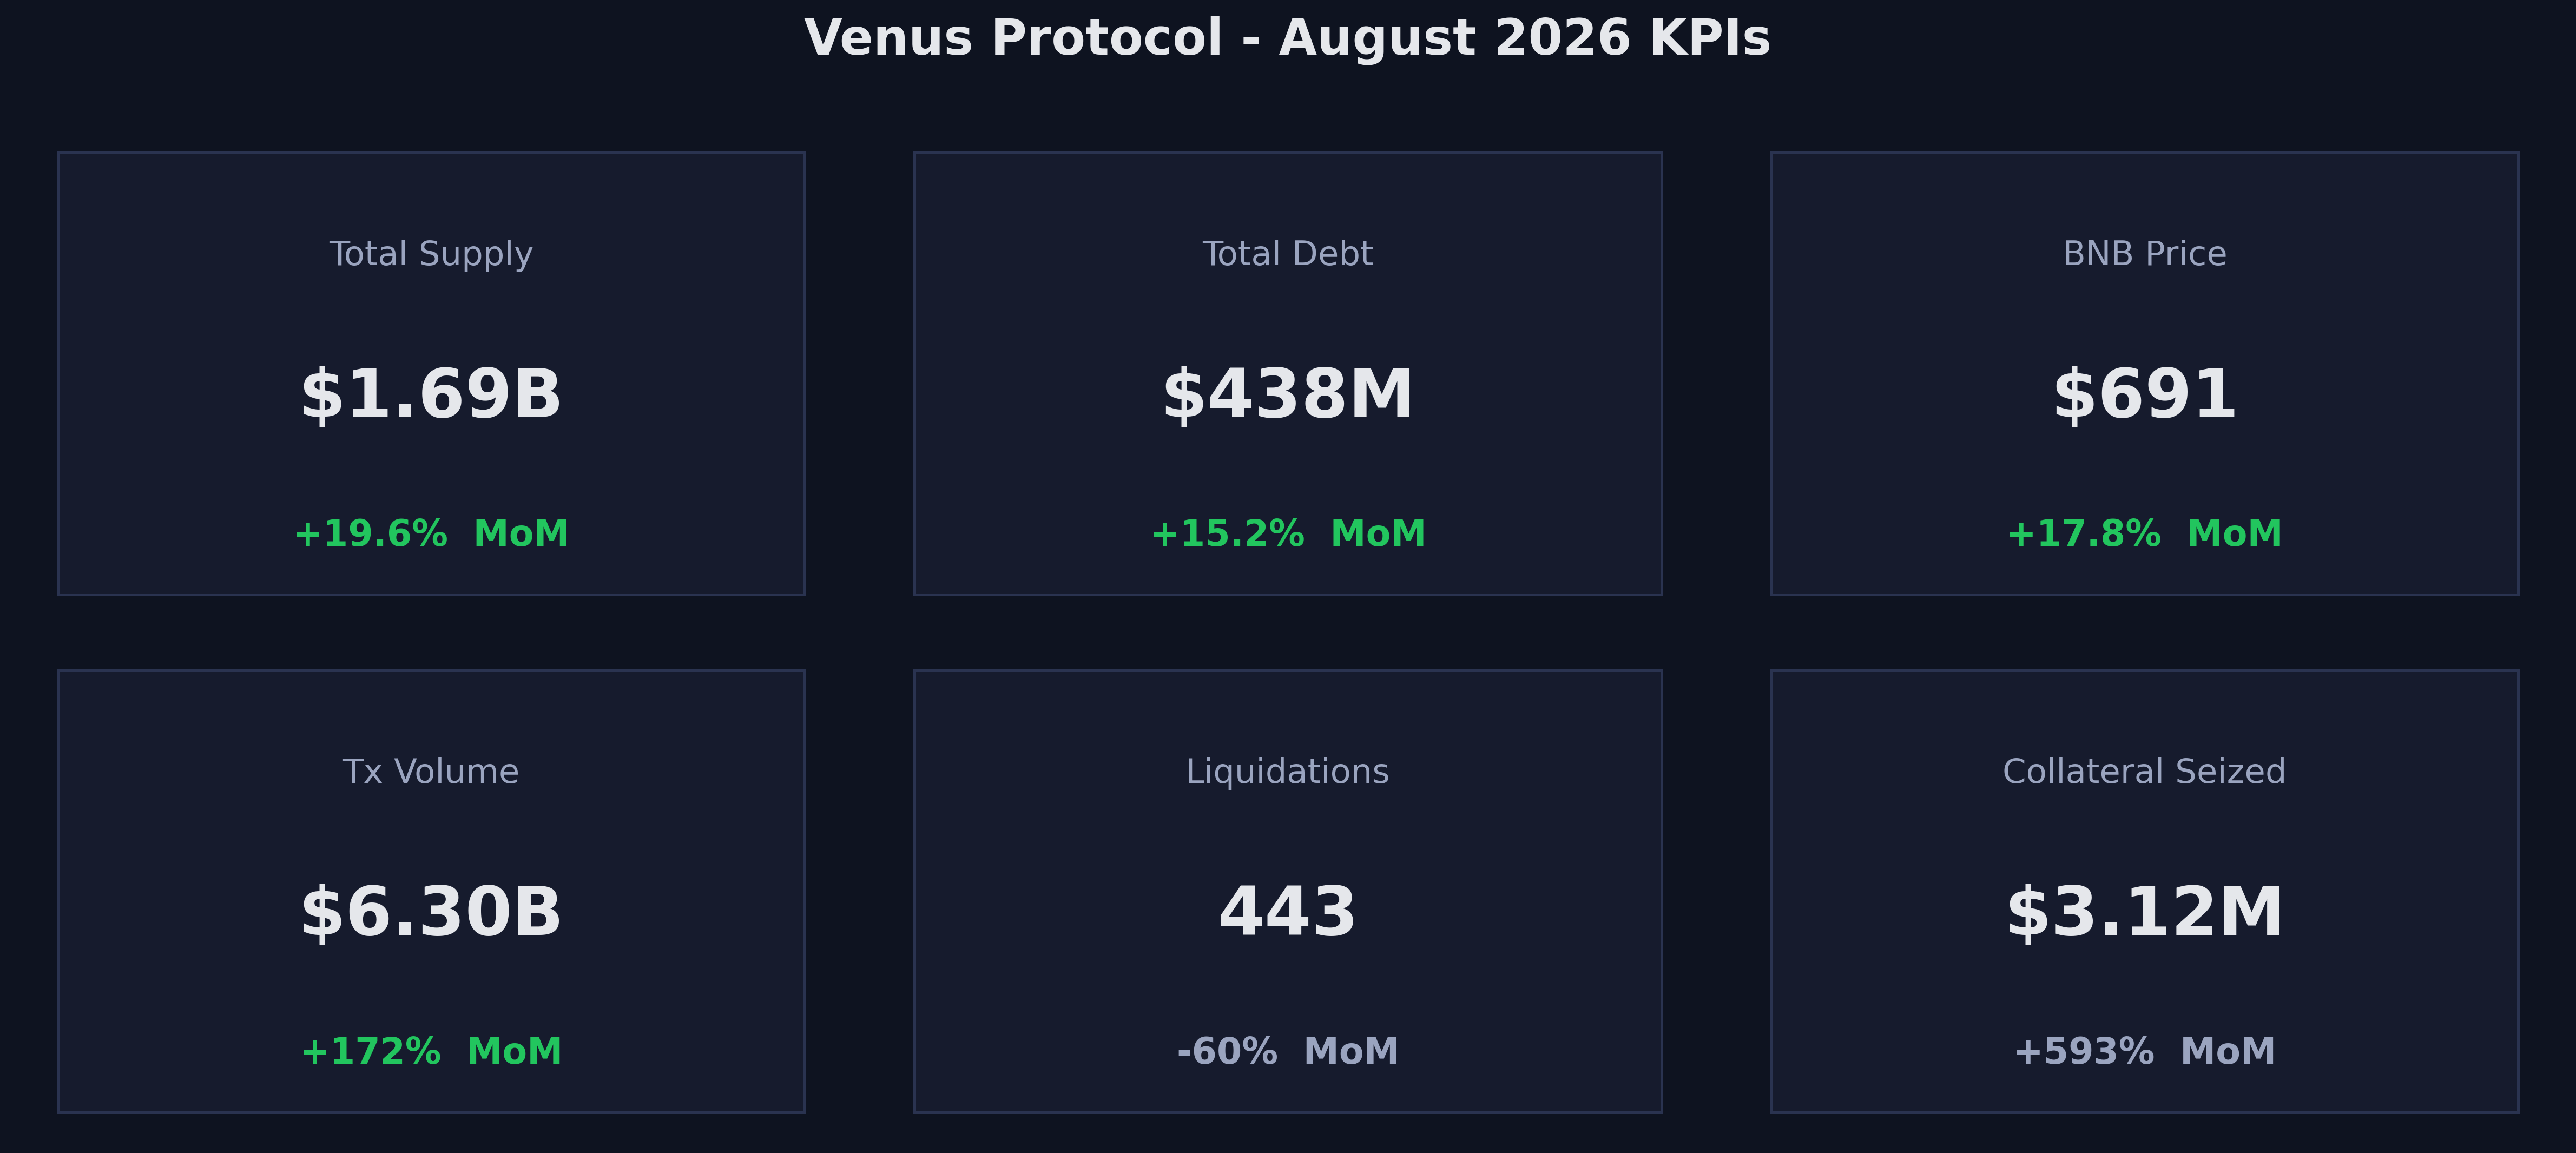
August saw a material increase in value supplied to Venus on BNB core, reaching $1.69B (+19.6% MoM) while debt climbed to $438M (+15.2%). Both growth sources were nearly entirely off the back of price gains.
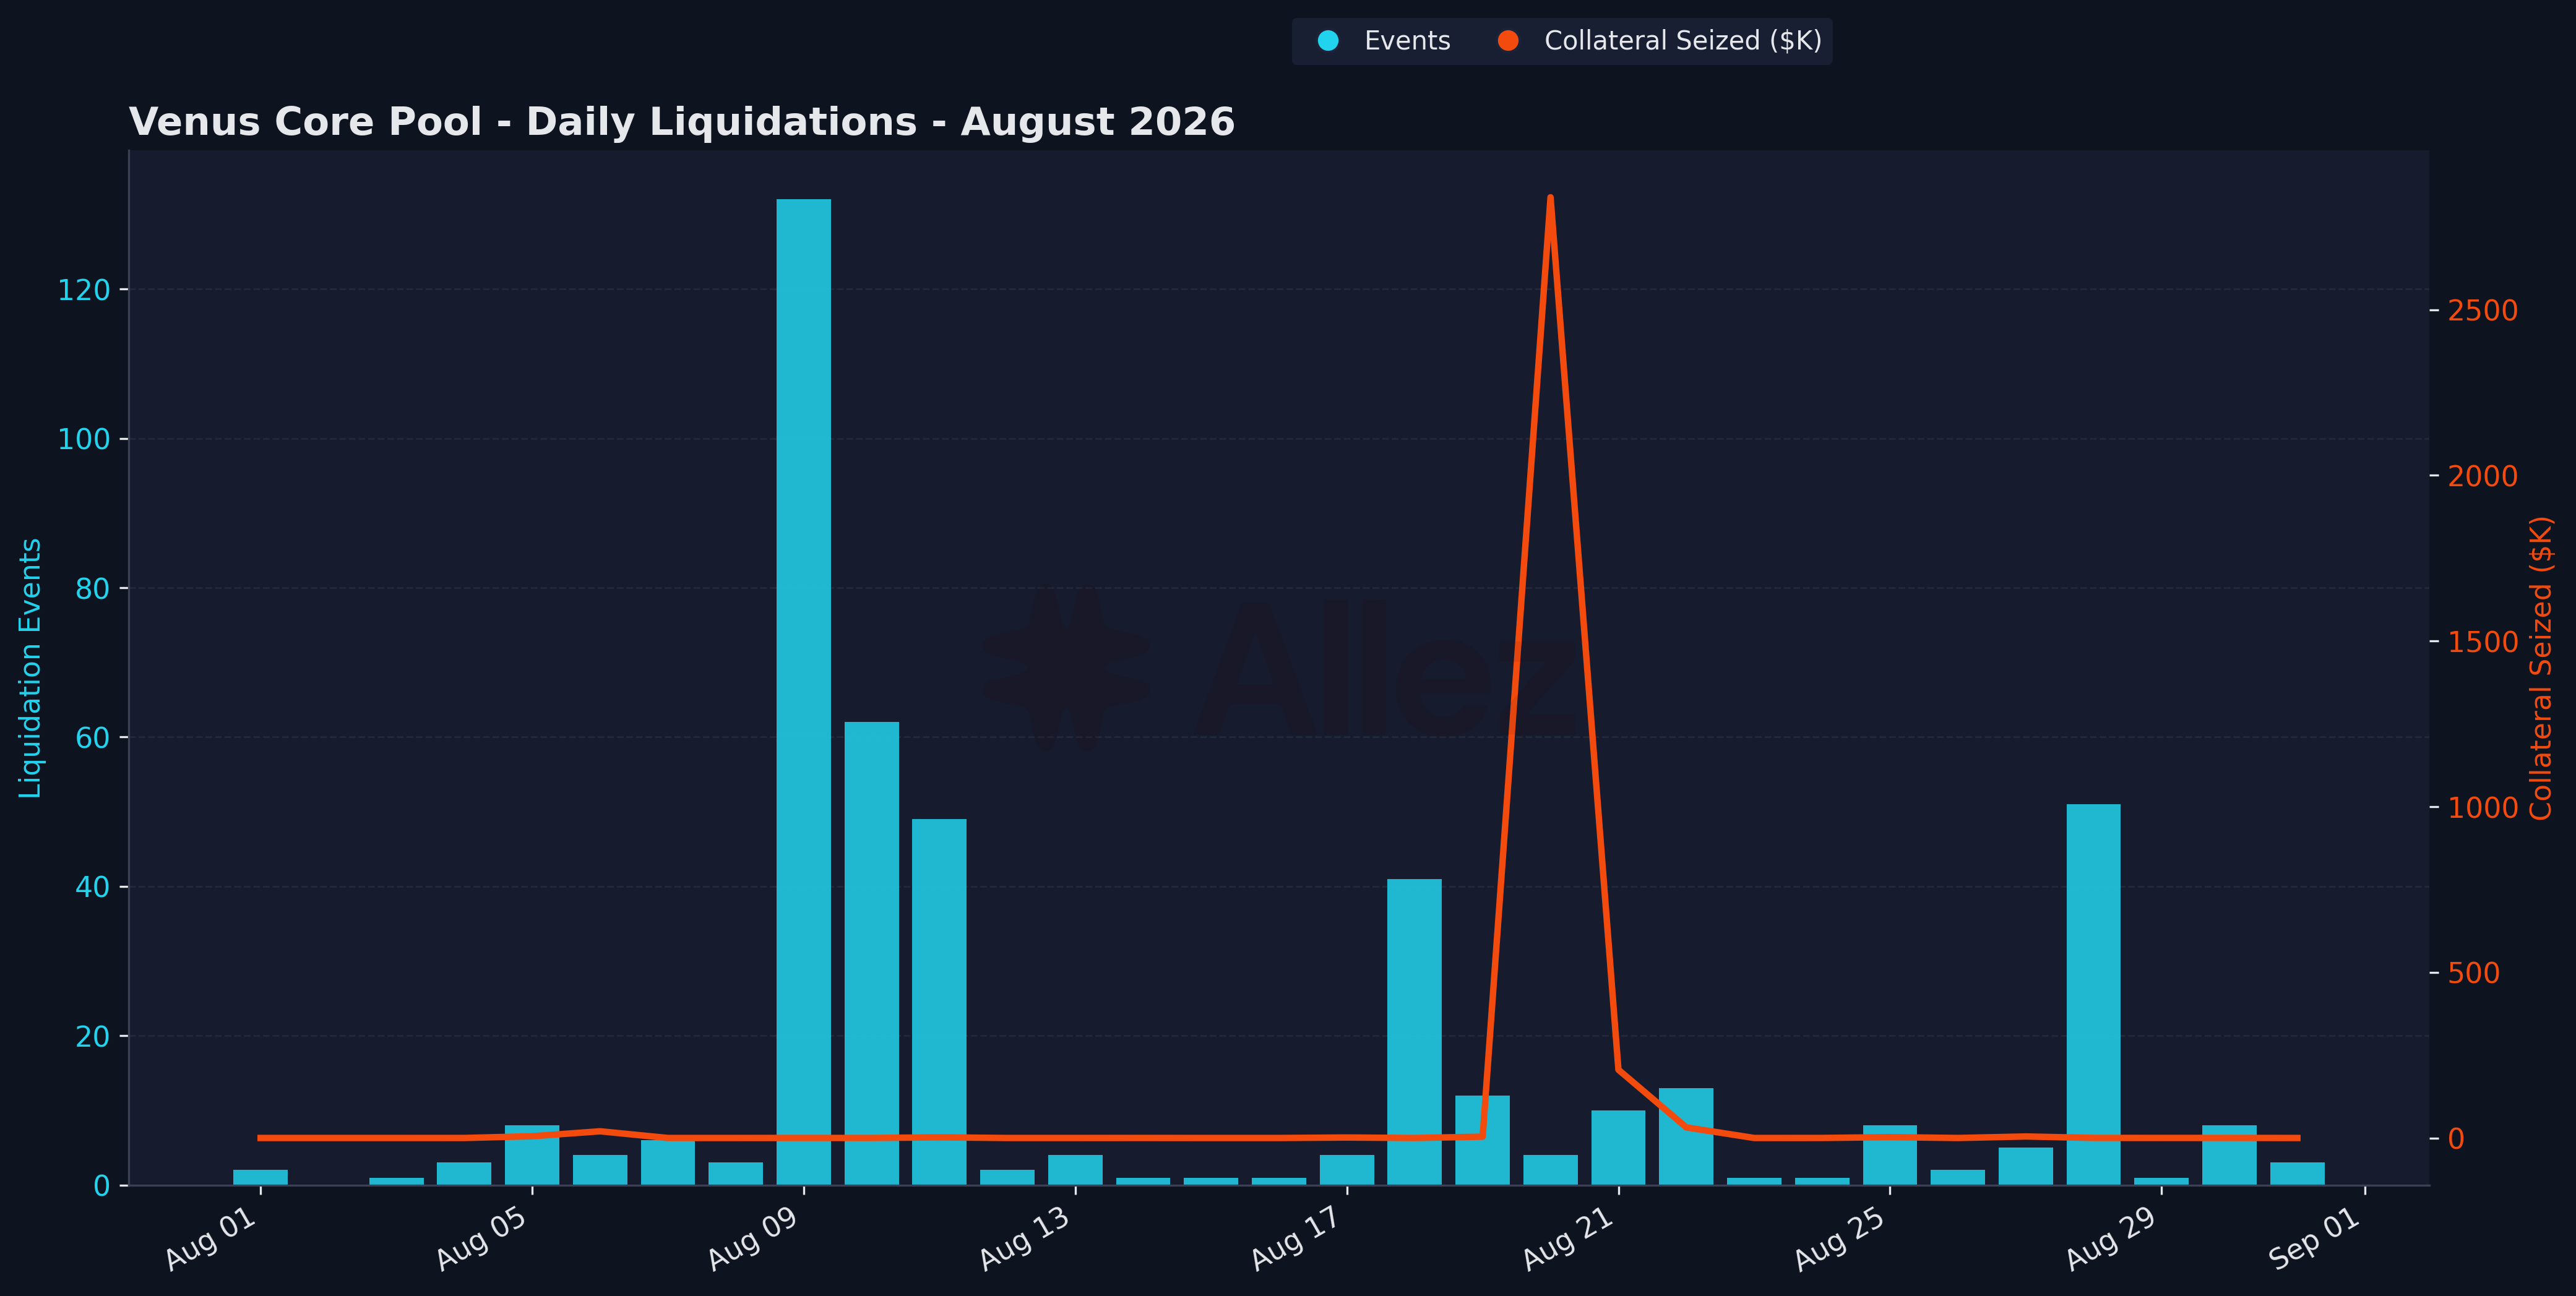
Protocol liquidation risk continued to improve: non-correlated debt within 10% of liquidation fell to $1.8M from $3.5M, and the stress test puts less collateral at risk than July at every shock from -10% to -40%. 91% of August's seized value came from one account, liquidated for $2.84M. It had borrowed ETH and BNB against USDT collateral, and the rally pushed its debt above its liquidation threshold. The other 439 events seized $279K between them.
Automated risk controls are a core component of Venus, and this month showcased the DeviationSentinel - firing four times to protect depositors from stale pricing.
1. Market Context & BNB Price
-
Total Supply: $1.69B (+19.6% MoM)
-
Total Debt: $438M (+15.2% MoM)
-
BNB Price: $691 (+17.8% MoM)
-
Liquidations: 443 events (-60% MoM)
-
Collateral Seized: $3.12M (+593% MoM; $2.84M from a single day)
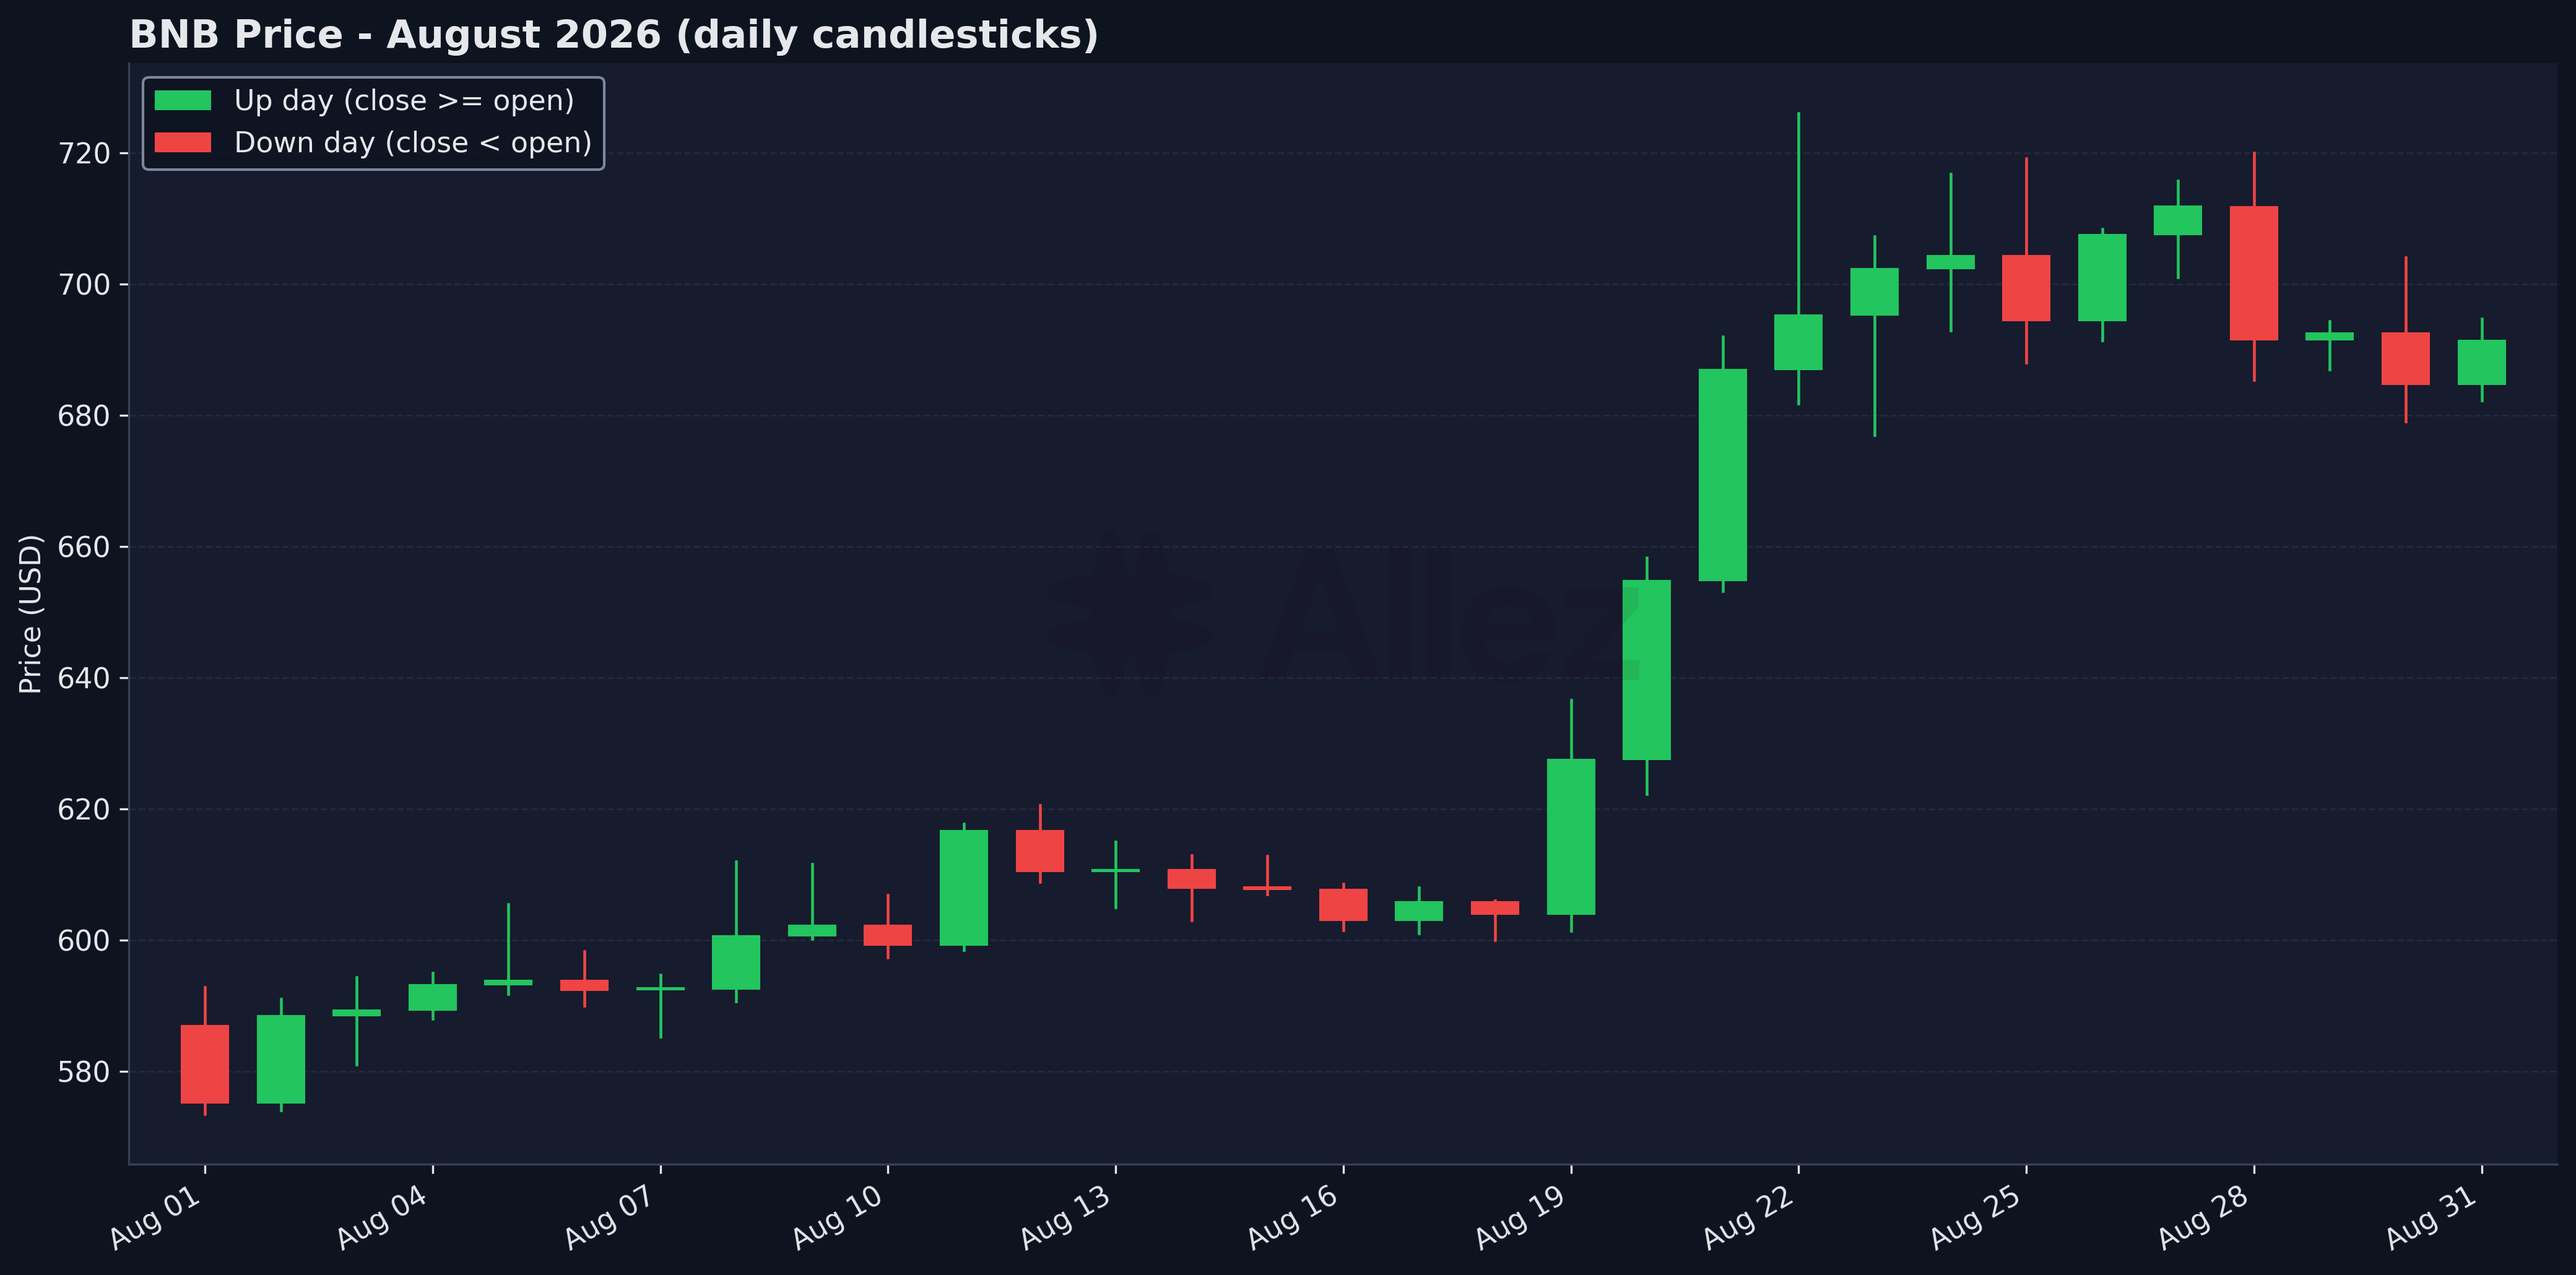
BNB traded between $590 and $617 until August 19, rallied to a $726 high on August 22 and closed at $691 (+17.8%). BTC and ETH rose 25.0% and 32.7%. Most of the supply growth is this repricing, not new deposits.
Transaction volume was $6.30B (+172% MoM); $2.25B came from one borrower cycling USDT and BNB borrow-and-repay on August 21, and the remaining $4.05B is still well above July.
Venus Ecosystem Updates:
-
VIP-653** (executed August 9).** Collateral factor updates across six assets in the BNB Core Pool in response to changing market conditions (See discussion).
-
VIP-654 (August 16). Oracle rework: SolvBTC and xSolvBTC moved to a Chainlink exchange-rate feed as the RedStone feed was sunset, and APRO was added as a pivot on the bStock markets, its first integration in the Core Pool.
-
Sentinel pauses, two deprecations proposed. Four DeviationSentinel pauses led to deprecation proposals for TRX and lisUSD, markets holding $1.18M of supply combined (Section 3).
-
Liquidity Hub** (August 31).** An ERC-4626 vault that routes a single deposit across Core, Flux and Fixed-Rate Vaults, so lenders no longer choose a venue themselves.
-
Two fixed-term vaults launched. Asseto CASH+ (August 20) and Ceffu Custody BTC (August 22) bring institutional collateral on-platform at fixed rates; both settle off-chain, so default goes to a pre-appointed liquidator rather than the open market.
2. Supply & Market Overview
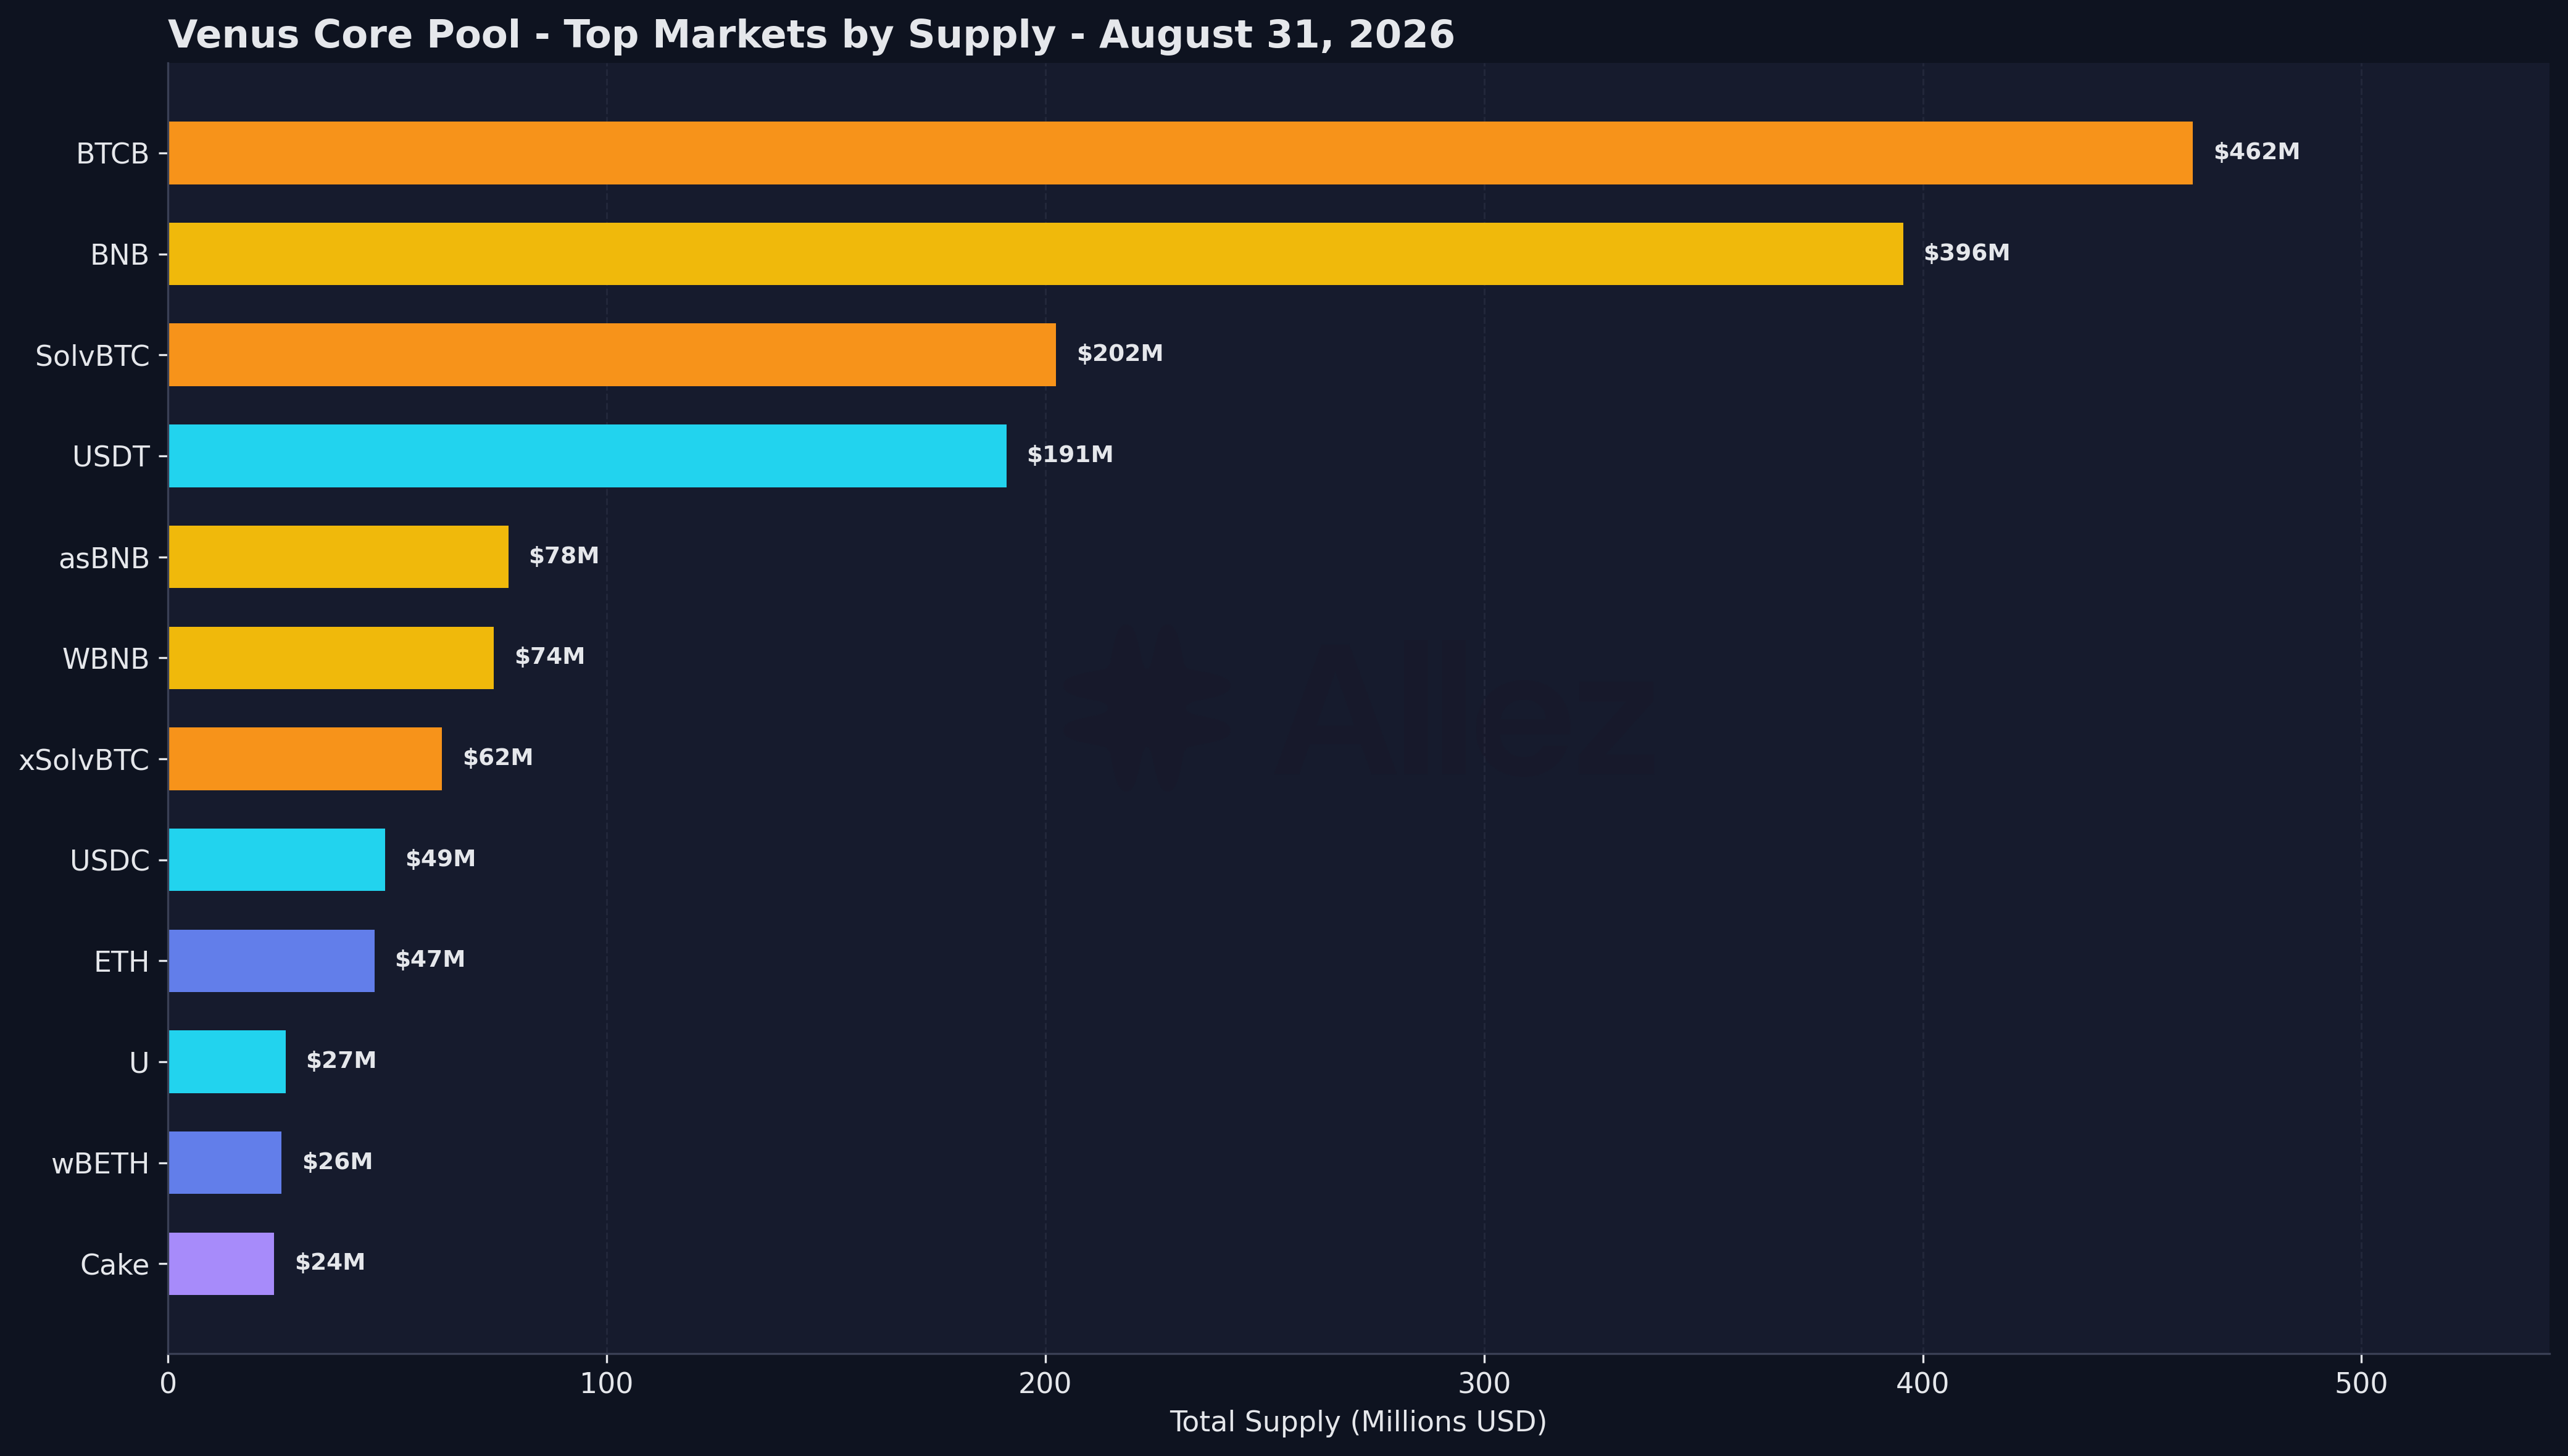
Top markets by supply (August 31, 2026):
| Market | Supply | MoM | Debt | Utilization |
|---|---|---|---|---|
| BTCB | $461.6M | +26.2% | $108.6M | 23.5% |
| BNB | $395.5M | +18.0% | $115.6M | 29.2% |
| SolvBTC | $202.5M | +25.5% | $0.1M | 0.1% |
| USDT | $191.1M | +6.9% | $132.9M | 69.6% |
| asBNB | $77.6M | +10.4% | $0.0M | 0.0% |
| WBNB | $74.2M | +20.2% | $12.0M | 16.1% |
| xSolvBTC | $62.4M | +34.0% | $0.0M | 0.0% |
| USDC | $49.4M | +15.4% | $28.9M | 58.4% |
| ETH | $47.1M | +29.5% | $17.8M | 37.9% |
| U | $26.8M | +1.7% | $14.1M | 52.4% |
BTCB and BNB together hold $857M, just over half the pool. Across the month, BTCB balances rose 1% against a 25% BTC gain, while BNB balances remained flat. Stablecoins reversed July's outflow with USDT up 6.9% and USDC up 15.4%, improving liquidity.
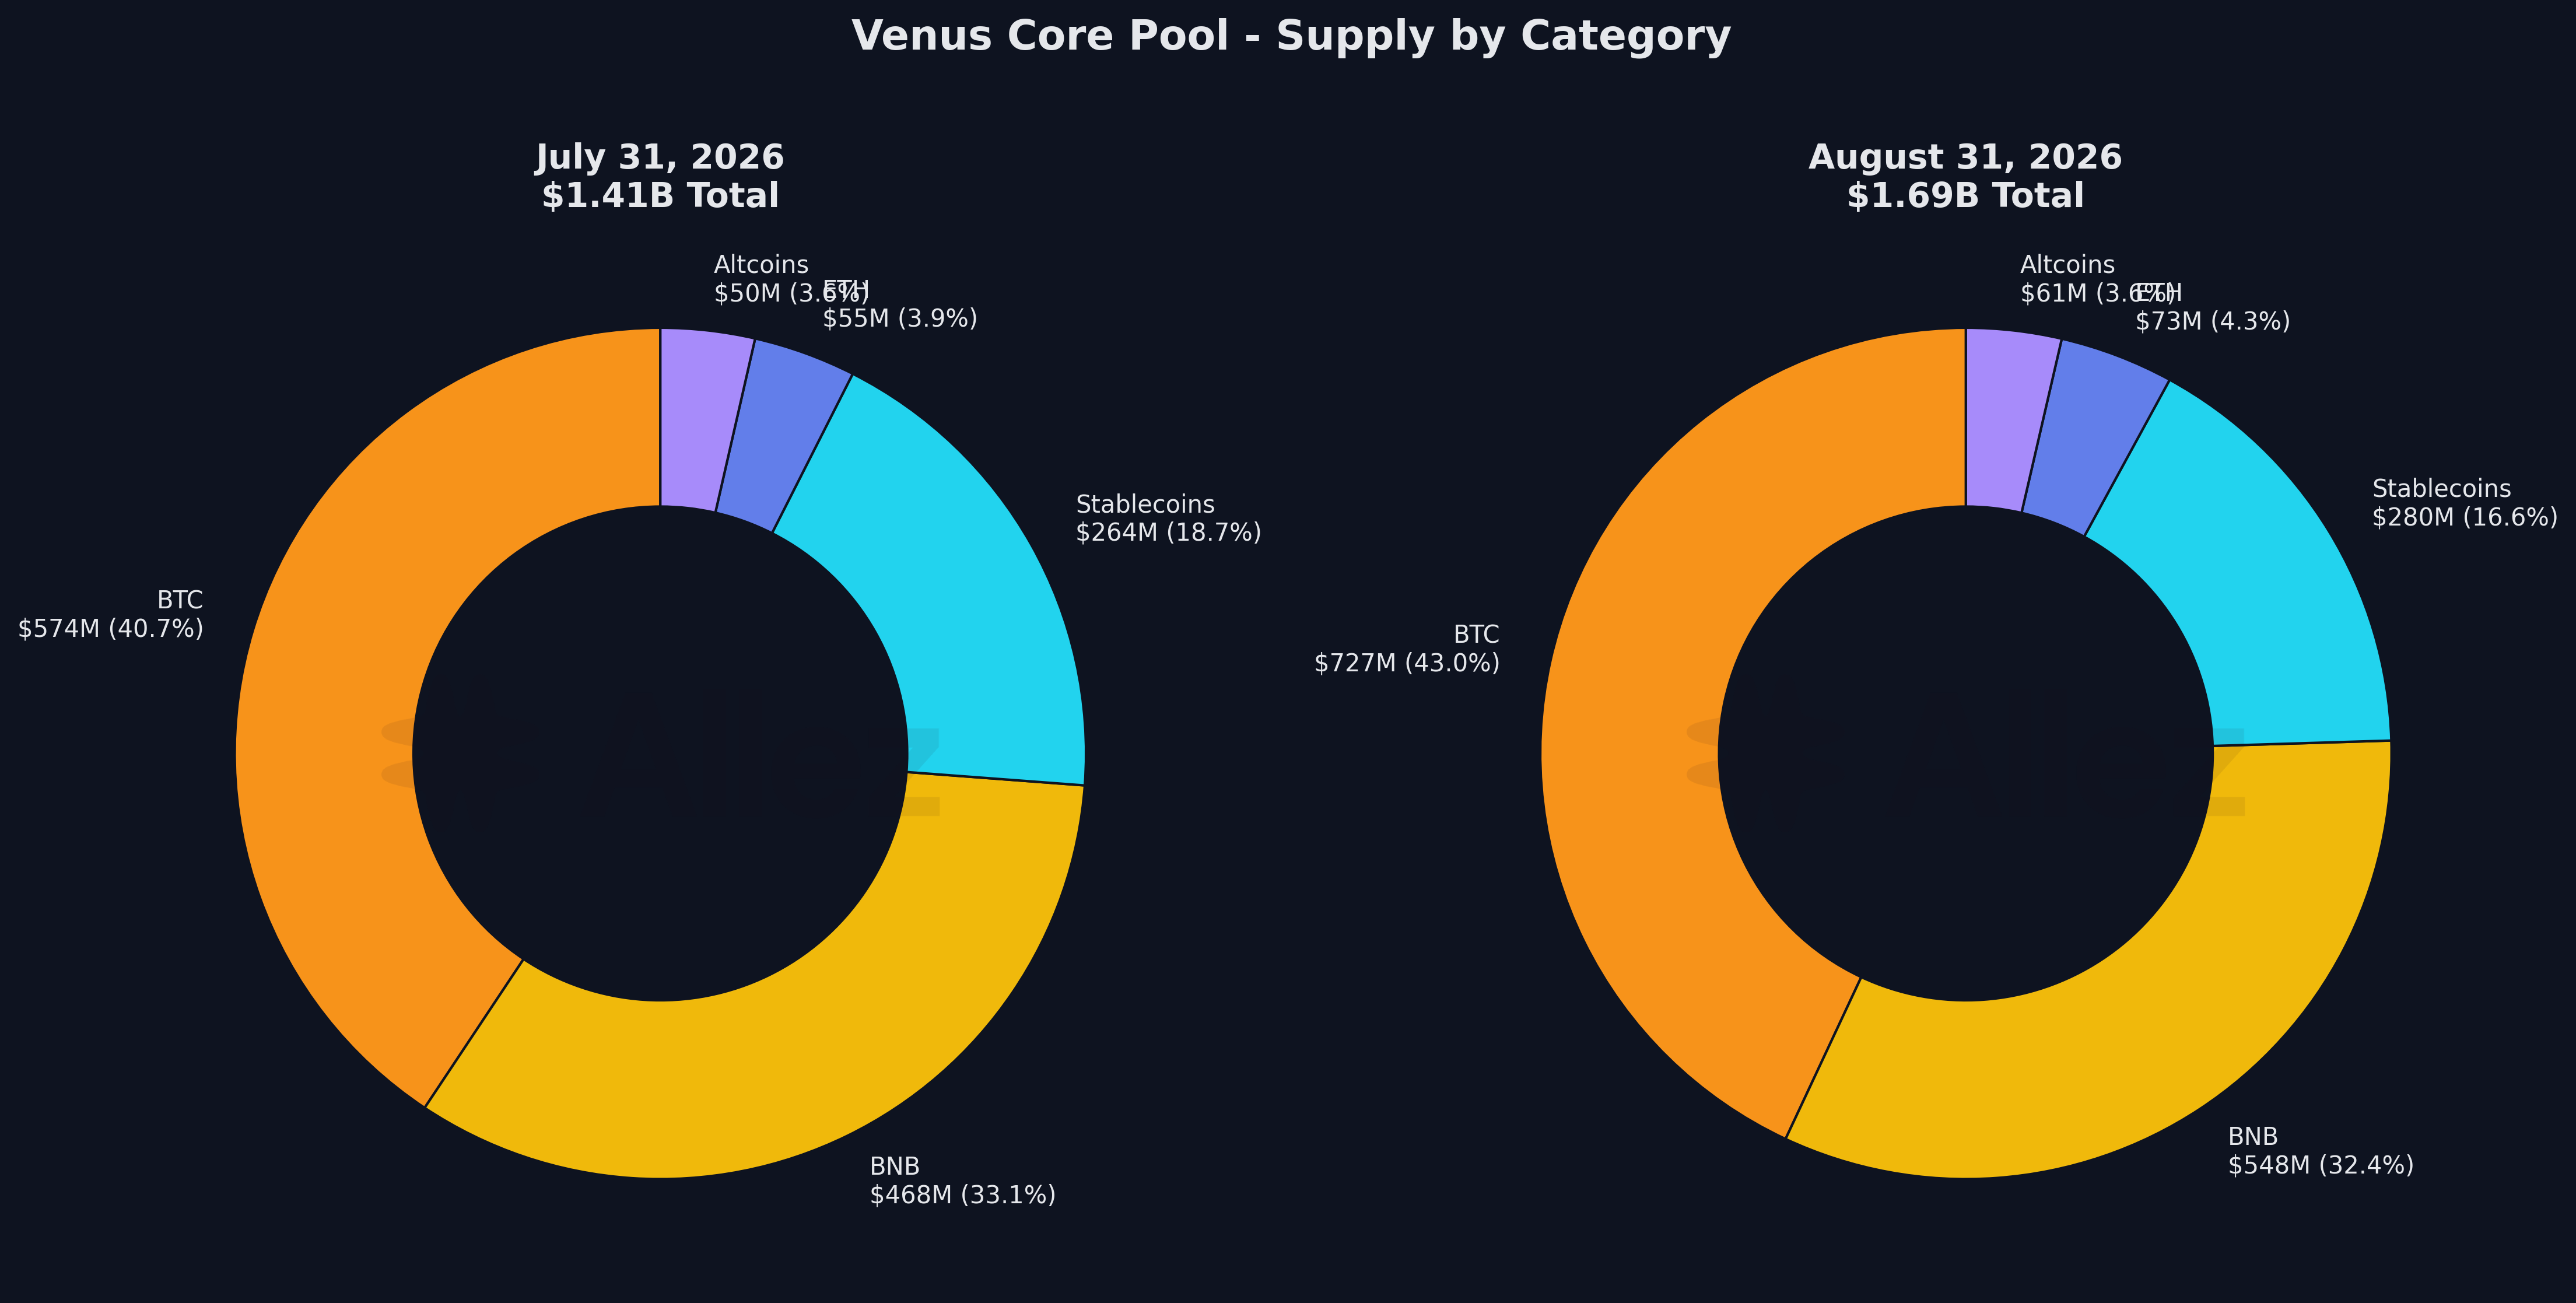
Category composition (August 31, 2026):
| Category | Supply | Share | MoM | Debt |
|---|---|---|---|---|
| BTC | $726.5M | 43.0% | +26.6% | $108.8M |
| BNB | $547.7M | 32.4% | +17.1% | $127.6M |
| Stablecoins | $279.7M | 16.6% | +5.8% | $180.7M |
| ETH | $73.1M | 4.3% | +33.1% | $18.4M |
| Altcoins (incl. $0.3M RWA) | $61.1M | 3.6% | +21.0% | $2.1M |
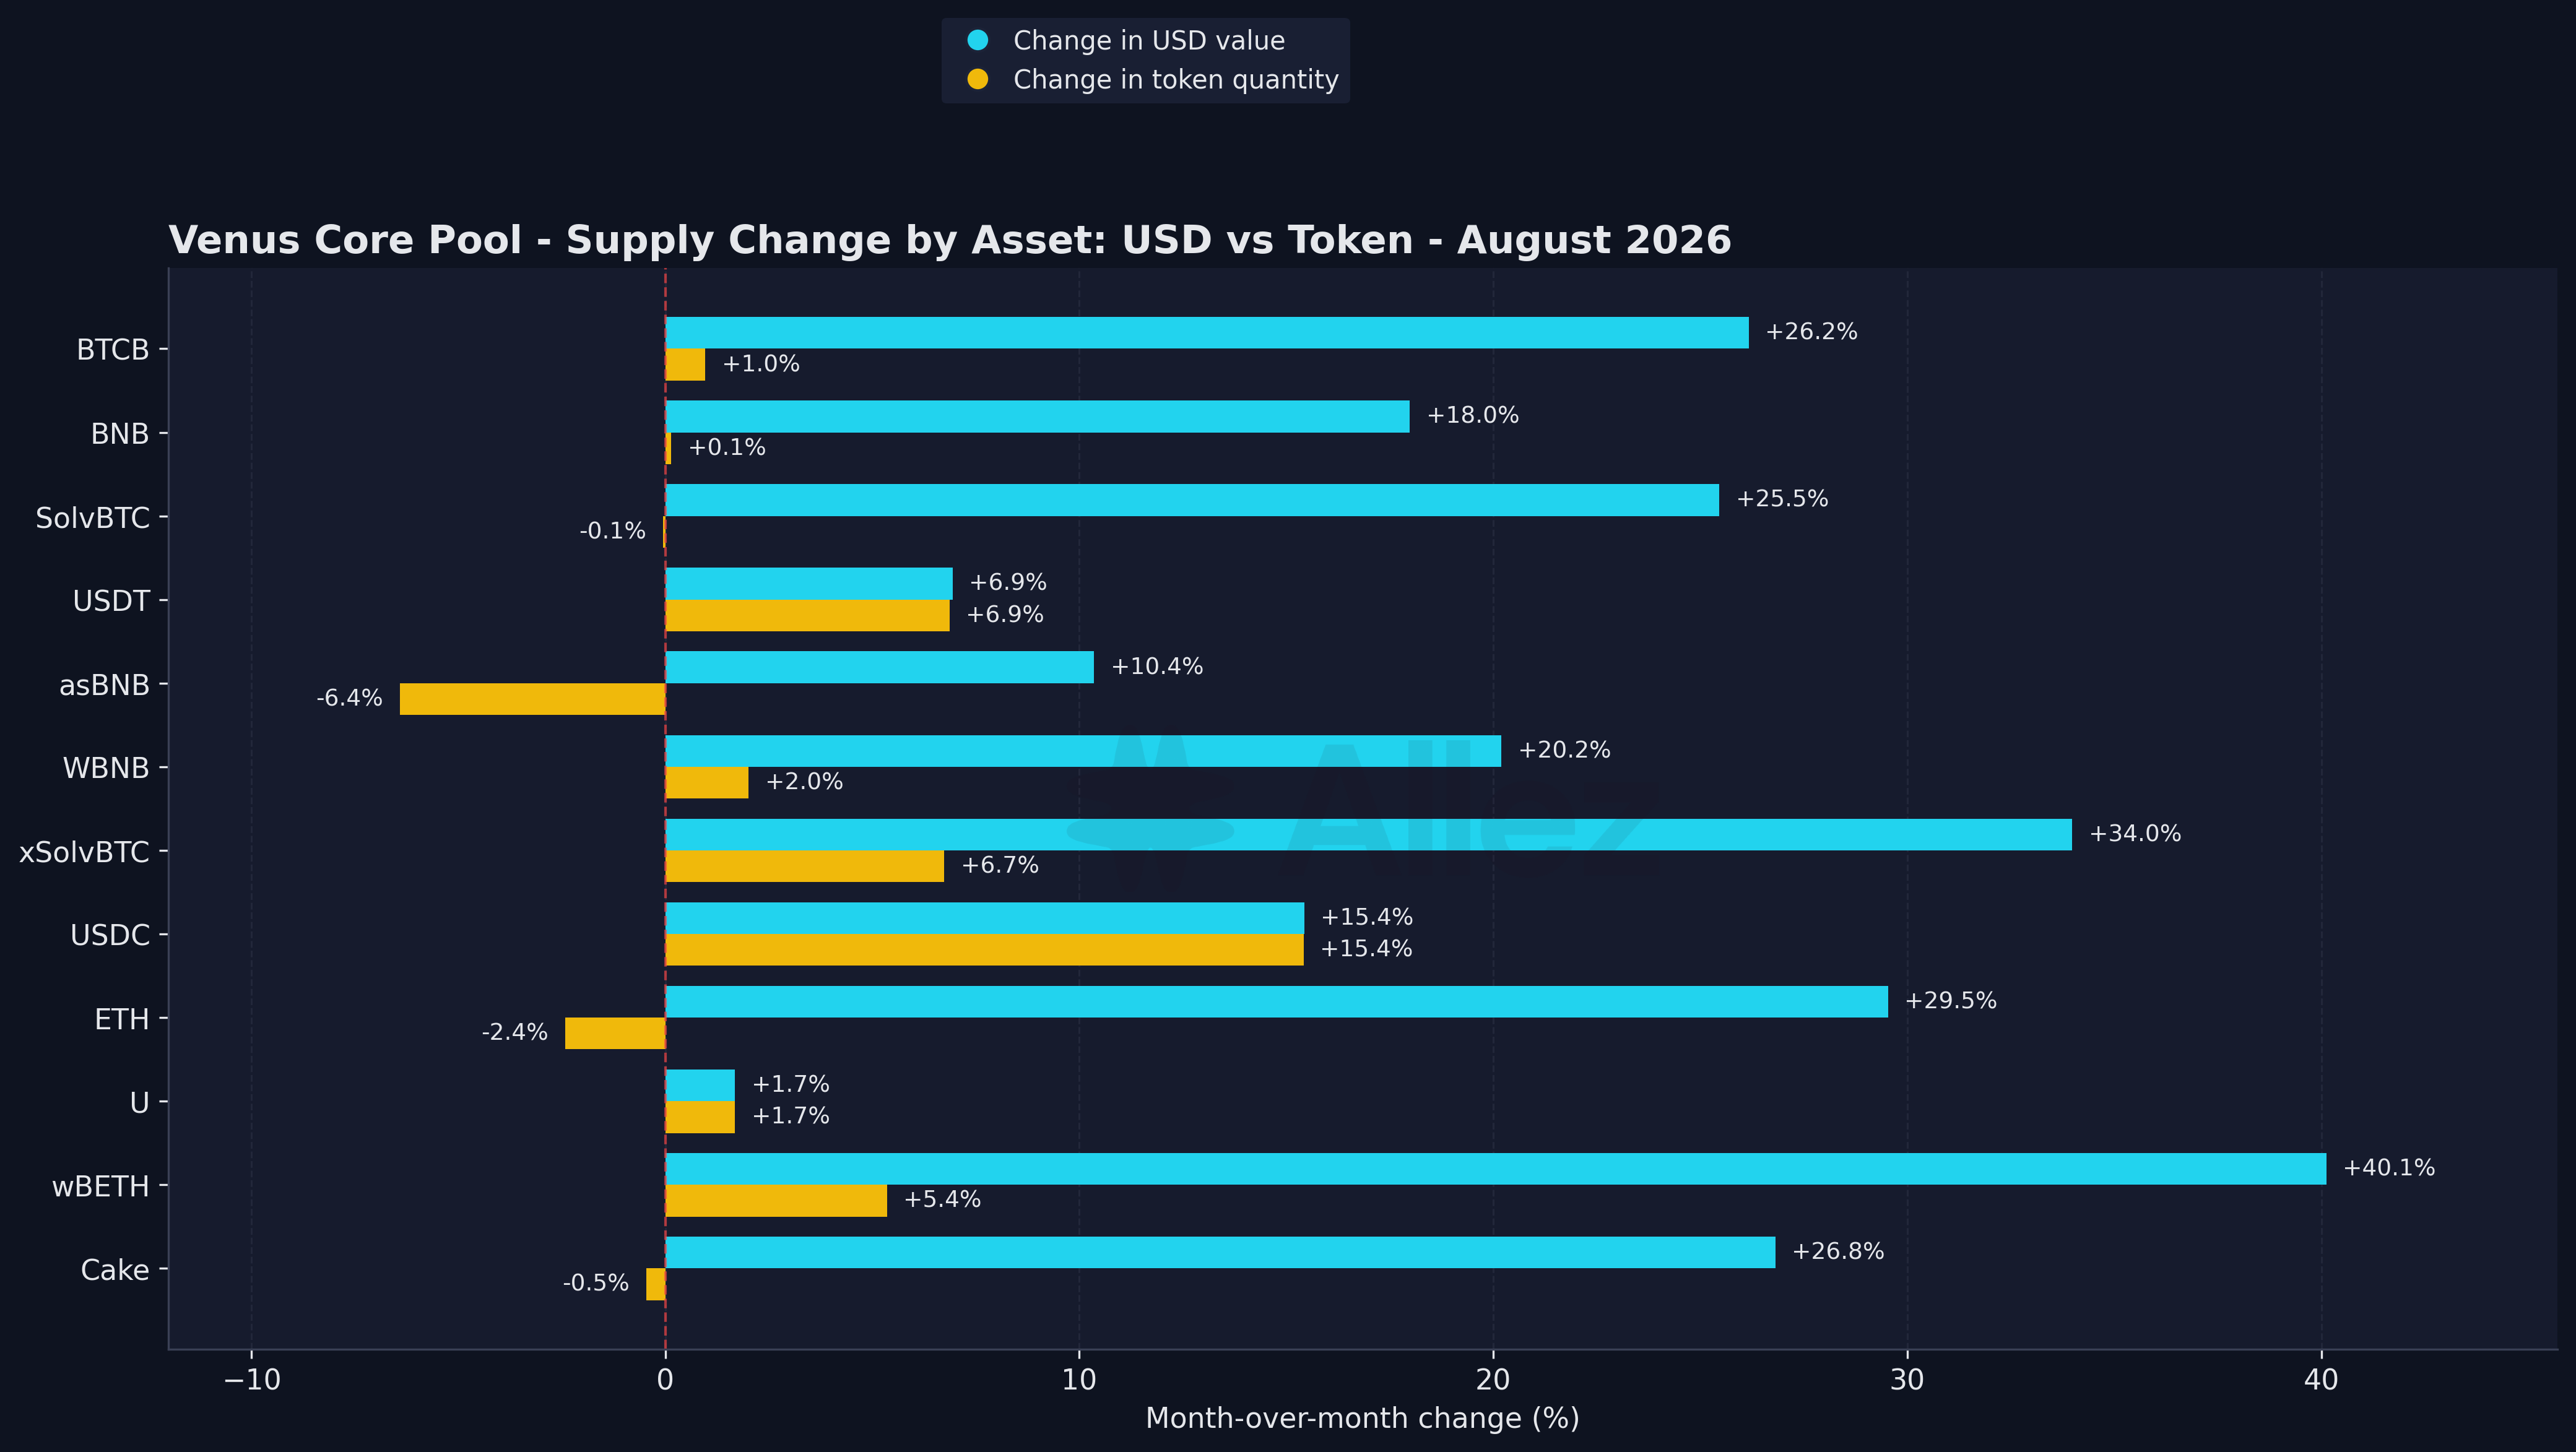
By token count, xSolvBTC and wBETH grew fastest (+6.7% and +5.4%) and BTCB added the most in absolute terms (+$4.4M), while asBNB and ETH shed tokens.
3. Risk & Liquidations
Liquidation summary:
| Metric | August Total | August (ex-Aug 20) |
|---|---|---|
| Total events | 443 | 439 |
| Collateral seized | $3,118,824 | $279,301 |
| Debt repaid | $2,832,997 | $251,608 |
| Peak day (by value) | Aug 20 (4 events, $2,839,523) | Aug 21 (10 events, $205,923) |
On August 20, one liquidation seized $2.84M of USDT collateral, 91% of the month's total, from an account that had borrowed ETH and BNB against USDT collateral.
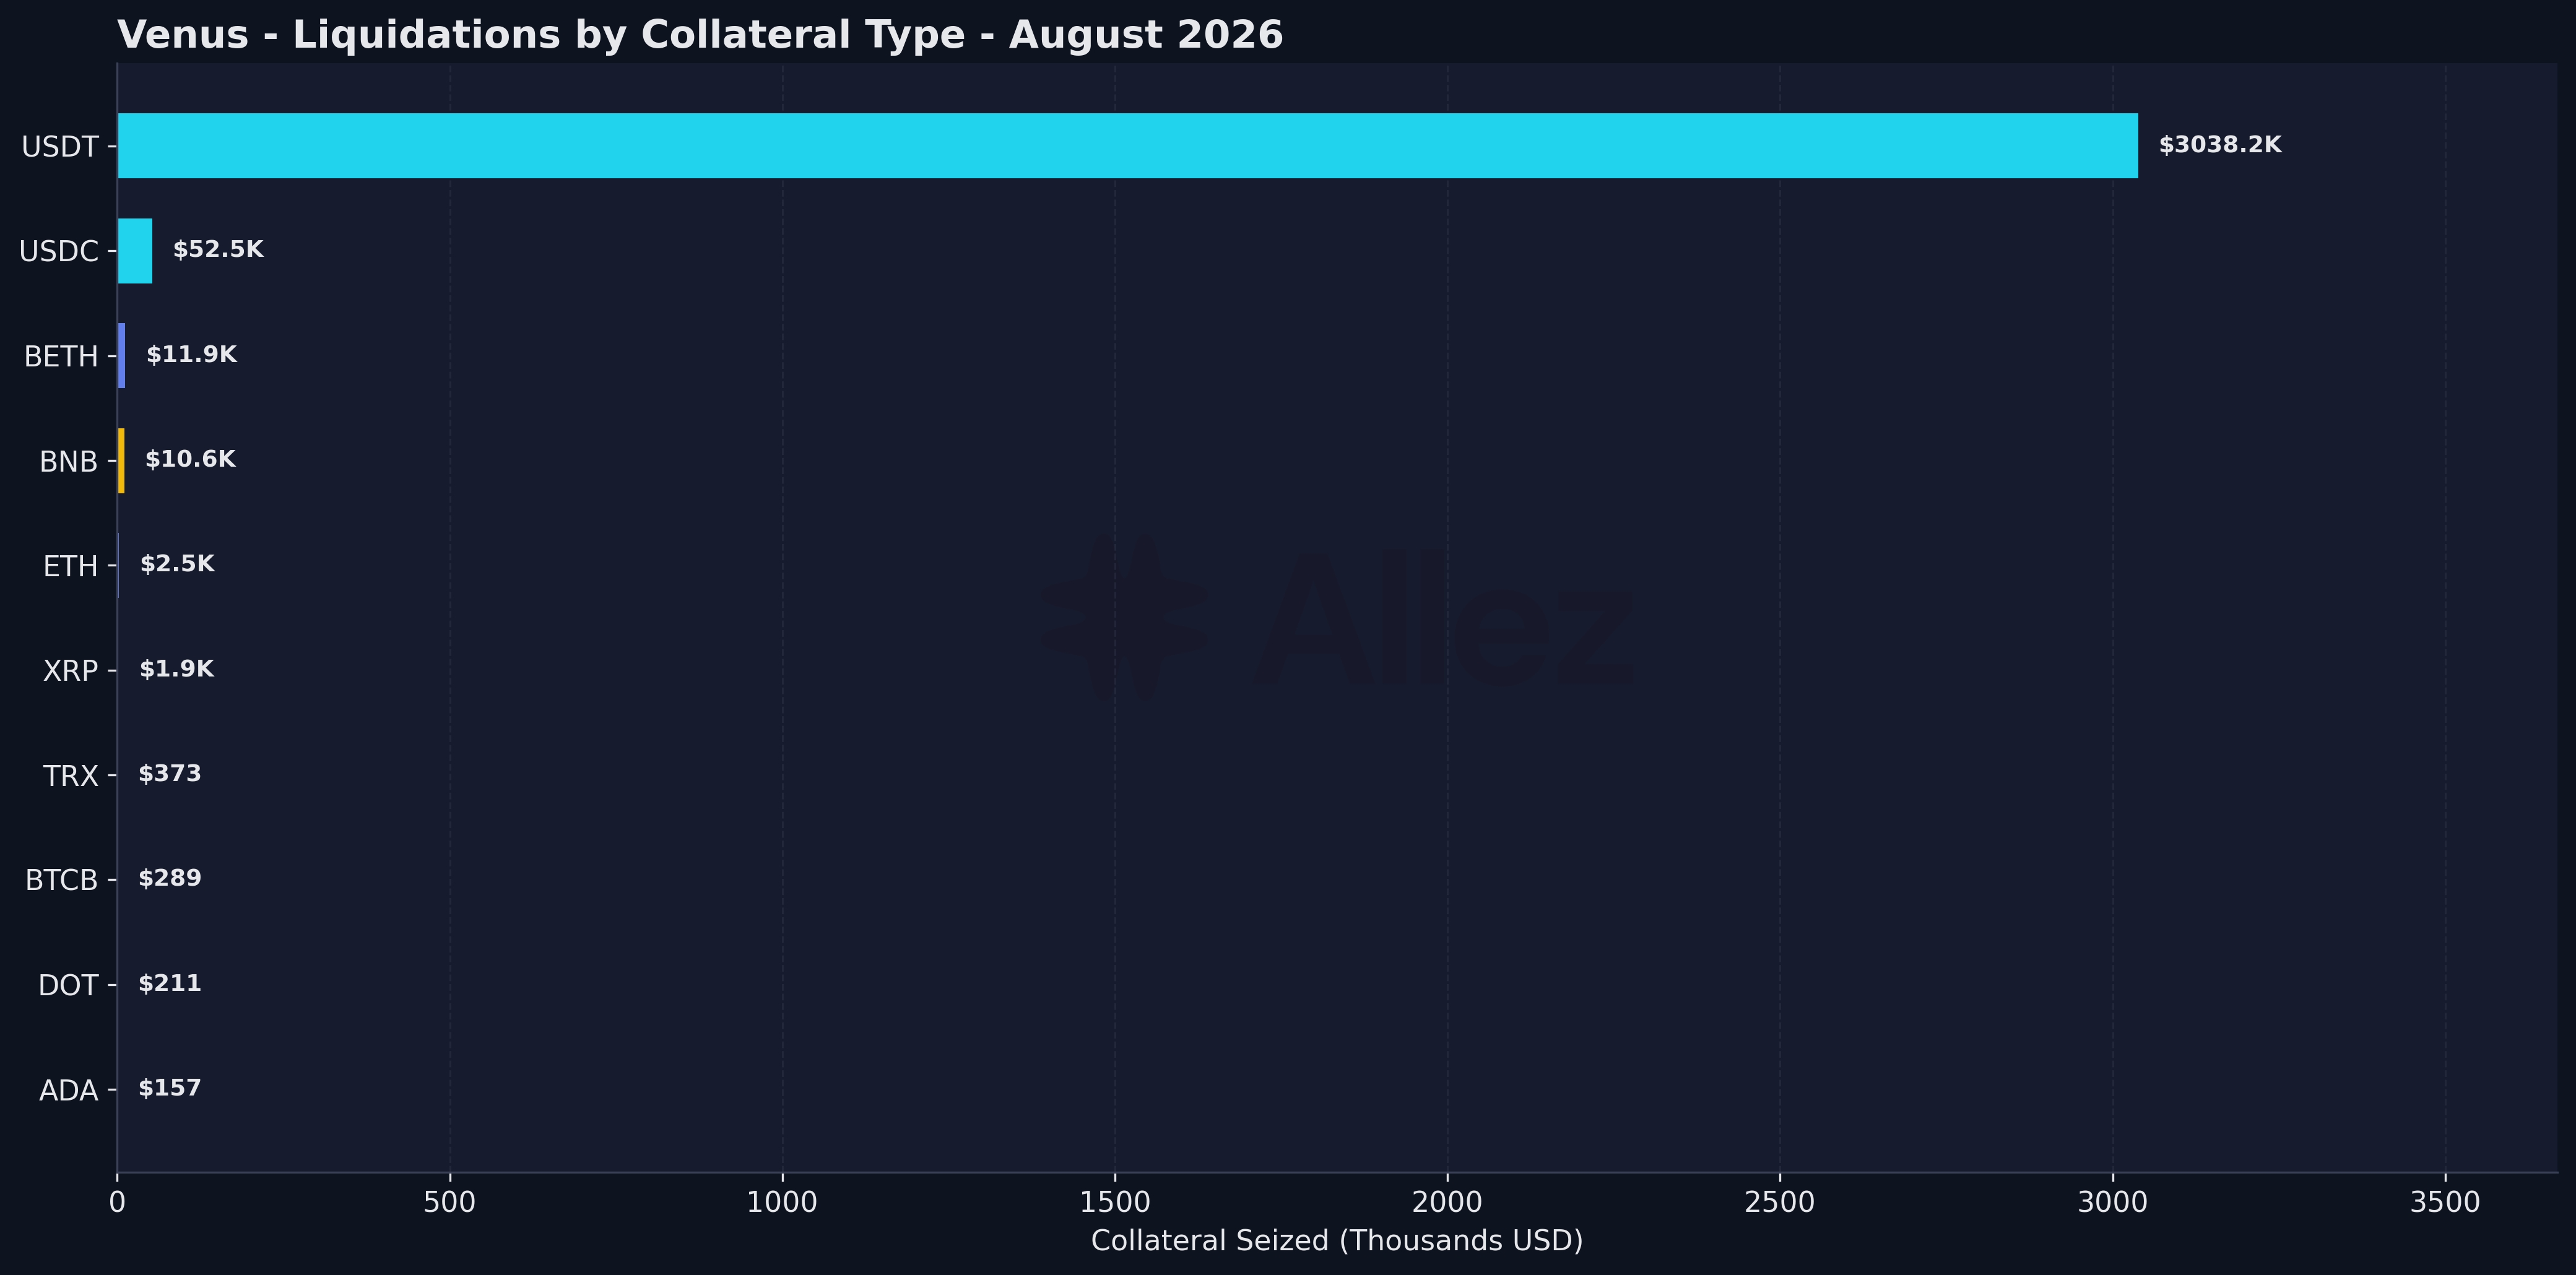
Liquidations by collateral type (August, all 443 events):
| Collateral | Seized | Events |
|---|---|---|
| USDT | $3.04M | 38 |
| USDC | $52.5K | 20 |
| BETH | $11.9K | 65 |
| BNB | $10.6K | 49 |
| ETH | $2.5K | 39 |
| All other collateral (25 types) | $3.2K | 232 |
| Total | $3.12M | 443 |
USDT is essentially all seized value, a direct result of August 20; every other collateral cleared five figures or less over the month.
Health factor distribution (August 31, 2026):
| Tier | HF Range | Debt | Correlated | Directional | Directional MoM |
|---|---|---|---|---|---|
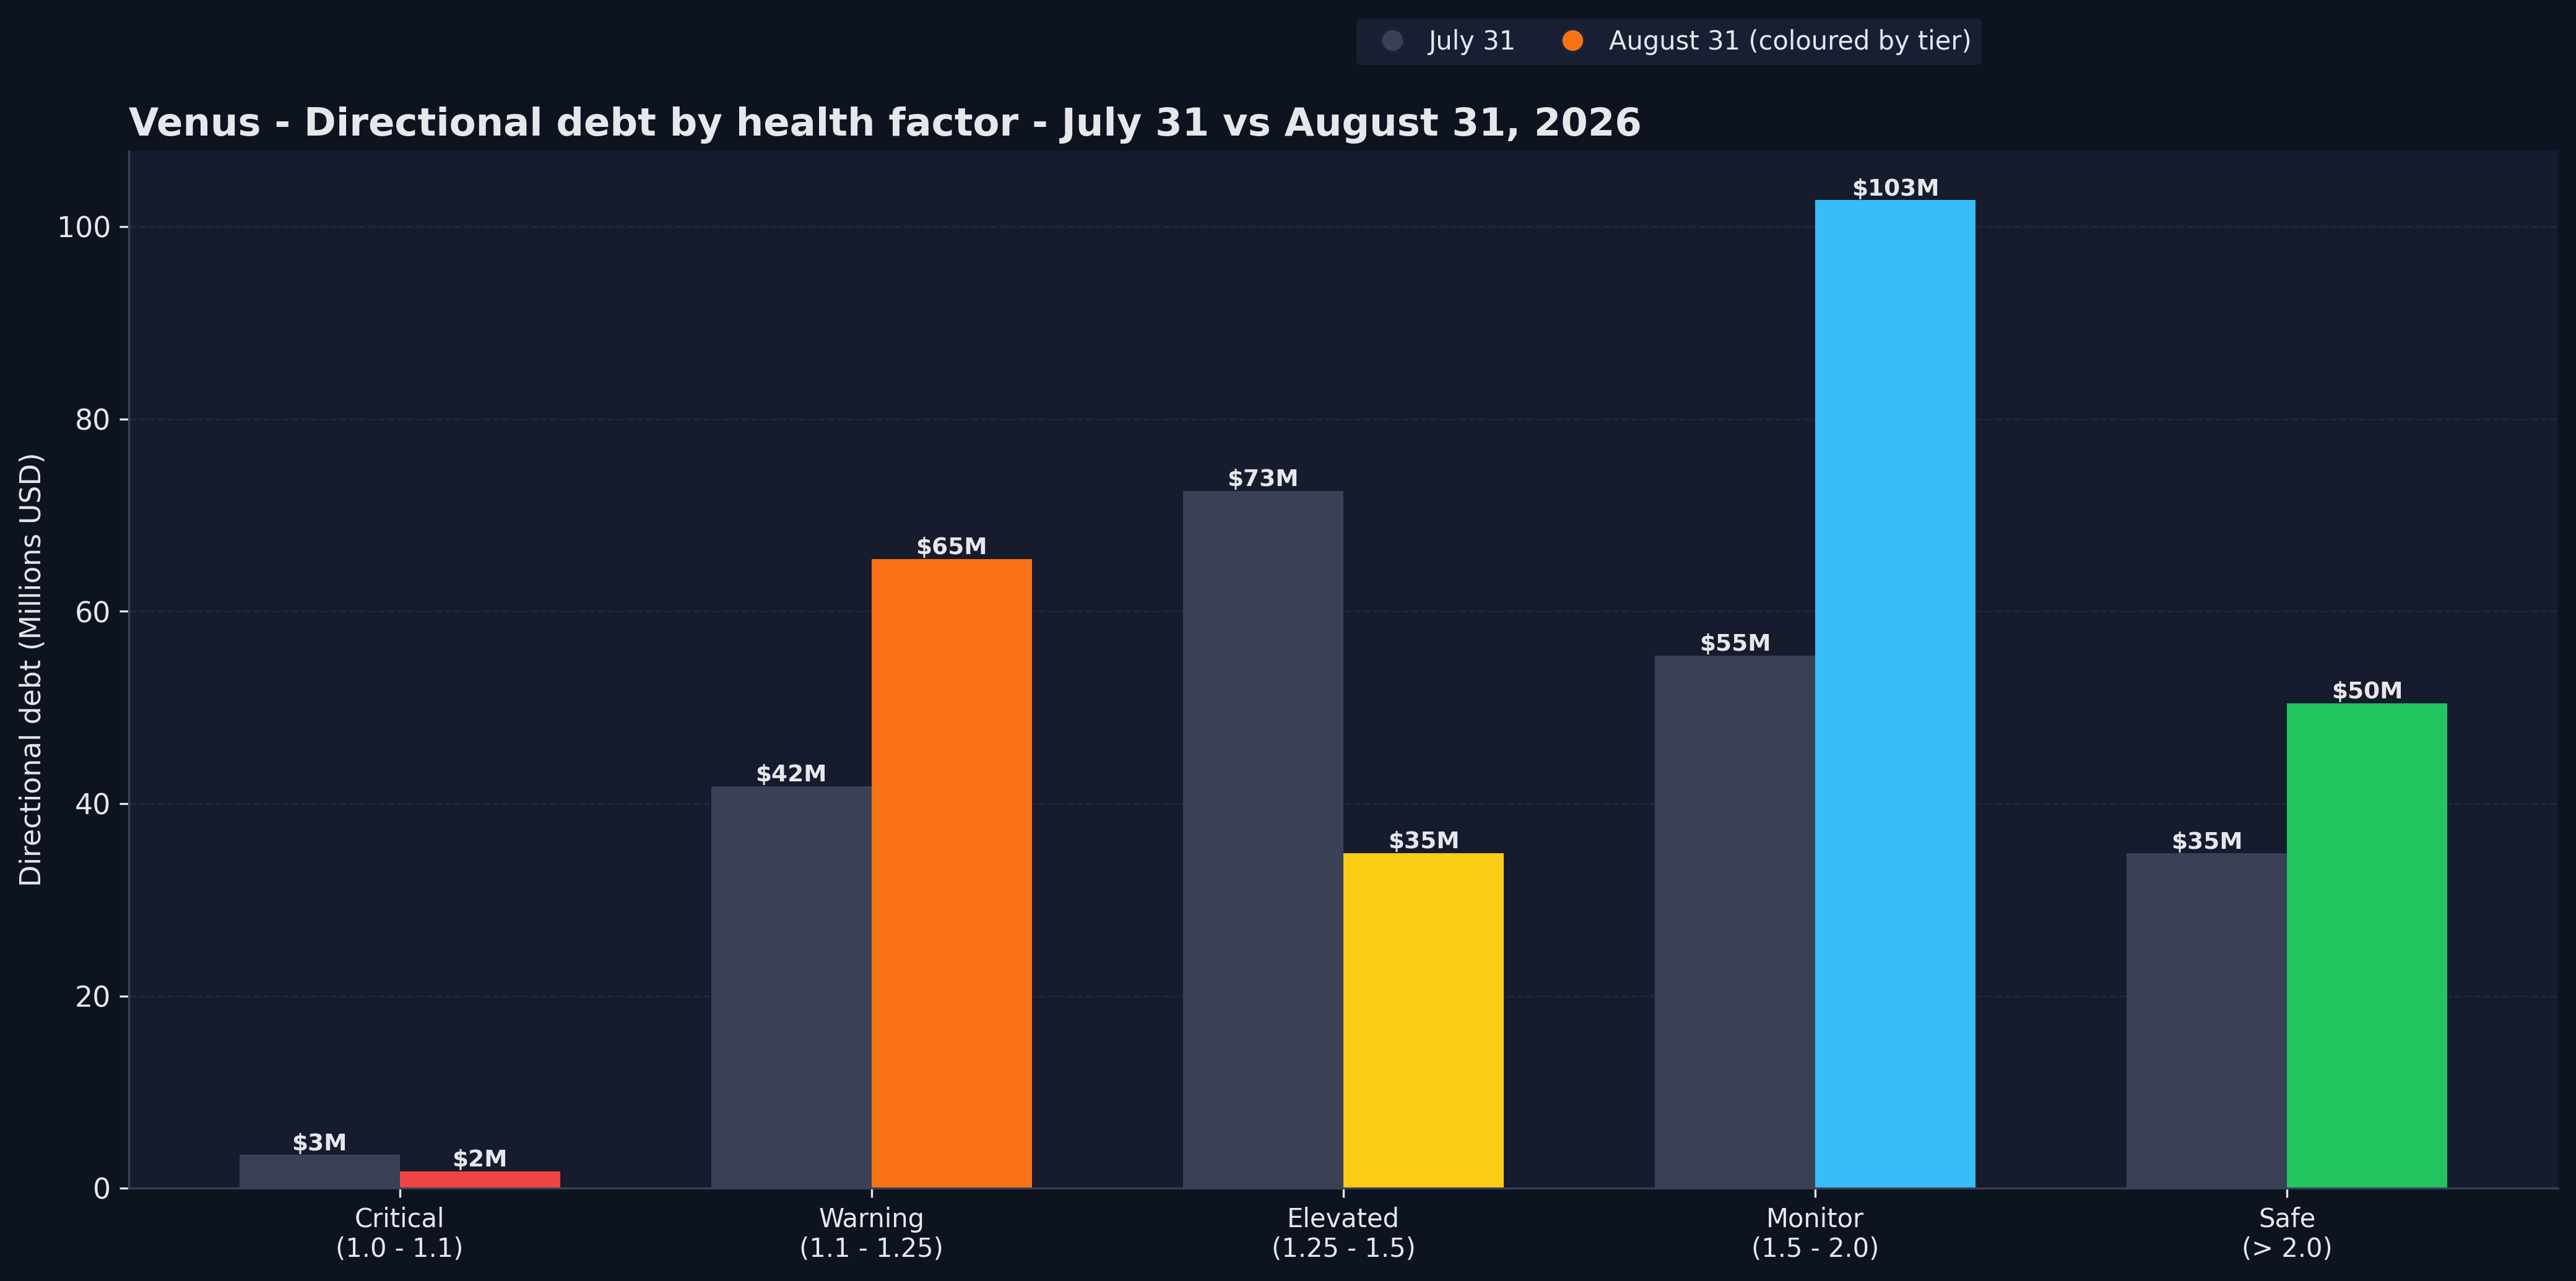
| Critical | 1.0 - 1.1 | $45.3M | $43.5M | $1.8M | -49.1% |
| Warning | 1.1 - 1.25 | $115.2M | $49.8M | $65.5M | +56.6% |
| Elevated | 1.25 - 1.5 | $93.8M | $58.9M | $34.9M | -51.9% |
| Monitor | 1.5 - 2.0 | $139.2M | $36.4M | $102.7M | +85.5% |
| Safe | > 2.0 | $52.5M | $2.0M | $50.4M | +44.9% |
| Total | $445.9M | $190.6M | $255.3M | +22.7% |
There is $1.8M of directional debt within 10% of liquidation, 0.4% of the total, down from $3.5M at the start of the month, despite total directional debt growing 23%.
Stablecoin debt by collateral (six largest collaterals):
| Collateral | Stablecoin Debt | Jul Debt | MoM | Within 10% of Liquidation |
|---|---|---|---|---|
| BTCB | $78.6M | $67.8M | +16.0% | $2.31M |
| SolvBTC | $40.0M | $33.4M | +19.6% | ~$0 |
| BNB | $27.8M | $25.1M | +10.8% | $0.08M |
| wBETH | $10.5M | $6.8M | +55.2% | $0.03M |
| ETH | $8.4M | $8.0M | +5.2% | $0.03M |
| USDT | $5.3M | $7.6M | -29.5% | $2.69M |
Stablecoin debt remains concentrated against large-cap crypto collateral such as BTC and BNB, and little of it is near liquidation.
Forward stress test:
We simulate every account under a uniform shock to volatile collateral and debt (pinning stablecoins at $1) and recompute account health. Correlated positions take the shock on both legs and stay roughly neutral while the accounts that break are directional.
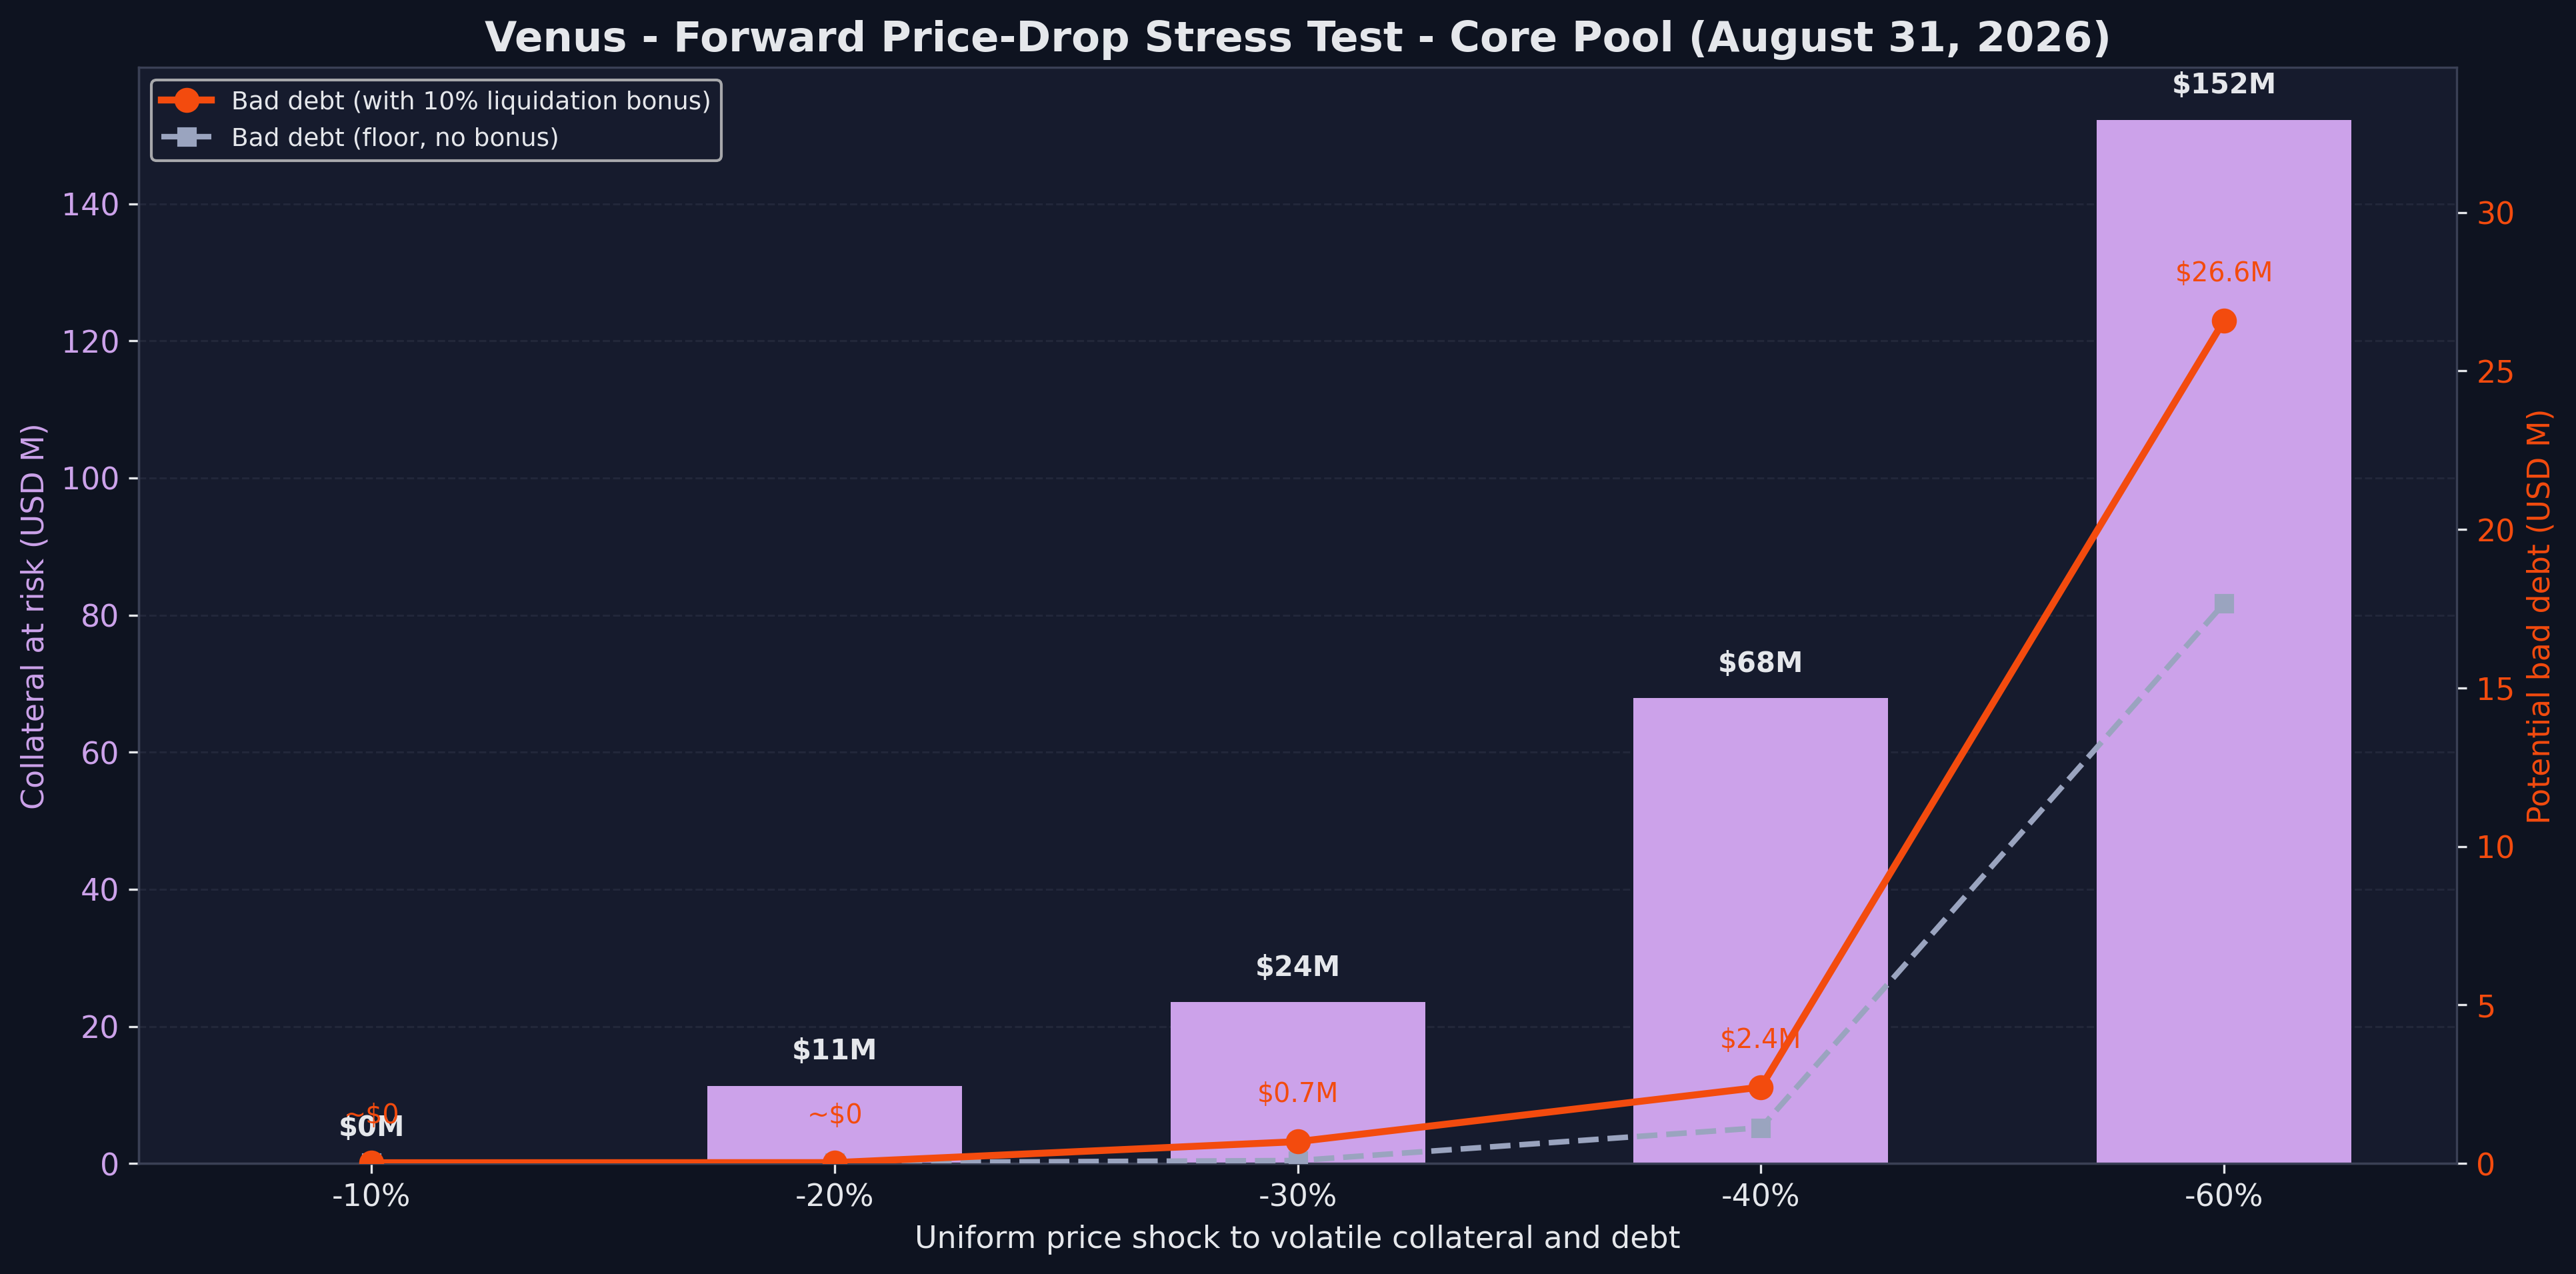
| Further price shock | Accounts liquidated | Collateral at risk | Jul 31 collateral at risk | Collateral-at-risk MoM | Bad debt (+10% bonus) | Jul 31 bad debt |
|---|---|---|---|---|---|---|
| No shock (baseline) | 5,307 | $0.14M | $0.16M | -11.0% | ~$0 | ~$0 |
| -10% | 5,300 | $0.1M | $5.5M | -97.6% | ~$0 | ~$0 |
| -20% | 5,385 | $11.3M | $21.3M | -46.8% | ~$0 | $0.1M |
| -30% | 5,964 | $23.5M | $45.7M | -48.5% | $0.7M | $0.8M |
| -40% | 6,834 | $67.9M | $106.1M | -36.0% | $2.4M | $4.6M |
| -60% | 8,561 | $152.2M | $124.4M | +22.4% | $26.6M | $33.7M |
The pool is more resilient than in July at every shock from -10% to -40%. At a -40% shock, bad debt is only $2.4M against July's $4.6M, primarily due to extra cushion afforded by recent price increases. The exception is -60%, where collateral at risk rose to $152.2M (+22.4%) on a larger post-rally pool, though bad debt at that shock still fell, to $26.6M from $33.7M.
Top borrowers and borrower concentration:
| Borrower | Total Debt | MoM | Primary Asset |
|---|---|---|---|
| 0x3e87...d90c | $52.1M | +15.4% | BNB |
| 0x5c18...fe77 | $40.7M | +64.7% | BNB |
| 0xc482...82a8 | $26.6M | +7.3% | BTCB |
| 0x9614...8bf1 | $21.5M | +23.5% | BTCB |
The four largest pool borrowers hold about $141M, 32% of protocol debt (July: $112M, 29%), in BNB or BTCB. The largest is a $52.1M BNB borrow (12% of debt), while the second largest grew fast, +64.7% to $40.7M.
Risk controls:
The DeviationSentinel fired several times in August, dynamically pausing certain asset actions on the protocol to keep users safe when on-chain (DEX) pricing deviated from expected prices. TRX liquidity has thinned as bridges to BNB Chain have begun shutting down, While BSC supply has been fixed at 295.6M TRX for 14 months, TRX-side DEX liquidity is about $246K. This month, the primary DEX pool fell out of alignment with the Oracle price. Since this, the DAO has begun moving towards off-boarding TRX. lisUSD’s single oracle feed returned $0.9095 against a pool price of $0.9975 for 32.5 minutes with no pivot or fallback feed in its resilient oracle chain. lisUSD held its peg on-chain throughout; the divergence was in the feed. Borrowing remains paused pending the deprecation vote.
There were also developments to the Venus oracle ecosystem. VIP-654 introduced APRO as a pivot feed on the bStock markets, APRO’s inaugural use in the Core Pool. This migration will improve the robustness of supported bStocks by including a check against the main (Atlas) oracle protecting the protocol against any incorrect pricing.
4. Collateral Structure
Top collateral/borrow pairs:
| Collateral | Borrowed | Debt | Jul Debt | MoM | Users |
|---|---|---|---|---|---|
| BTCB | USDT | $60.5M | $50.9M | +18.9% | 2,184 |
| SolvBTC | BTCB | $35.7M | $34.8M | +2.6% | 21 |
| BTCB | BNB | $35.5M | $27.0M | +31.5% | 1,862 |
| SolvBTC | USDT | $34.3M | $28.3M | +21.2% | 41 |
| BTCB | BTCB | $34.1M | $28.0M | +21.8% | 611 |
| xSolvBTC | BTCB | $33.4M | $28.6M | +16.9% | 12 |
| asBNB | BNB | $31.4M | $31.7M | -1.0% | 33 |
Thousands of users borrow stablecoins or BNB against BTCB, carrying directional risk. A smaller but still material number use looping strategies: SolvBTC and xSolvBTC against BTCB, and asBNB against BNB.
5. Utilization & Collateral Configuration
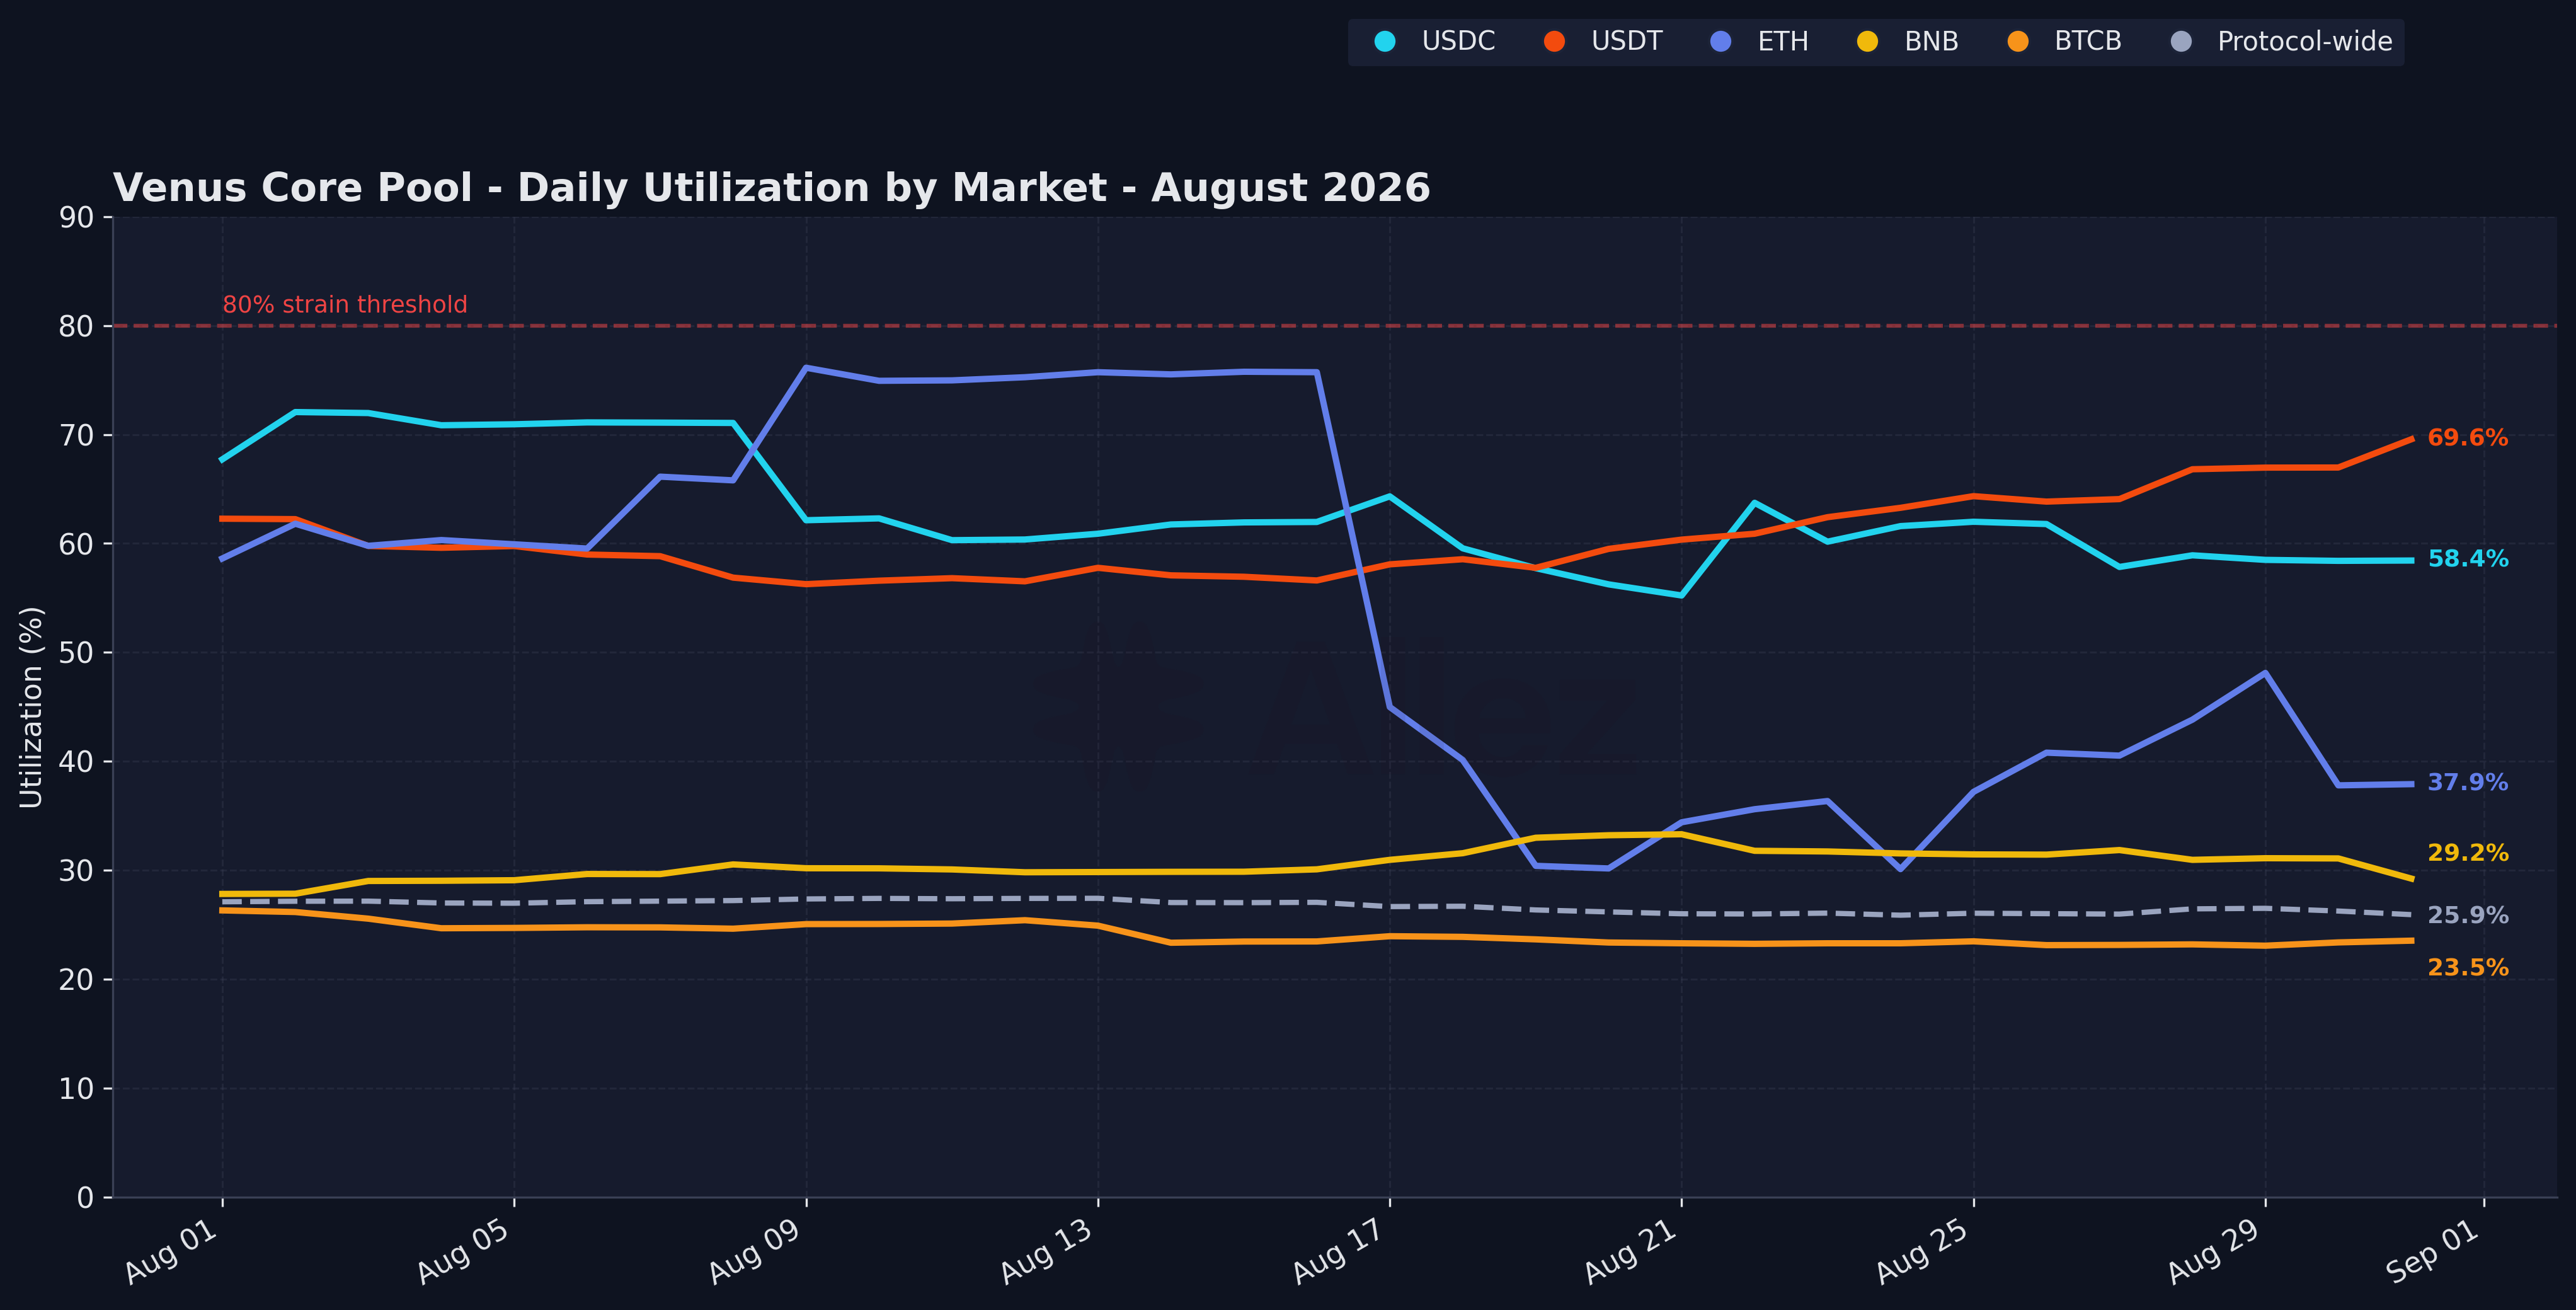
Protocol utilization held between 26% and 27% and closed at 25.9%. Stablecoins are the most used: USDT 69.6%, USDC 58.4% after a mid-month peak around 72%. ETH eased from about 59% to 37.9% as supply outgrew borrowing; BNB and BTCB stayed in the 20s (29.2% and 23.5%).
6. Summary & Forward Look
Venus's largest liquidation of August came from rising prices. One account that had borrowed ETH and BNB against USDT collateral had $2.84M of USDT seized, accounting for 91% of the month's seized value.
Downside resilience improved despite the larger pool. Directional debt within 10% of liquidation fell from $3.5M to $1.8M, and the stress test shows less collateral at risk than at the end of July under every shock from 10% to 40%.
Two of July's watch items moved materially. Borrower concentration increased, with the top four borrowers rising from $112M and 29% of debt to $141M and 32%. The $17M stablecoin outflow reversed as USDT and USDC supply increased by $18.9M. The third item was basis risk in correlated pairs. July's $40.9M figure classified same-category collateral and debt as correlated; it did not measure actual e-mode enrollment. August separates the two: $43.5M of Critical-tier debt is correlated, of which $4.2M is enrolled in an e-mode pool.
Things to watch in September:
-
**Borrower and SolvBTC concentration. **The top four borrowers gained three points of share in a month. SolvBTC and xSolvBTC hold $265M of supply and back the largest correlated pairs. Their health factors are comfortable; what we have not measured is how much of that could be sold if it had to be, and we will size it next month.
-
Basis risk in correlated pairs. $43.5M of Critical-tier debt is classified correlated, but only $4.2M is enrolled in an e-mode pool. The enrolled portion runs liquidation thresholds of 0.83 to 0.93, leaving a thin buffer against a depeg or redemption-rate move. The other $39.3M gets no e-mode cushion at all if its two legs stop moving together.
-
Short-side exposure to a continued rally. One account that had borrowed ETH and BNB against USDT collateral had $2.84M of USDT seized during the August rally. Similar positions become less healthy when volatile debt appreciates against stablecoin collateral. The current stress test models falling crypto prices, so it does not measure this exposure. Next month's analysis should add upside shocks for volatile debt.
Core Pool enters September carrying more BTC and thicker buffers than it did in August. BTC and BNB prices remain the dominant sensitivity. August added a smaller one: part of the pool is now short those same assets, and for them the danger is another leg up.
Readers can follow current Venus market and risk metrics on the Allez Venus Risk Dashboard.
Appendix: Asset Category Classification
| Category | Assets | Supply | Debt |
|---|---|---|---|
| BTC | BTCB, SolvBTC, xSolvBTC | $726.5M | $108.8M |
| BNB | BNB, WBNB, asBNB, slisBNB, PT-clisBNB | $547.7M | $127.6M |
| Stablecoins | USDT, USDC, U, USDe, sUSDe, lisUSD, FDUSD, DAI, TUSD, USD1, BUSD | $279.7M | $180.7M |
| ETH | ETH, wBETH, BETH | $73.1M | $18.4M |
| Altcoins | Cake, XRP, DOGE, ADA, DOT, FIL, LINK, UNI, AAVE, LTC, BCH, TRX, MATIC, THE, TWT, XVS, SOL | $60.7M | $2.1M |
| RWA | NVDAB, TSLAB, SPCXB, SKHYB (bStocks), XAUM (gold) | $0.3M | $0.0M |
Correlated positions hold collateral and debt in the same category (SolvBTC/BTCB, asBNB/BNB); directional positions borrow across categories. The classification is account-level and does not measure e-mode enrollment.
Scope: Venus Core Pool on BNB Chain only.
This report represents independent risk analysis by Allez Labs for the Venus community.