Kamino's new products drove October's growth. Active fixed-rate loans nearly quadrupled, from $21.5M to $79.5M, in the first full month of Kamino Fixed Rates. AUTO market supply rose 160.5% to $169.2M, and RWAs became the largest supply category at 30.5%. Demand for credit held up through a weaker market. Borrow volume rose 16.0%, and interest paid by borrowers held at $4.73M.
Total supply fell 19.1% to $2.27B and debt 19.9% to $0.87B, driven by two events. SOL fell 19.5%, with the sharpest drop after the Binance hot-wallet hack on October 29. The Ethena market unwound most of its positions after Ethena ended its USDe token incentives in September. Liquidations stayed small at $0.92M of collateral, while uncorrelated borrowing within 10% of liquidation rose from $6.8M to $12.8M.
1. Market Context and SOL Price
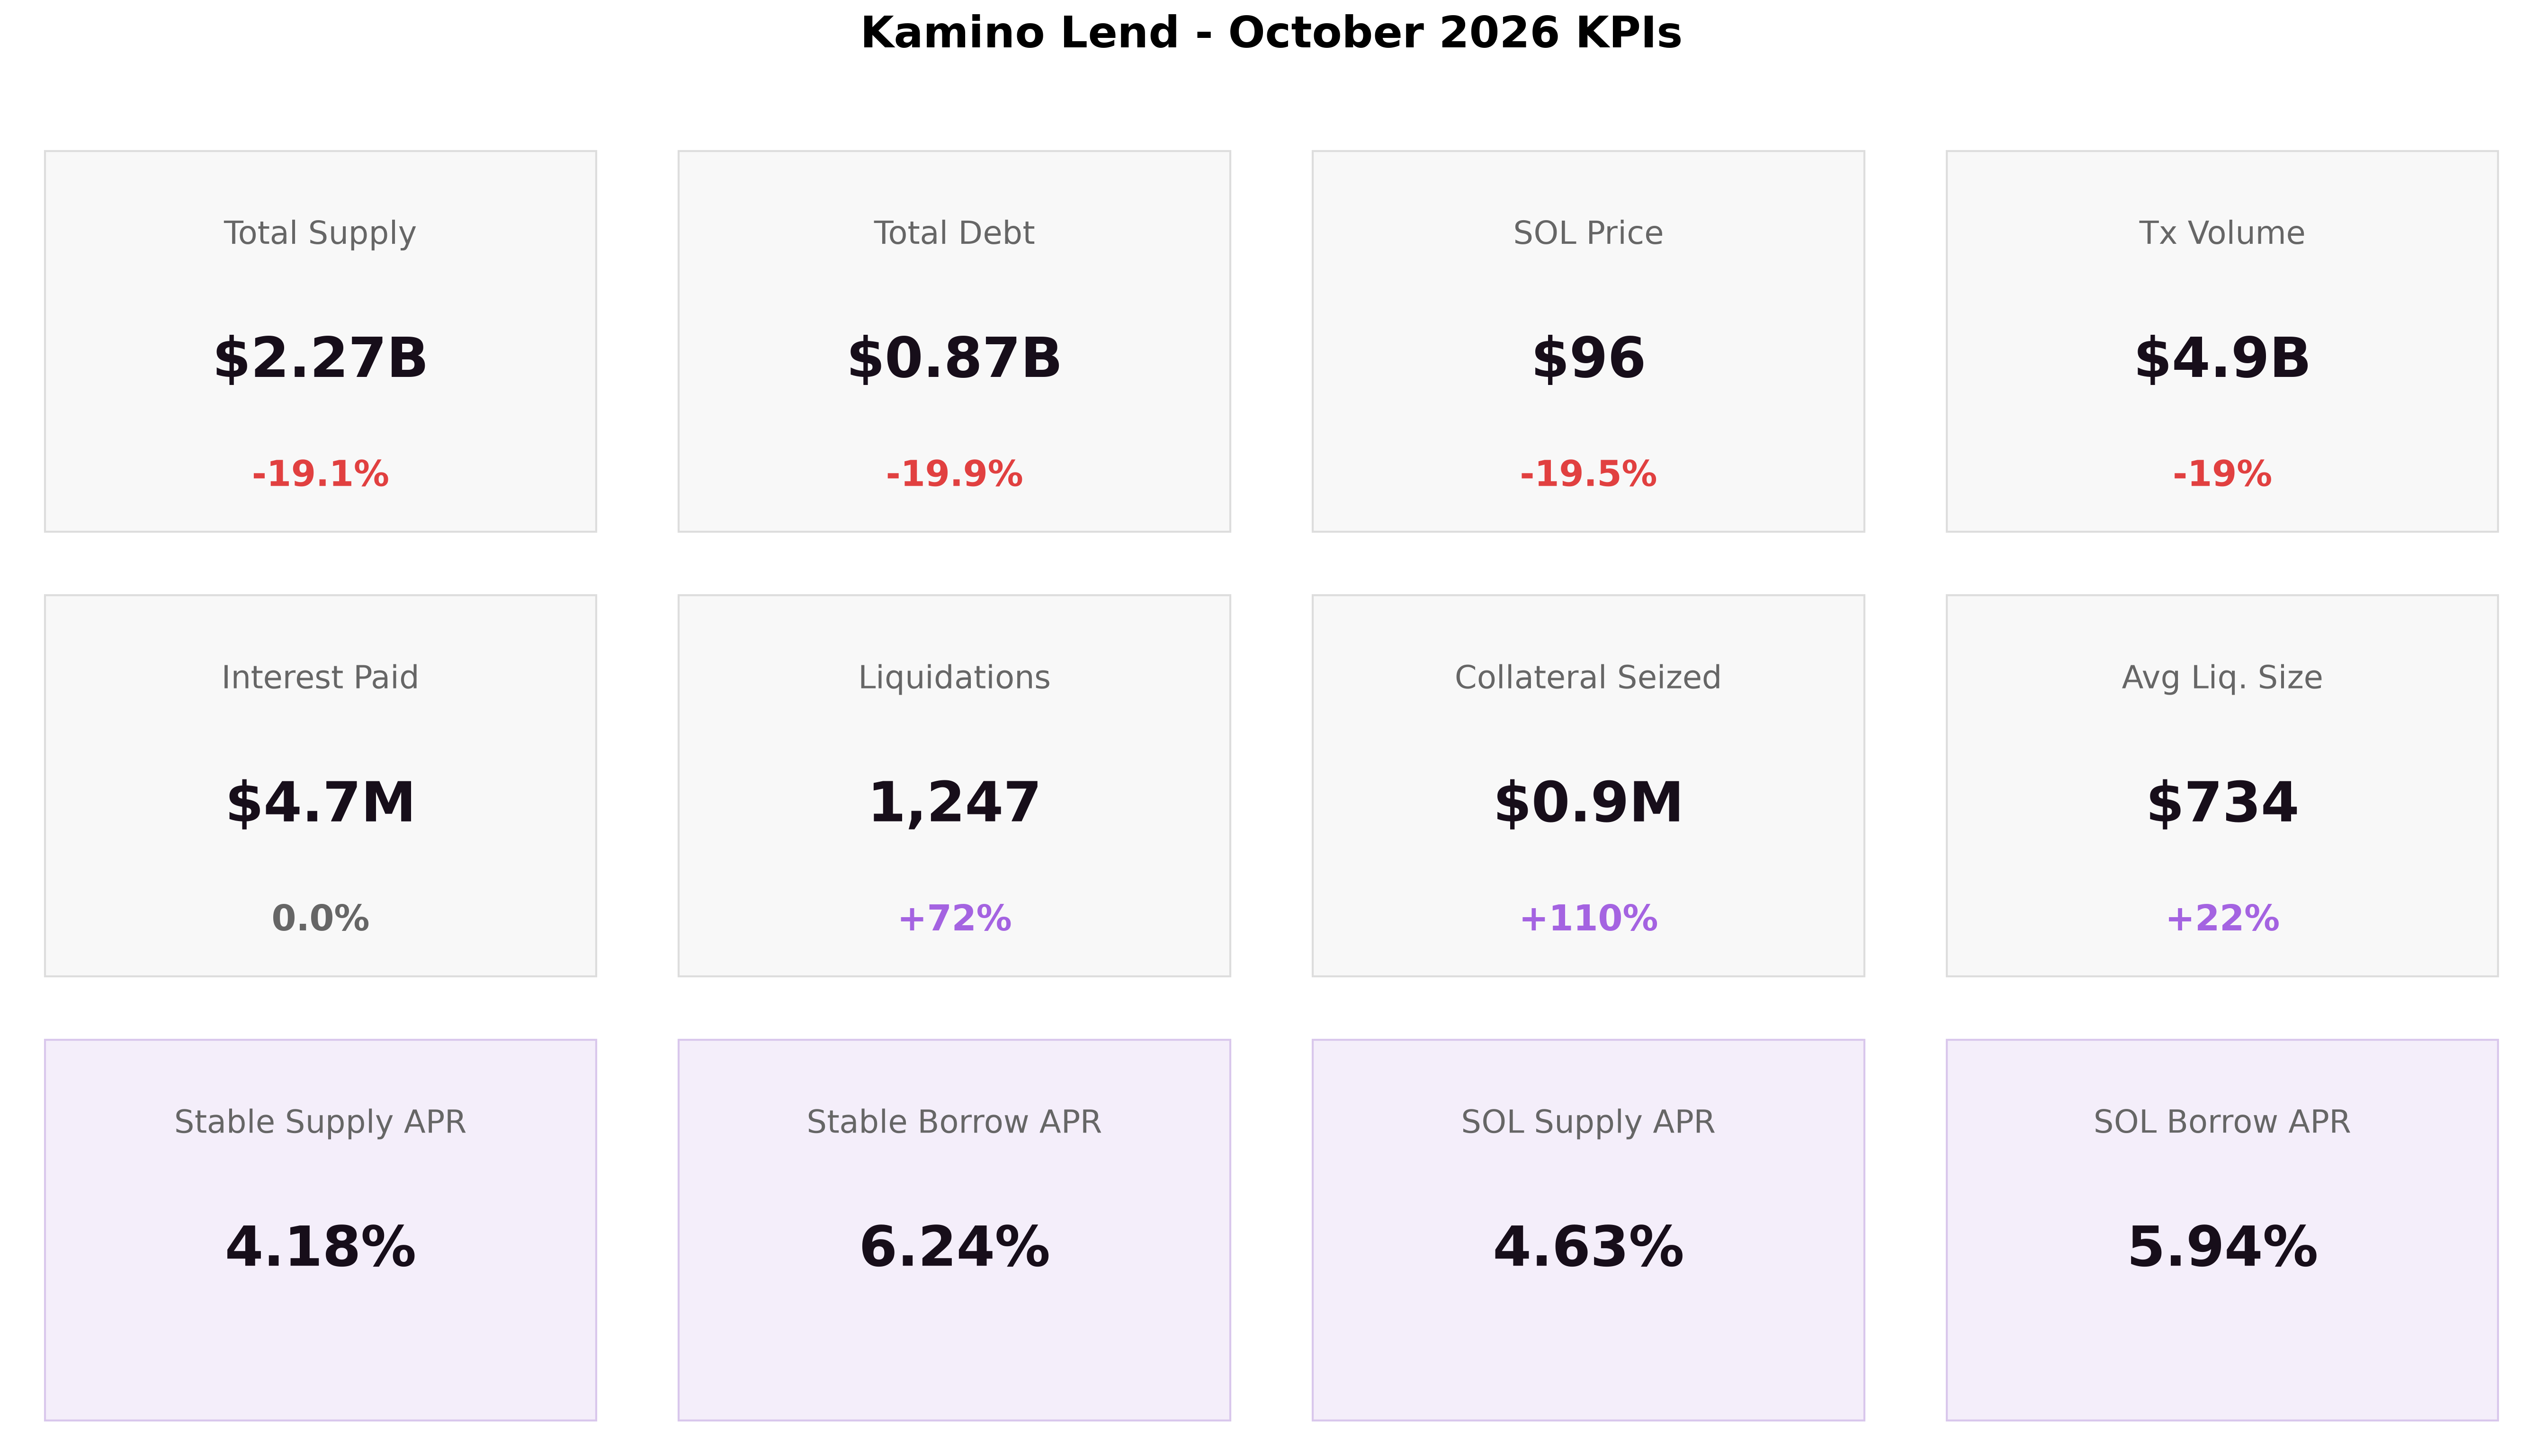
Fixed-rate borrowing kept growing through October. SOL fell 19.5% over the month, and the Ethena market unwound most of its positions.
-
Total Supply: $2.27B (-19.1% MoM vs $2.81B)
-
Total Debt: $0.87B (-19.9% MoM vs $1.09B)
-
SOL Price: $95.83 daily average on October 31 (-19.5% MoM)
-
Transaction Volume: $4.92B (-19.2% MoM)
-
Interest Paid: $4.73M (flat MoM, interest paid by borrowers)
-
Liquidations: 1,247 events (+72.0% MoM)
-
Collateral Seized: $915.2K (+109.8% MoM)
-
Average Liquidation Size: $734 (+21.9% MoM)
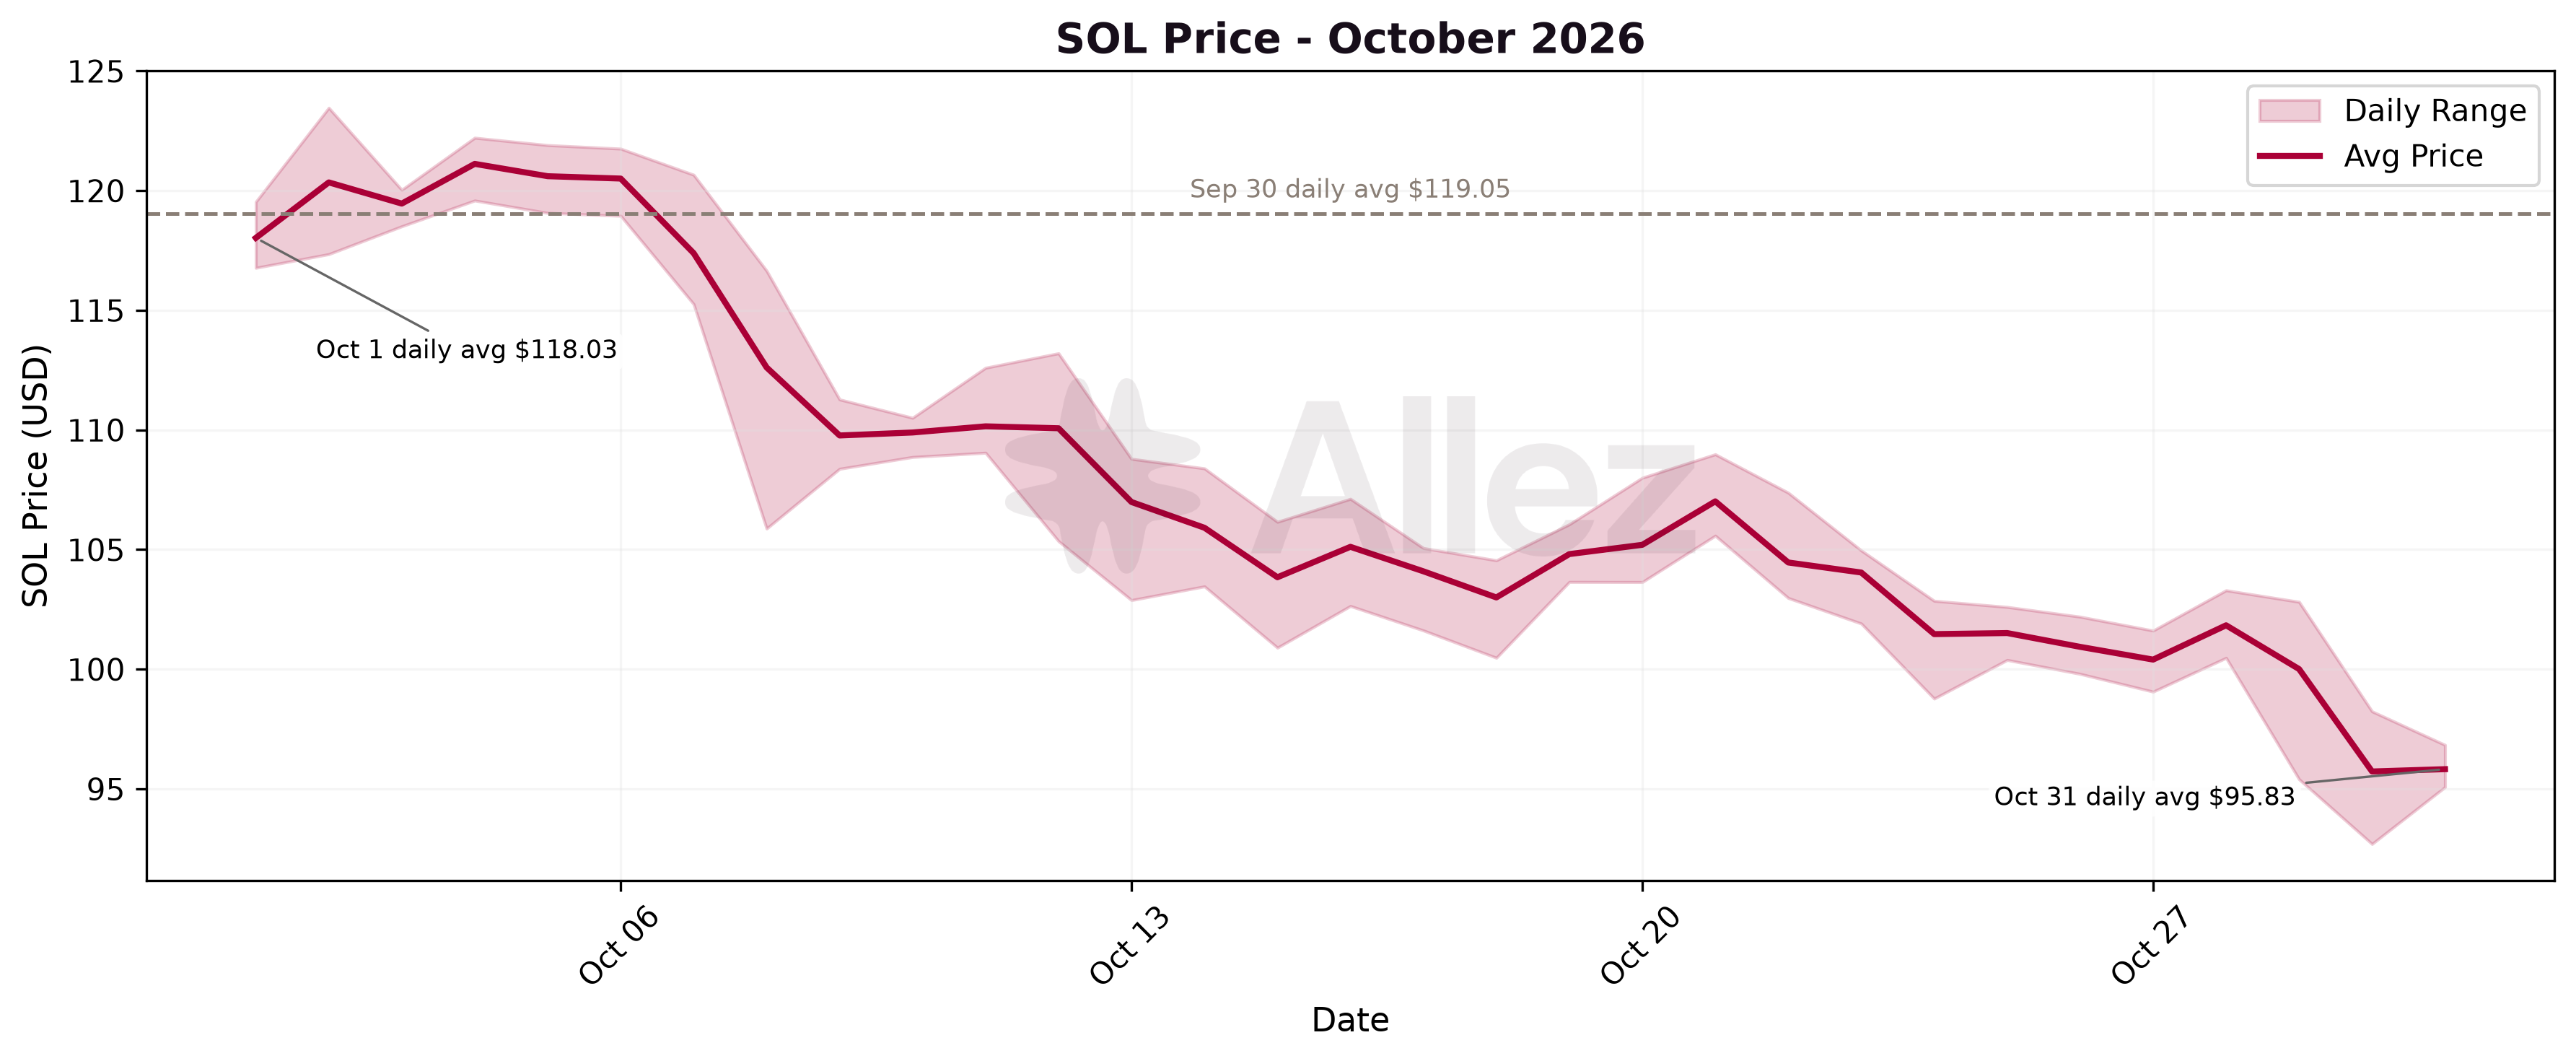
SOL peaked at $123.46 on October 2 and fell to a low of $92.70 on October 30. Its October 31 daily average was $95.83. Supply declined steadily from $2.78B on October 1 to $2.27B on October 31. Withdrawals exceeded deposits, at $1.87B against $1.74B, while borrow volume ($0.54B) and repay volume ($0.76B) both rose from September.
Kamino Ecosystem Updates:
-
Fixed Rates passed $75M of active loans (Oct 31), after more than $12M of loans renewed into new 30-day terms through Auto Rollover (Oct 23).
-
AUTO Fixed Rate Multiply opened $7.5M of additional capacity, with leverage up to 4.5x (Oct 14).
-
OnRe market passed $10M of active fixed-rate loans (Oct 29).
-
Backpack market live, curated by Allez Labs, with Backpack Securities tokenized equities (MU, SKHY, SPCX, SNDK) as collateral to borrow USDC (Oct 28).
-
Upshift Gamma USDC vault live, curated by Gamma Research, lending and looping across Kamino RWA markets (Oct 15).
-
Confidential SOL Yield live on NEAR, a Kamino vault curated by Gauntlet (Oct 15).
-
Chainlink CCIP assets can qualify for higher caps and LTVs following a security review (Oct 20).
2. Macro View: Liquidity by Category
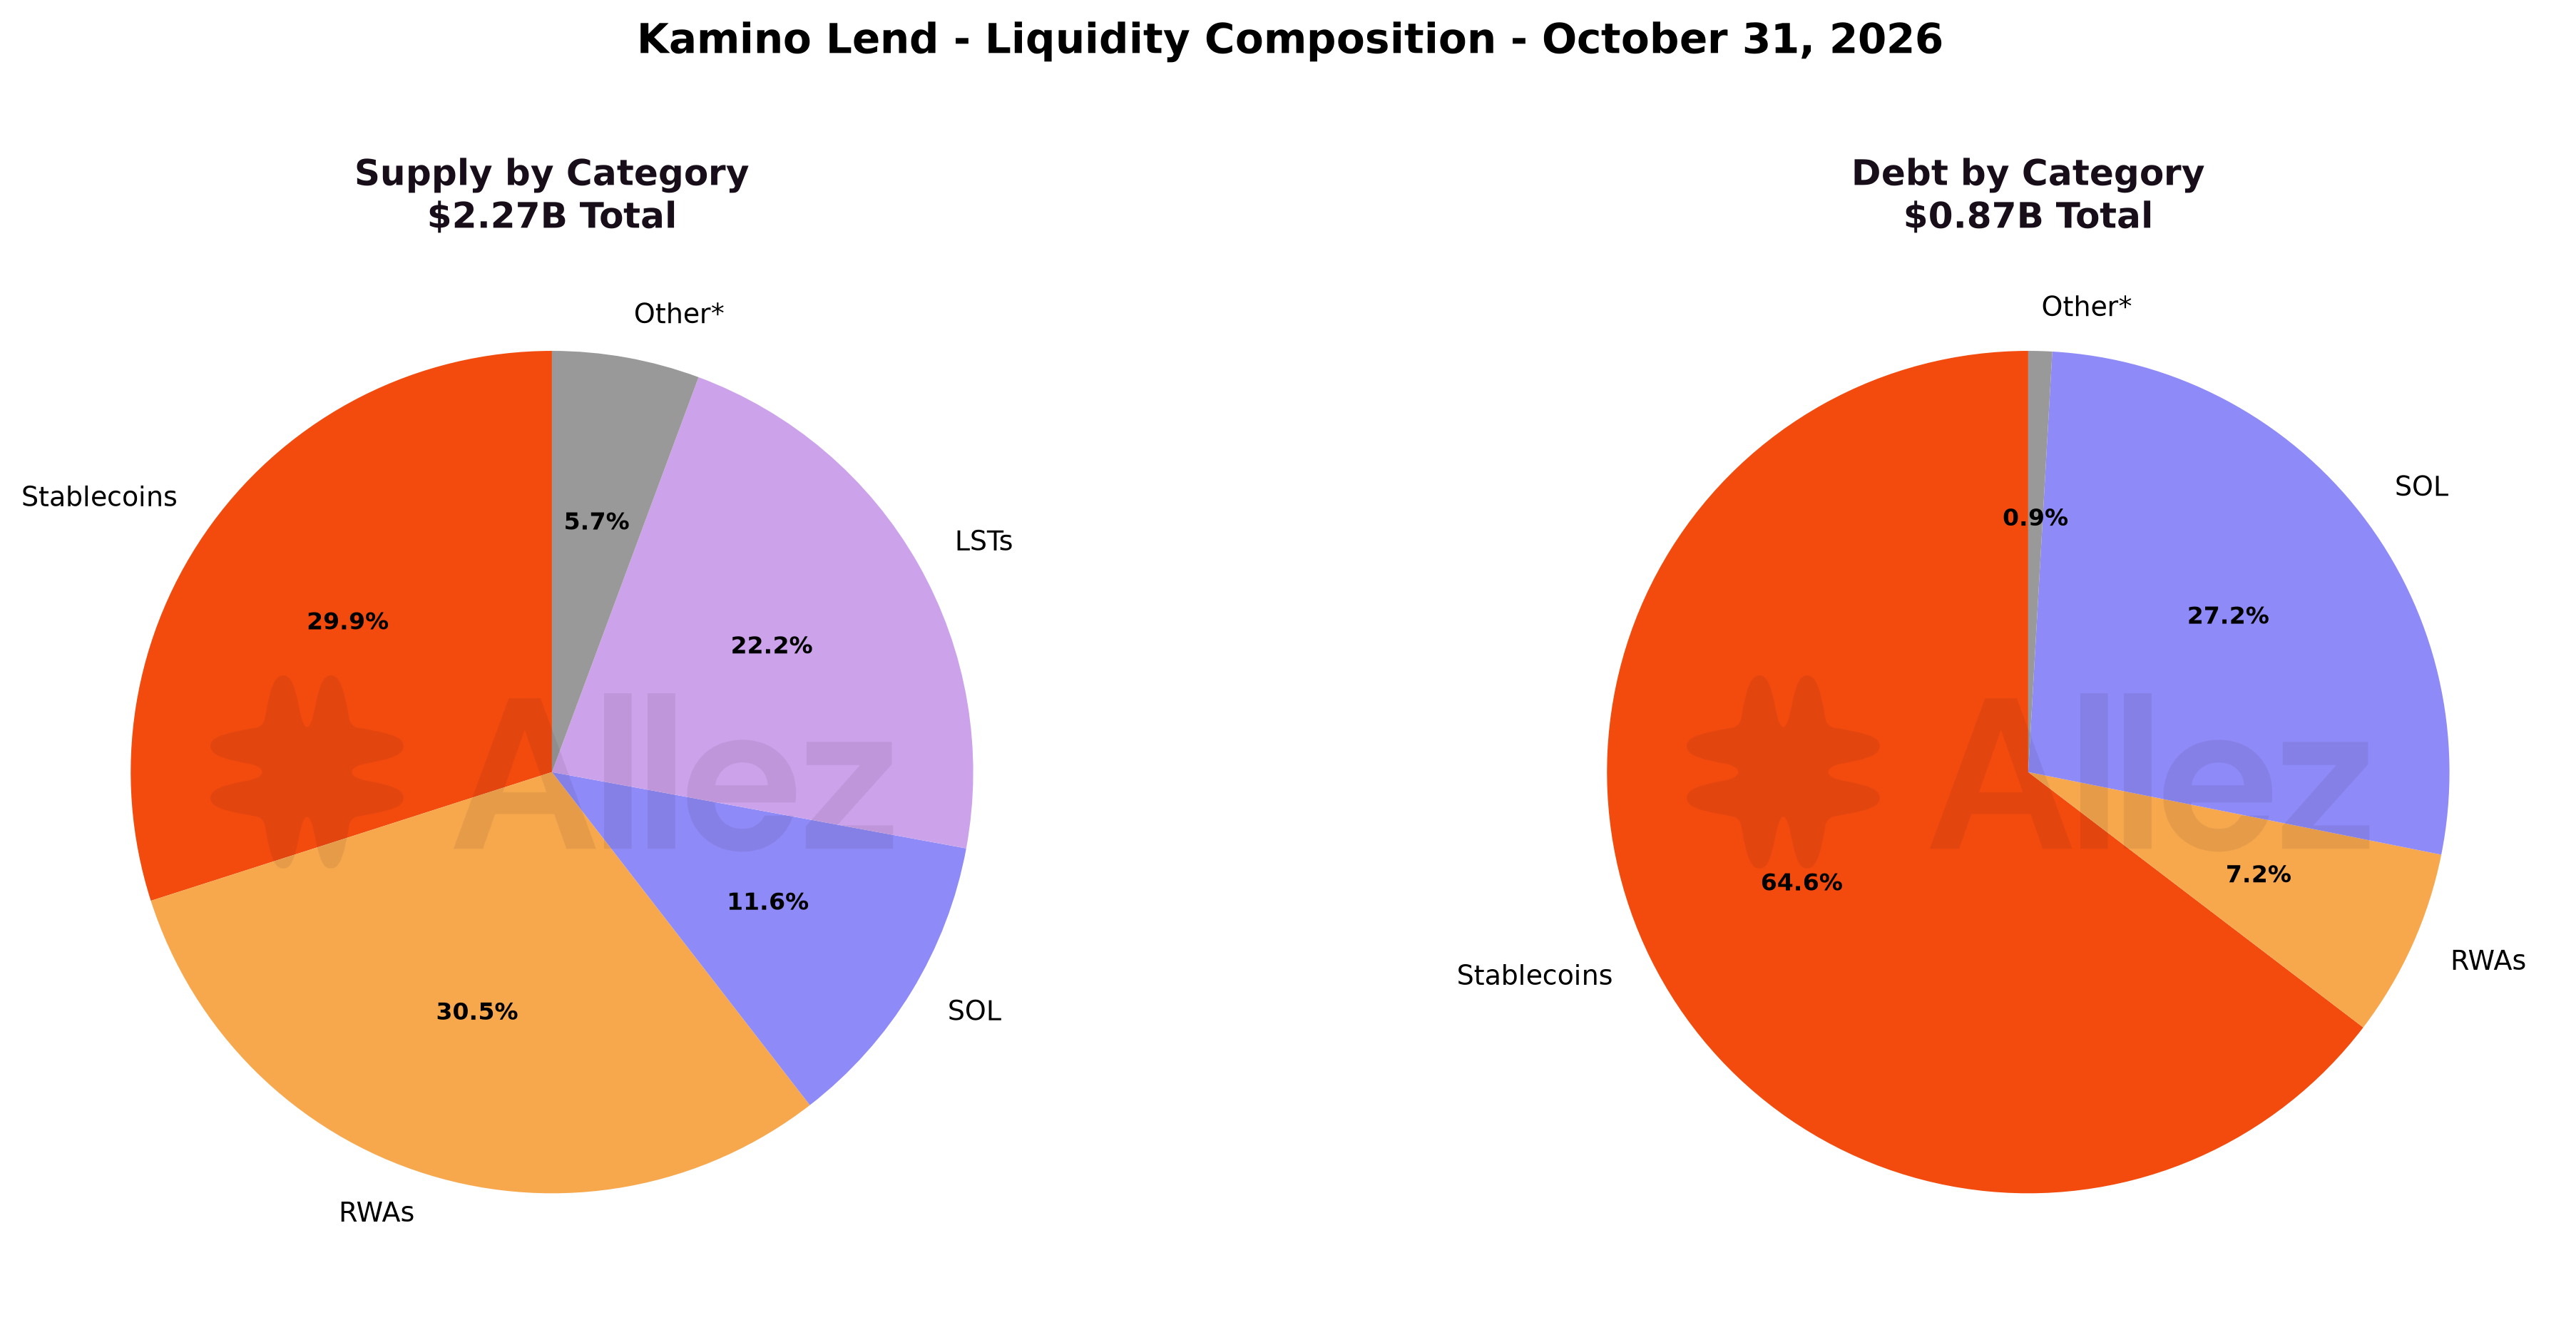
Real-world assets were the only category to grow in October, rising to 30.5% of supply from 23.4% and overtaking stablecoins (29.9%, down from 38.6%) as the largest category. SOL and LSTs together hold 33.9%.
| Category | Supply | Share | Supply MoM | Debt | Debt MoM |
|---|---|---|---|---|---|
| RWAs | $694.6M | 30.5% | +5.6% | $62.9M | +216.1% |
| Stablecoins | $680.9M | 29.9% | -37.3% | $562.9M | -27.2% |
| LSTs | $505.8M | 22.2% | -15.9% | $2.3M | -19.9% |
| SOL | $264.1M | 11.6% | -15.6% | $237.1M | -17.6% |
| BTC | $68.0M | 3.0% | -21.6% | $1.6M | -17.2% |
| Other | $60.6M | 2.7% | -8.5% | $4.0M | +416.9% |
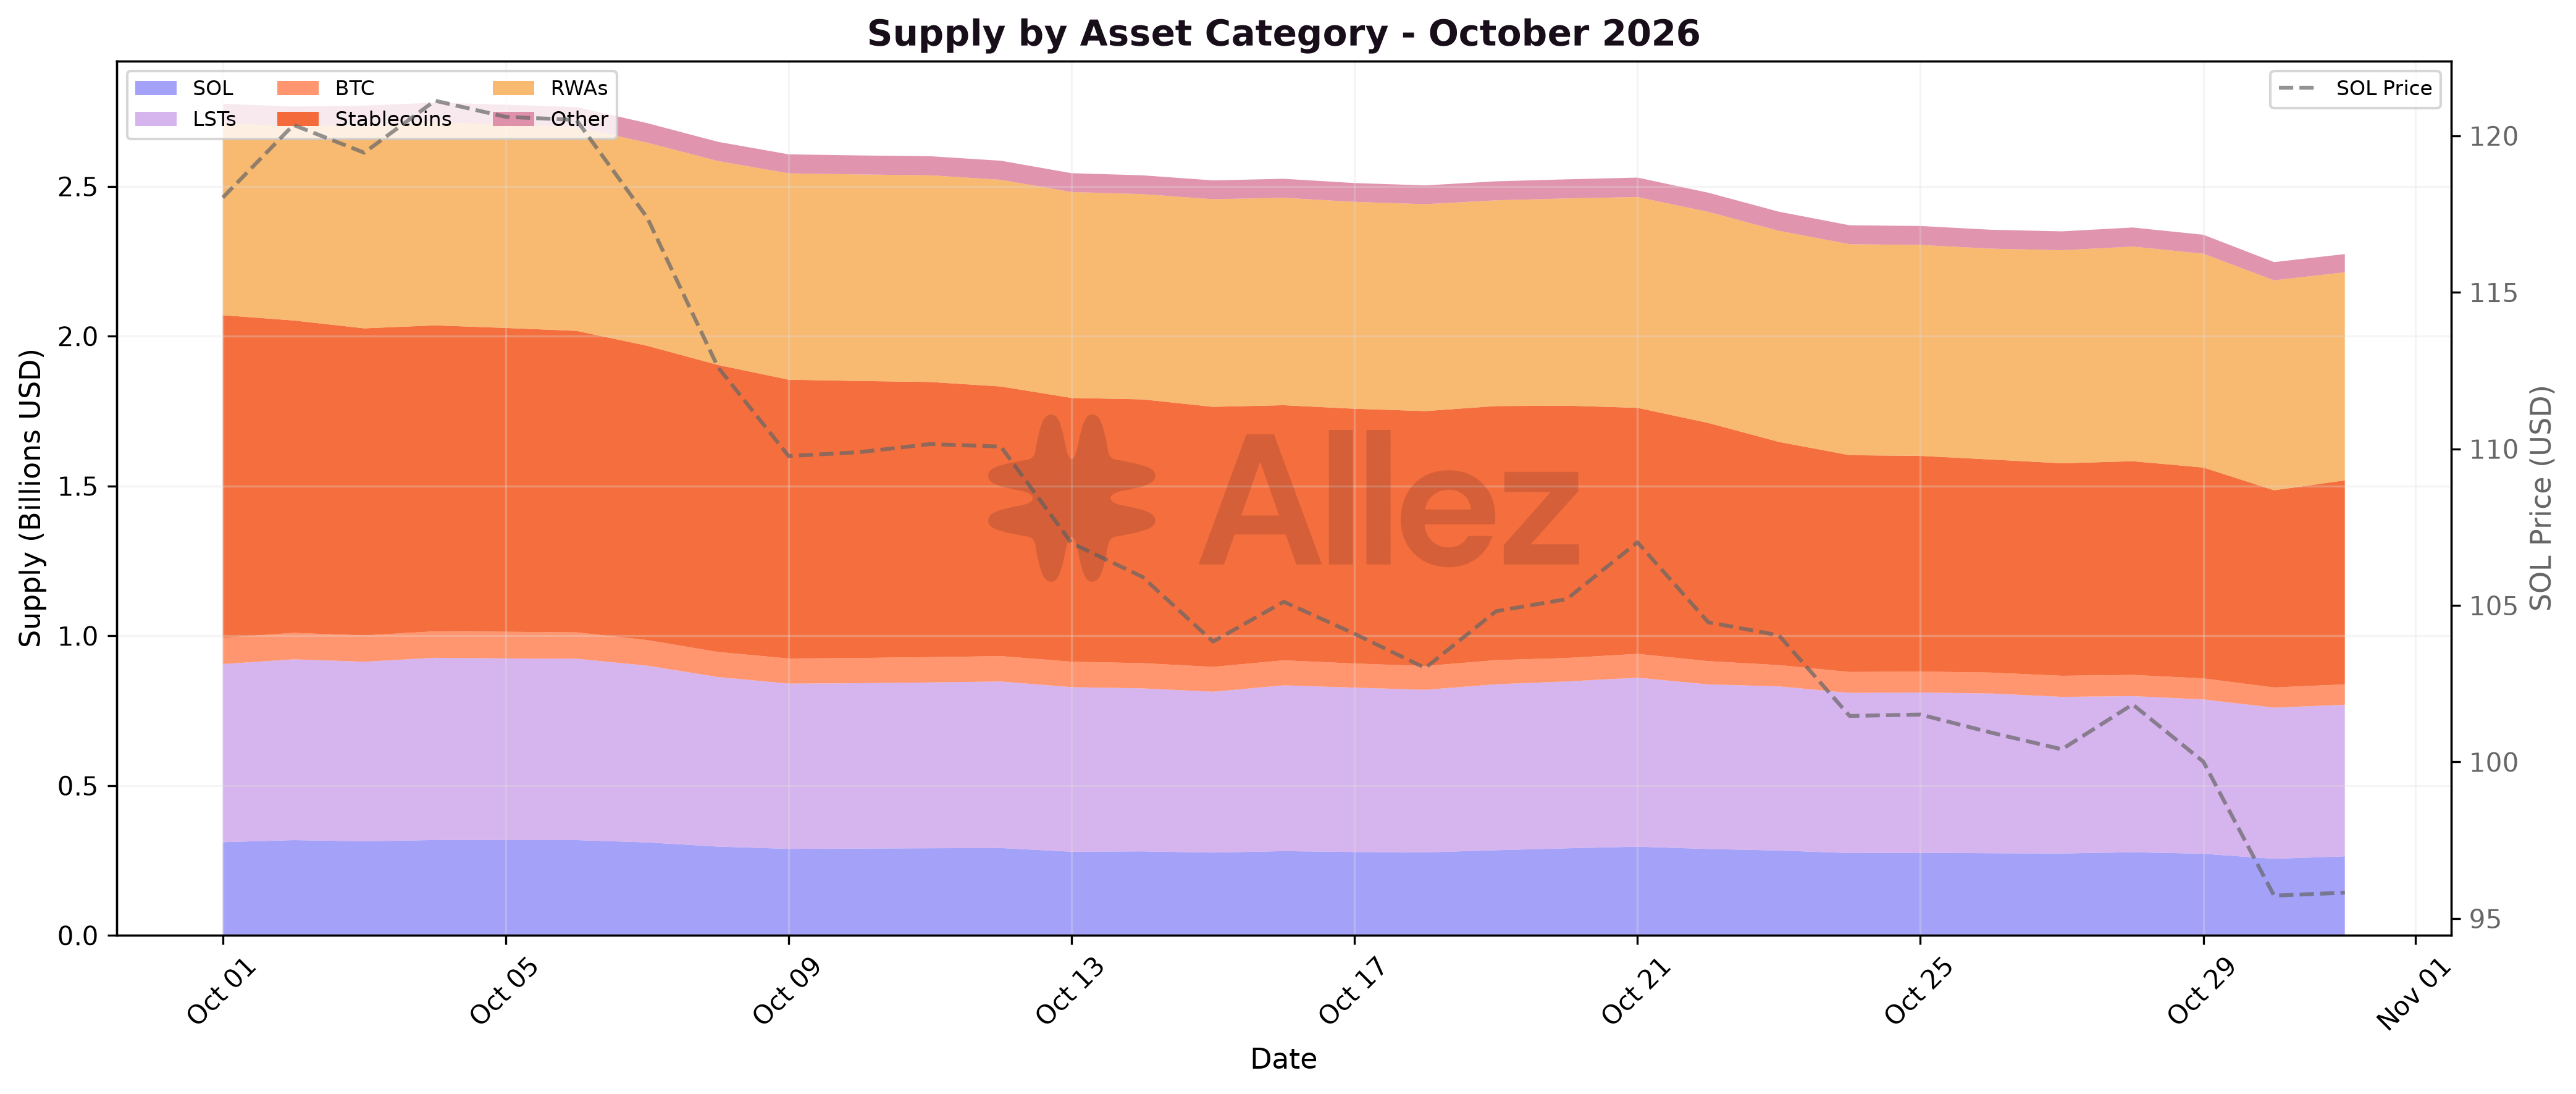
Stablecoin supply fell through the month, while RWA balances grew steadily with the AUTO market.
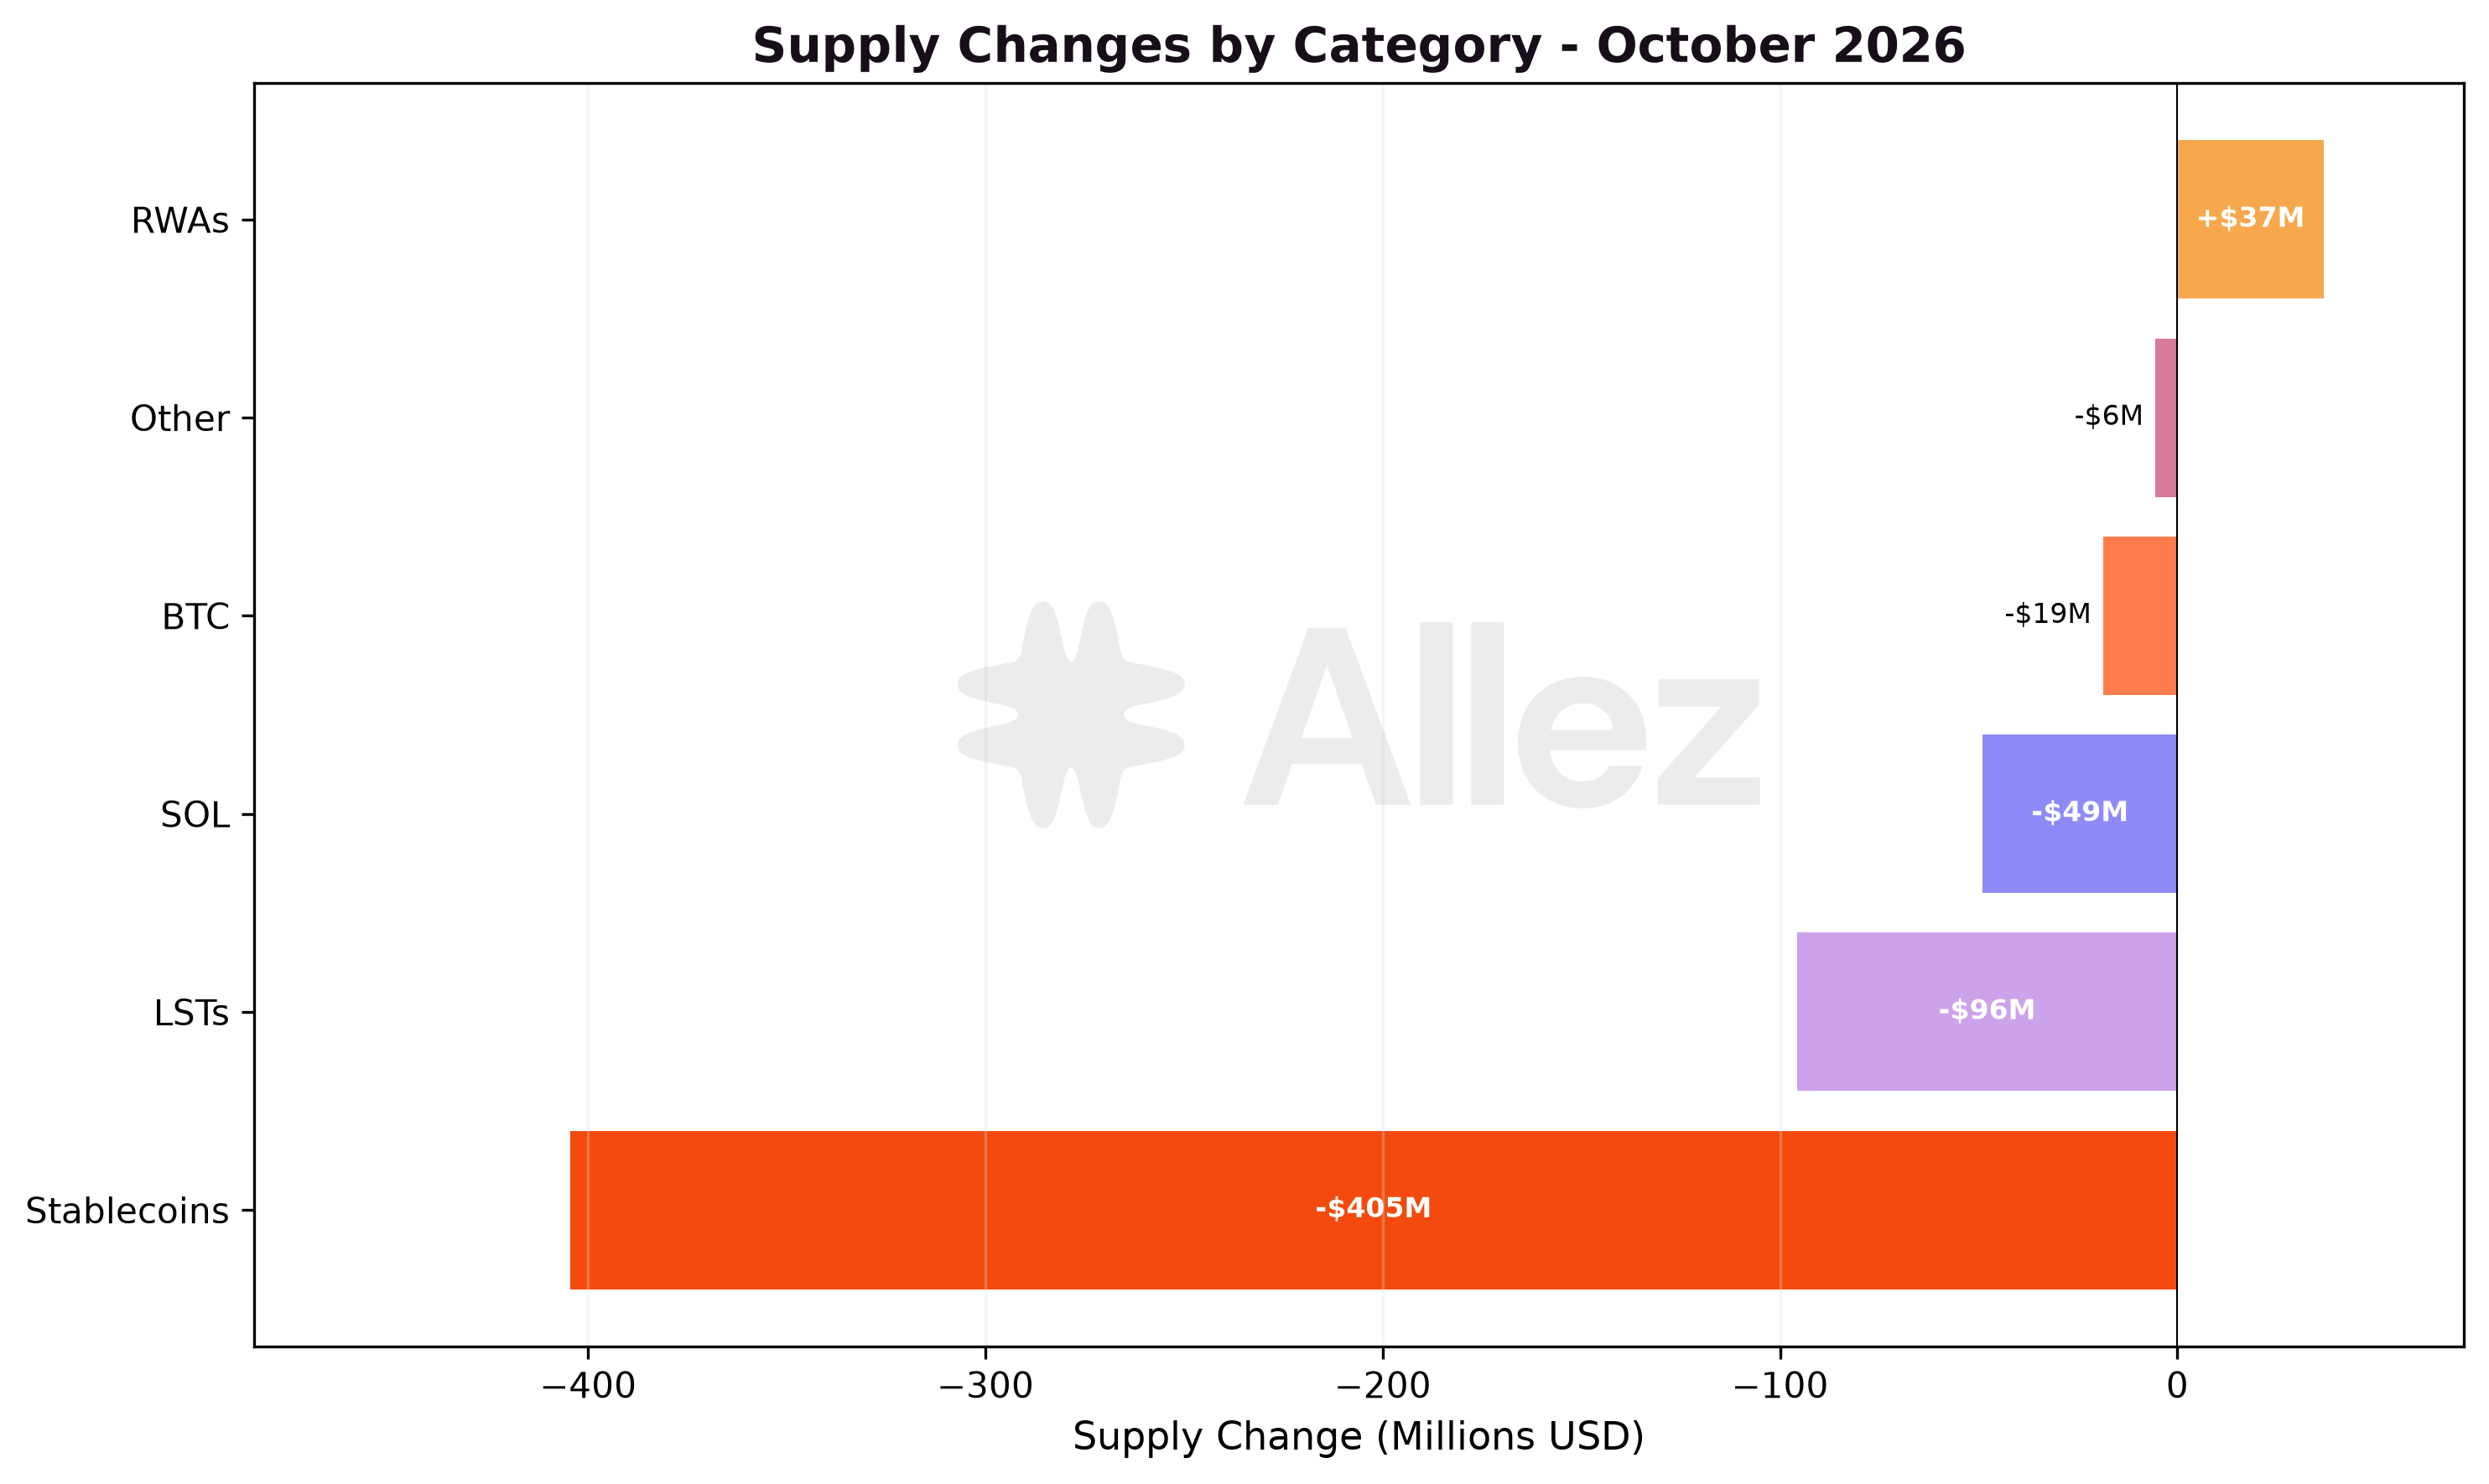
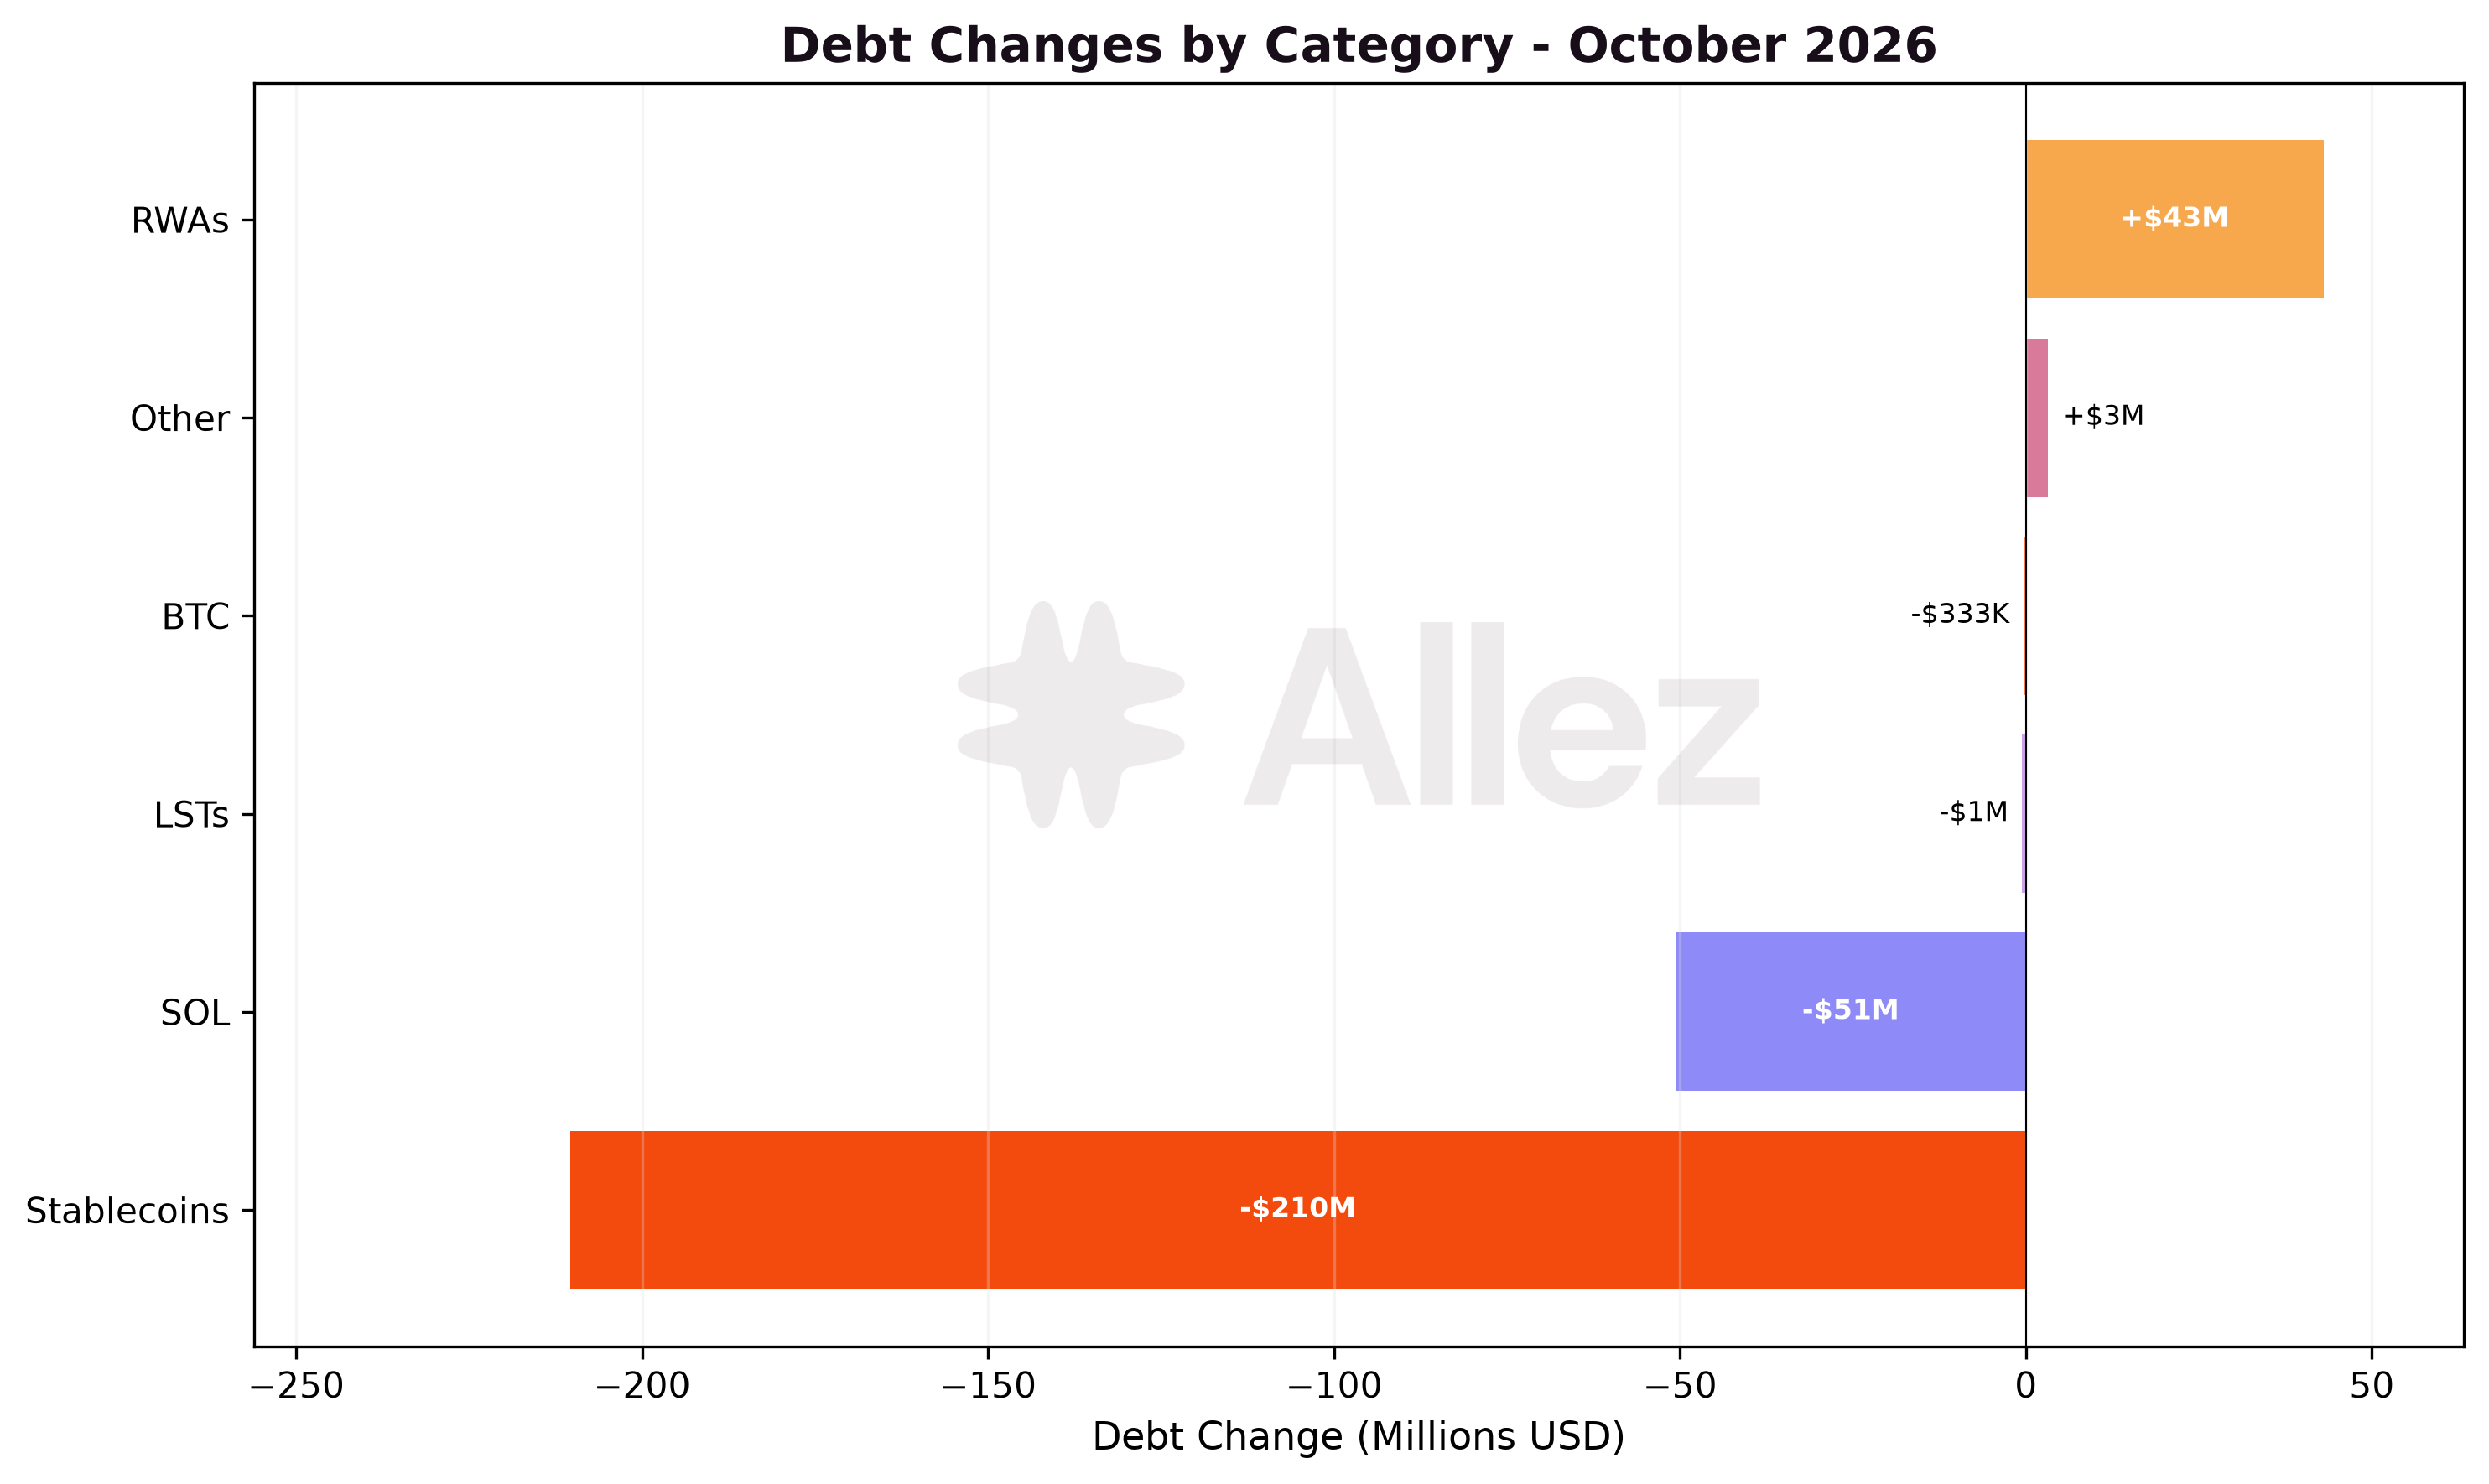
Stablecoins declined $404.6M (-37.3%), mostly in the Ethena market. Ethena ended its USDe token incentives at the end of September, and the market unwound through October: USDe supply fell $188.8M and PYUSD $191.5M. Stablecoin debt fell less (-27.2%), lifting stablecoin utilization from 71.2% to 82.7%. The rise comes from the exit of USDe collateral that was not lent out. Utilization on the largest USDC and PYUSD reserves eased or held steady.
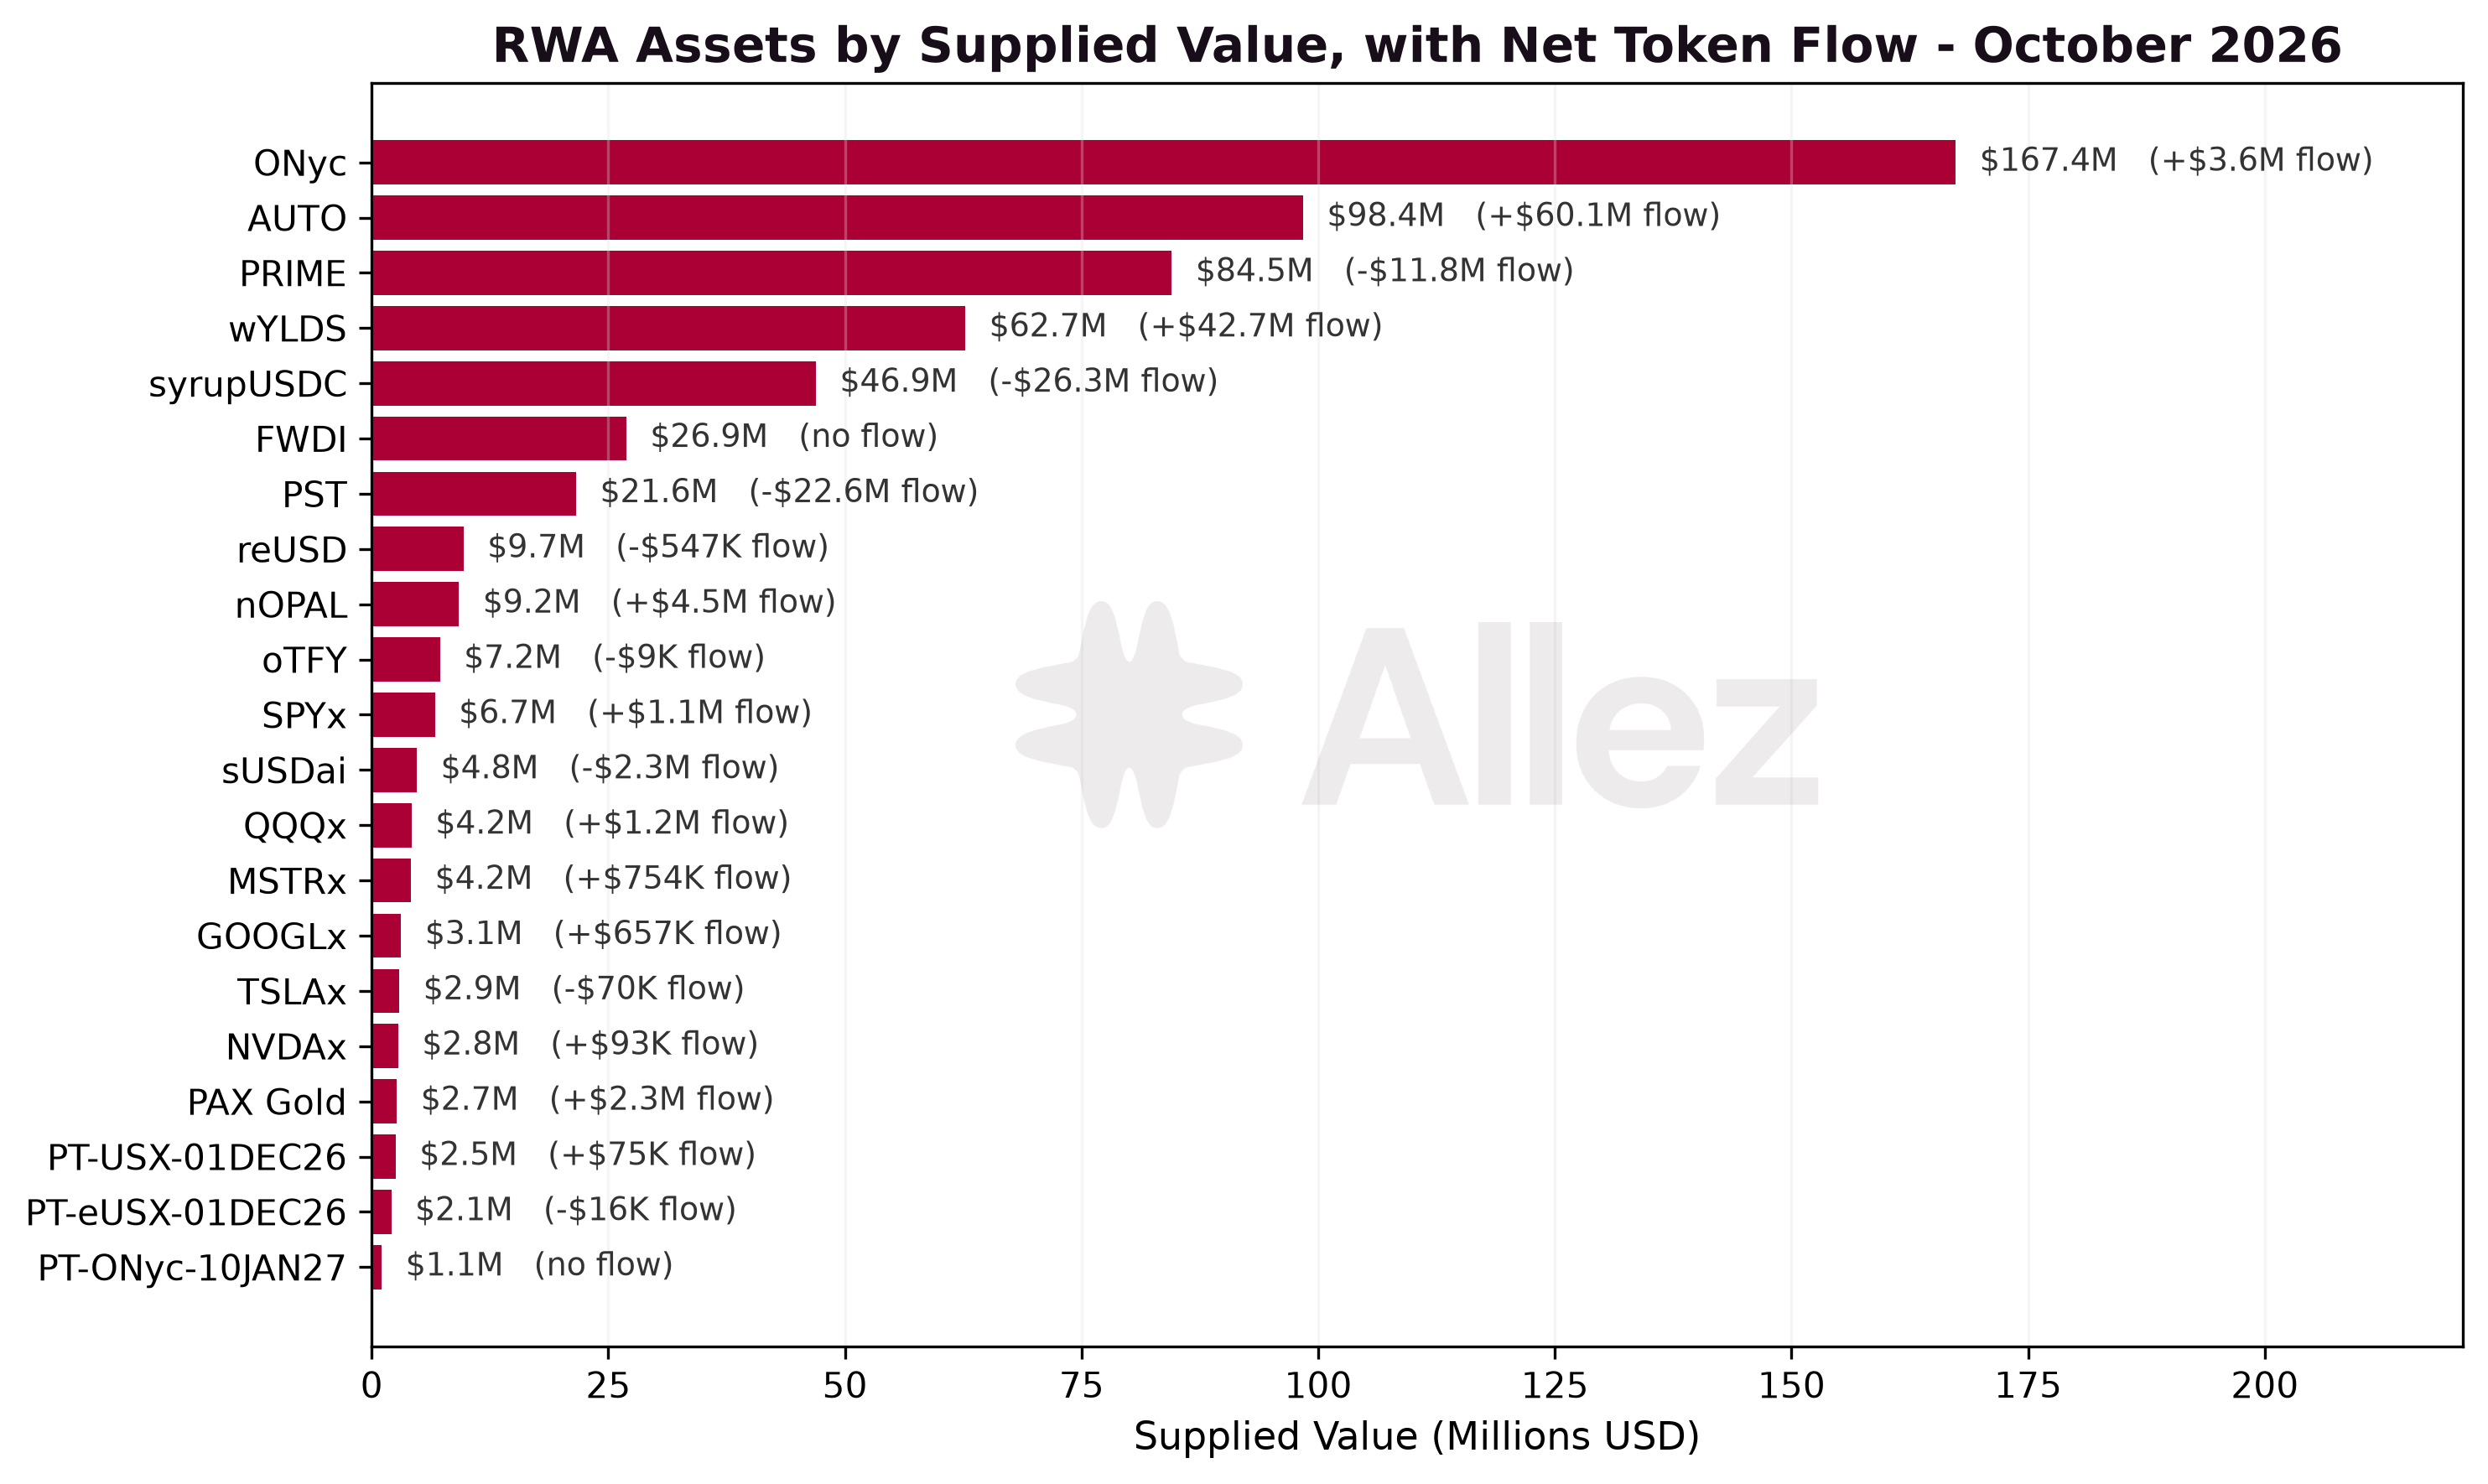
RWAs added $36.8M (+5.6%), led by AUTO and wYLDS, partly offset by syrupUSDC, PST and PRIME outflows. RWA debt tripled to $62.9M, almost all wYLDS borrowed at a fixed rate against AUTO.
SOL, LSTs and BTC declined mainly with prices. Measured in tokens, SOL deposits grew over the month and LST balances rose about 4%.
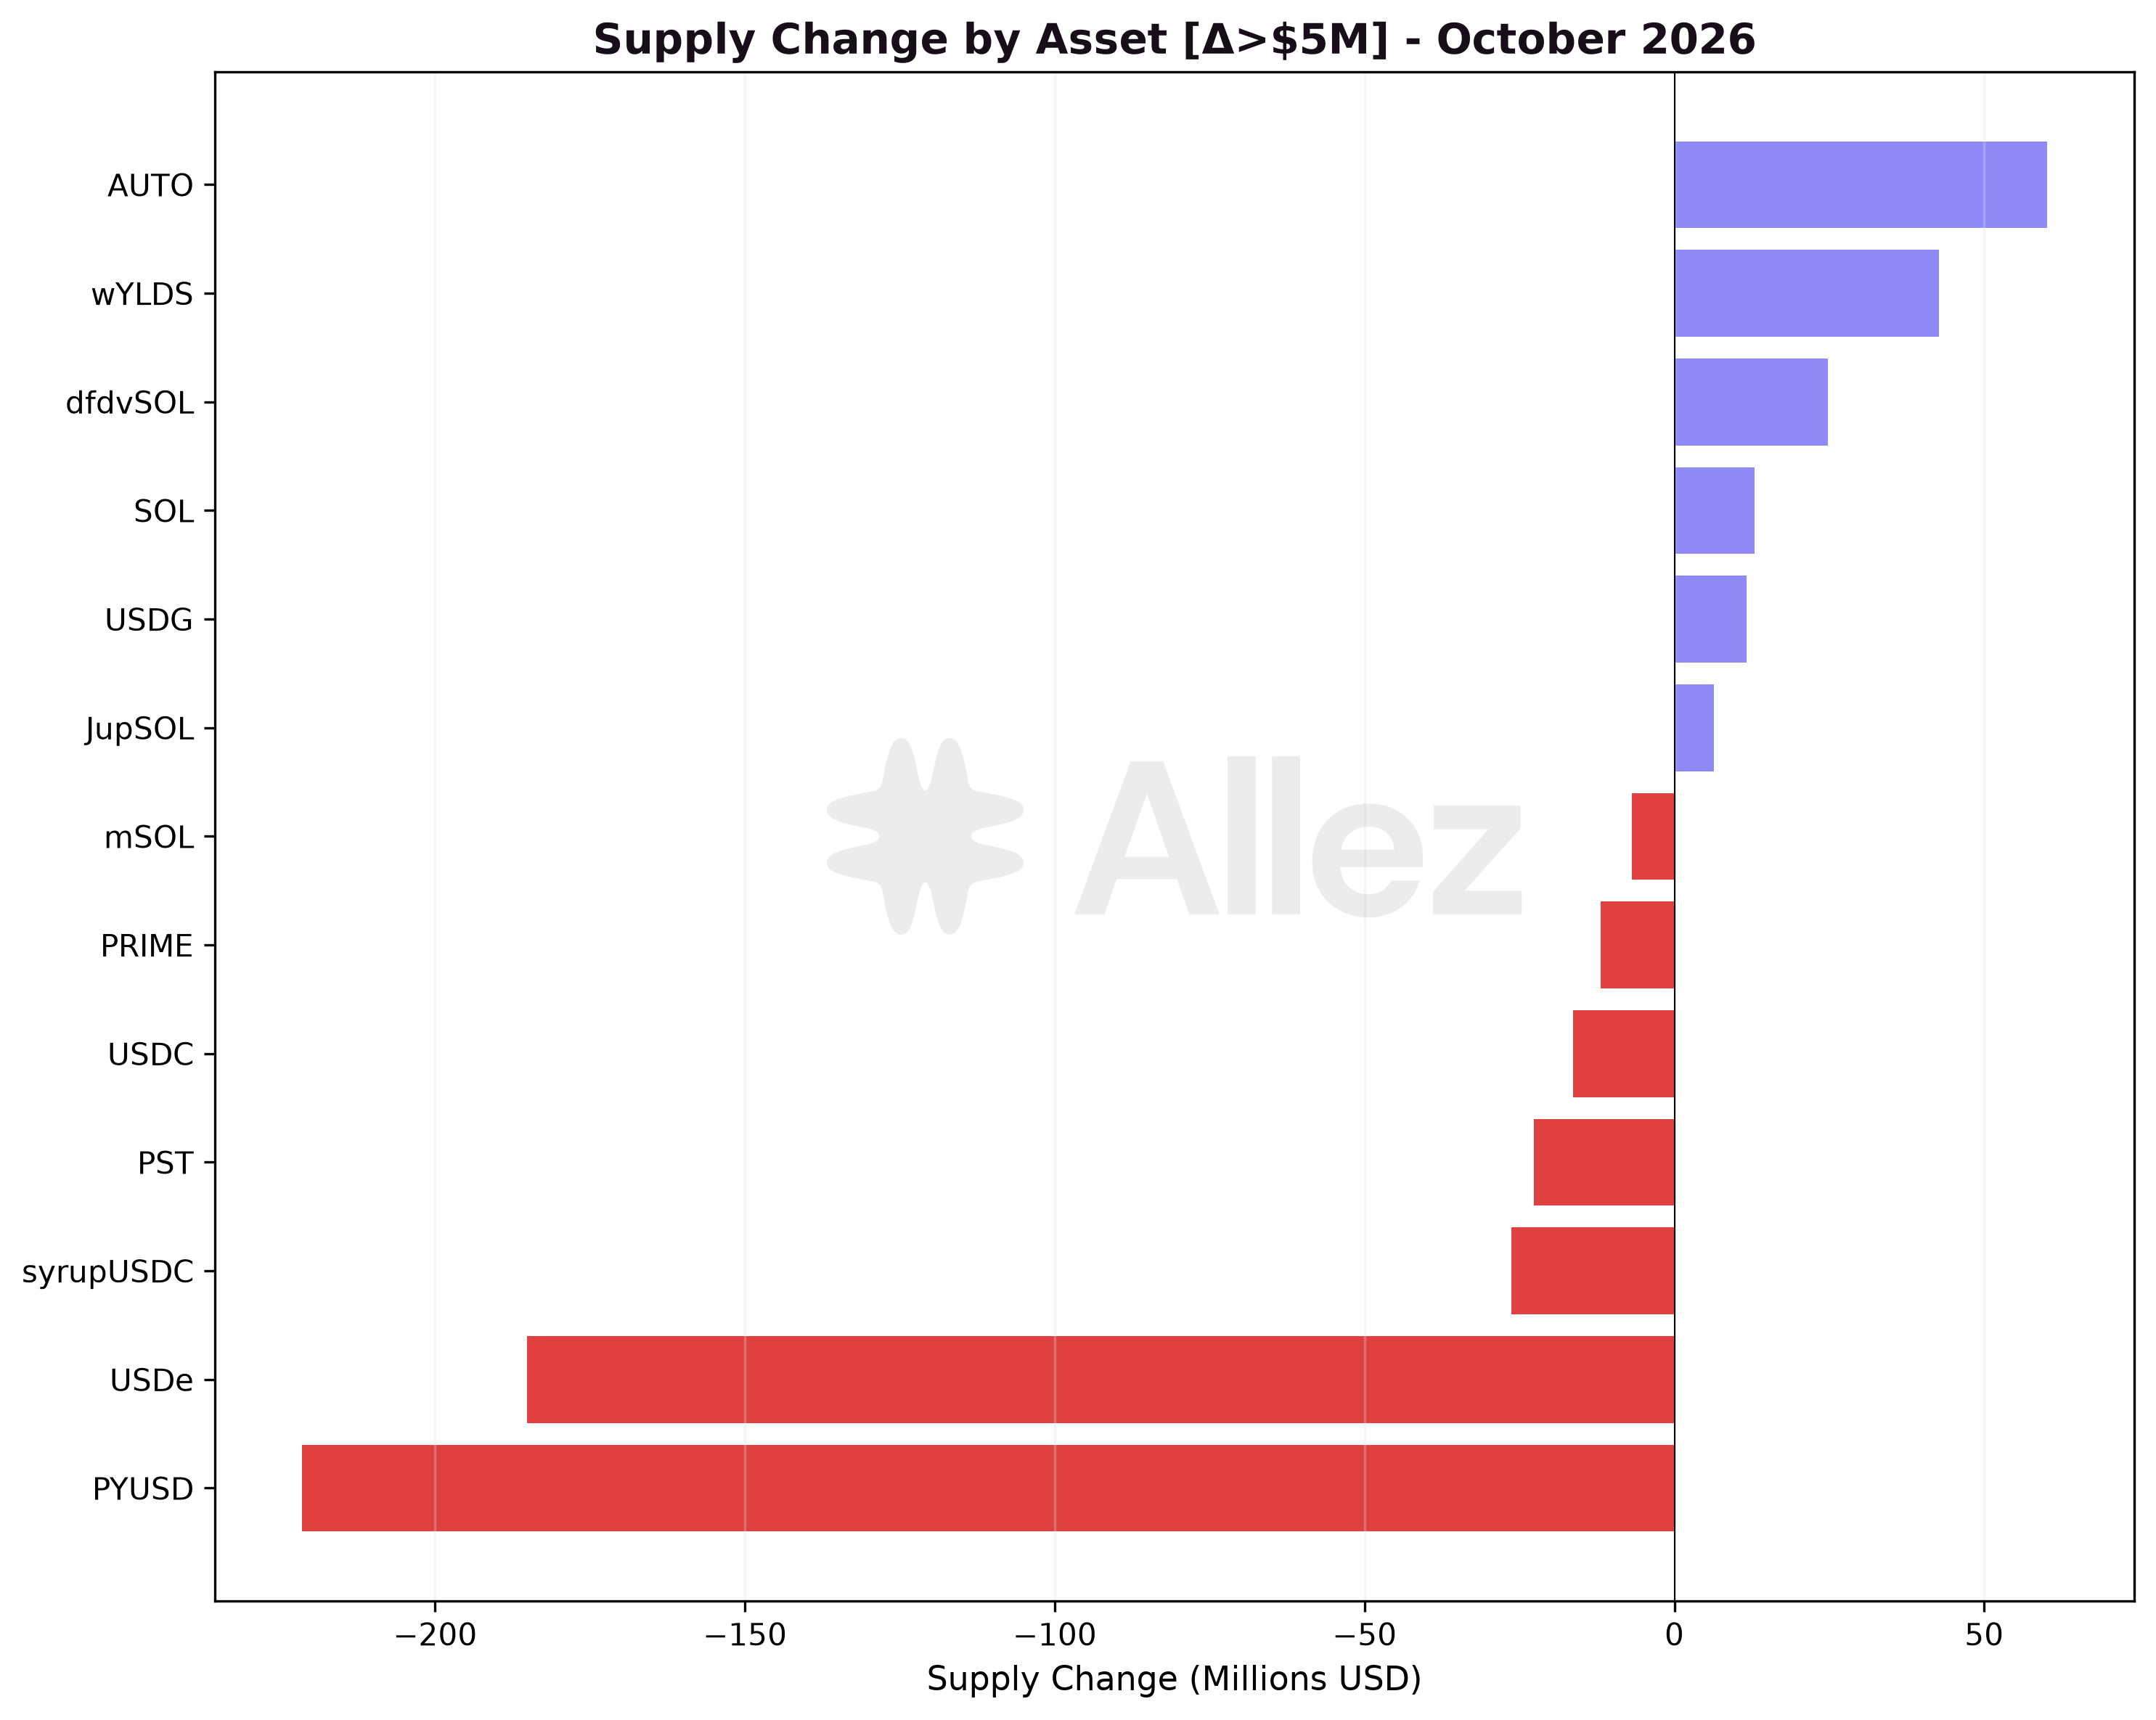
Major Inflows: AUTO (+$60.1M), wYLDS (+$42.7M), dfdvSOL (+$24.8M), SOL (+$13.0M), USDG (+$11.6M).
Major Outflows: PYUSD (-$221.5M), USDe (-$185.1M), syrupUSDC (-$26.3M), PST (-$22.6M), USDC (-$16.4M).
AUTO supply rose alongside fixed-rate wYLDS borrowing against AUTO. dfdvSOL extended its inflow for a third month, reaching $63.5M.
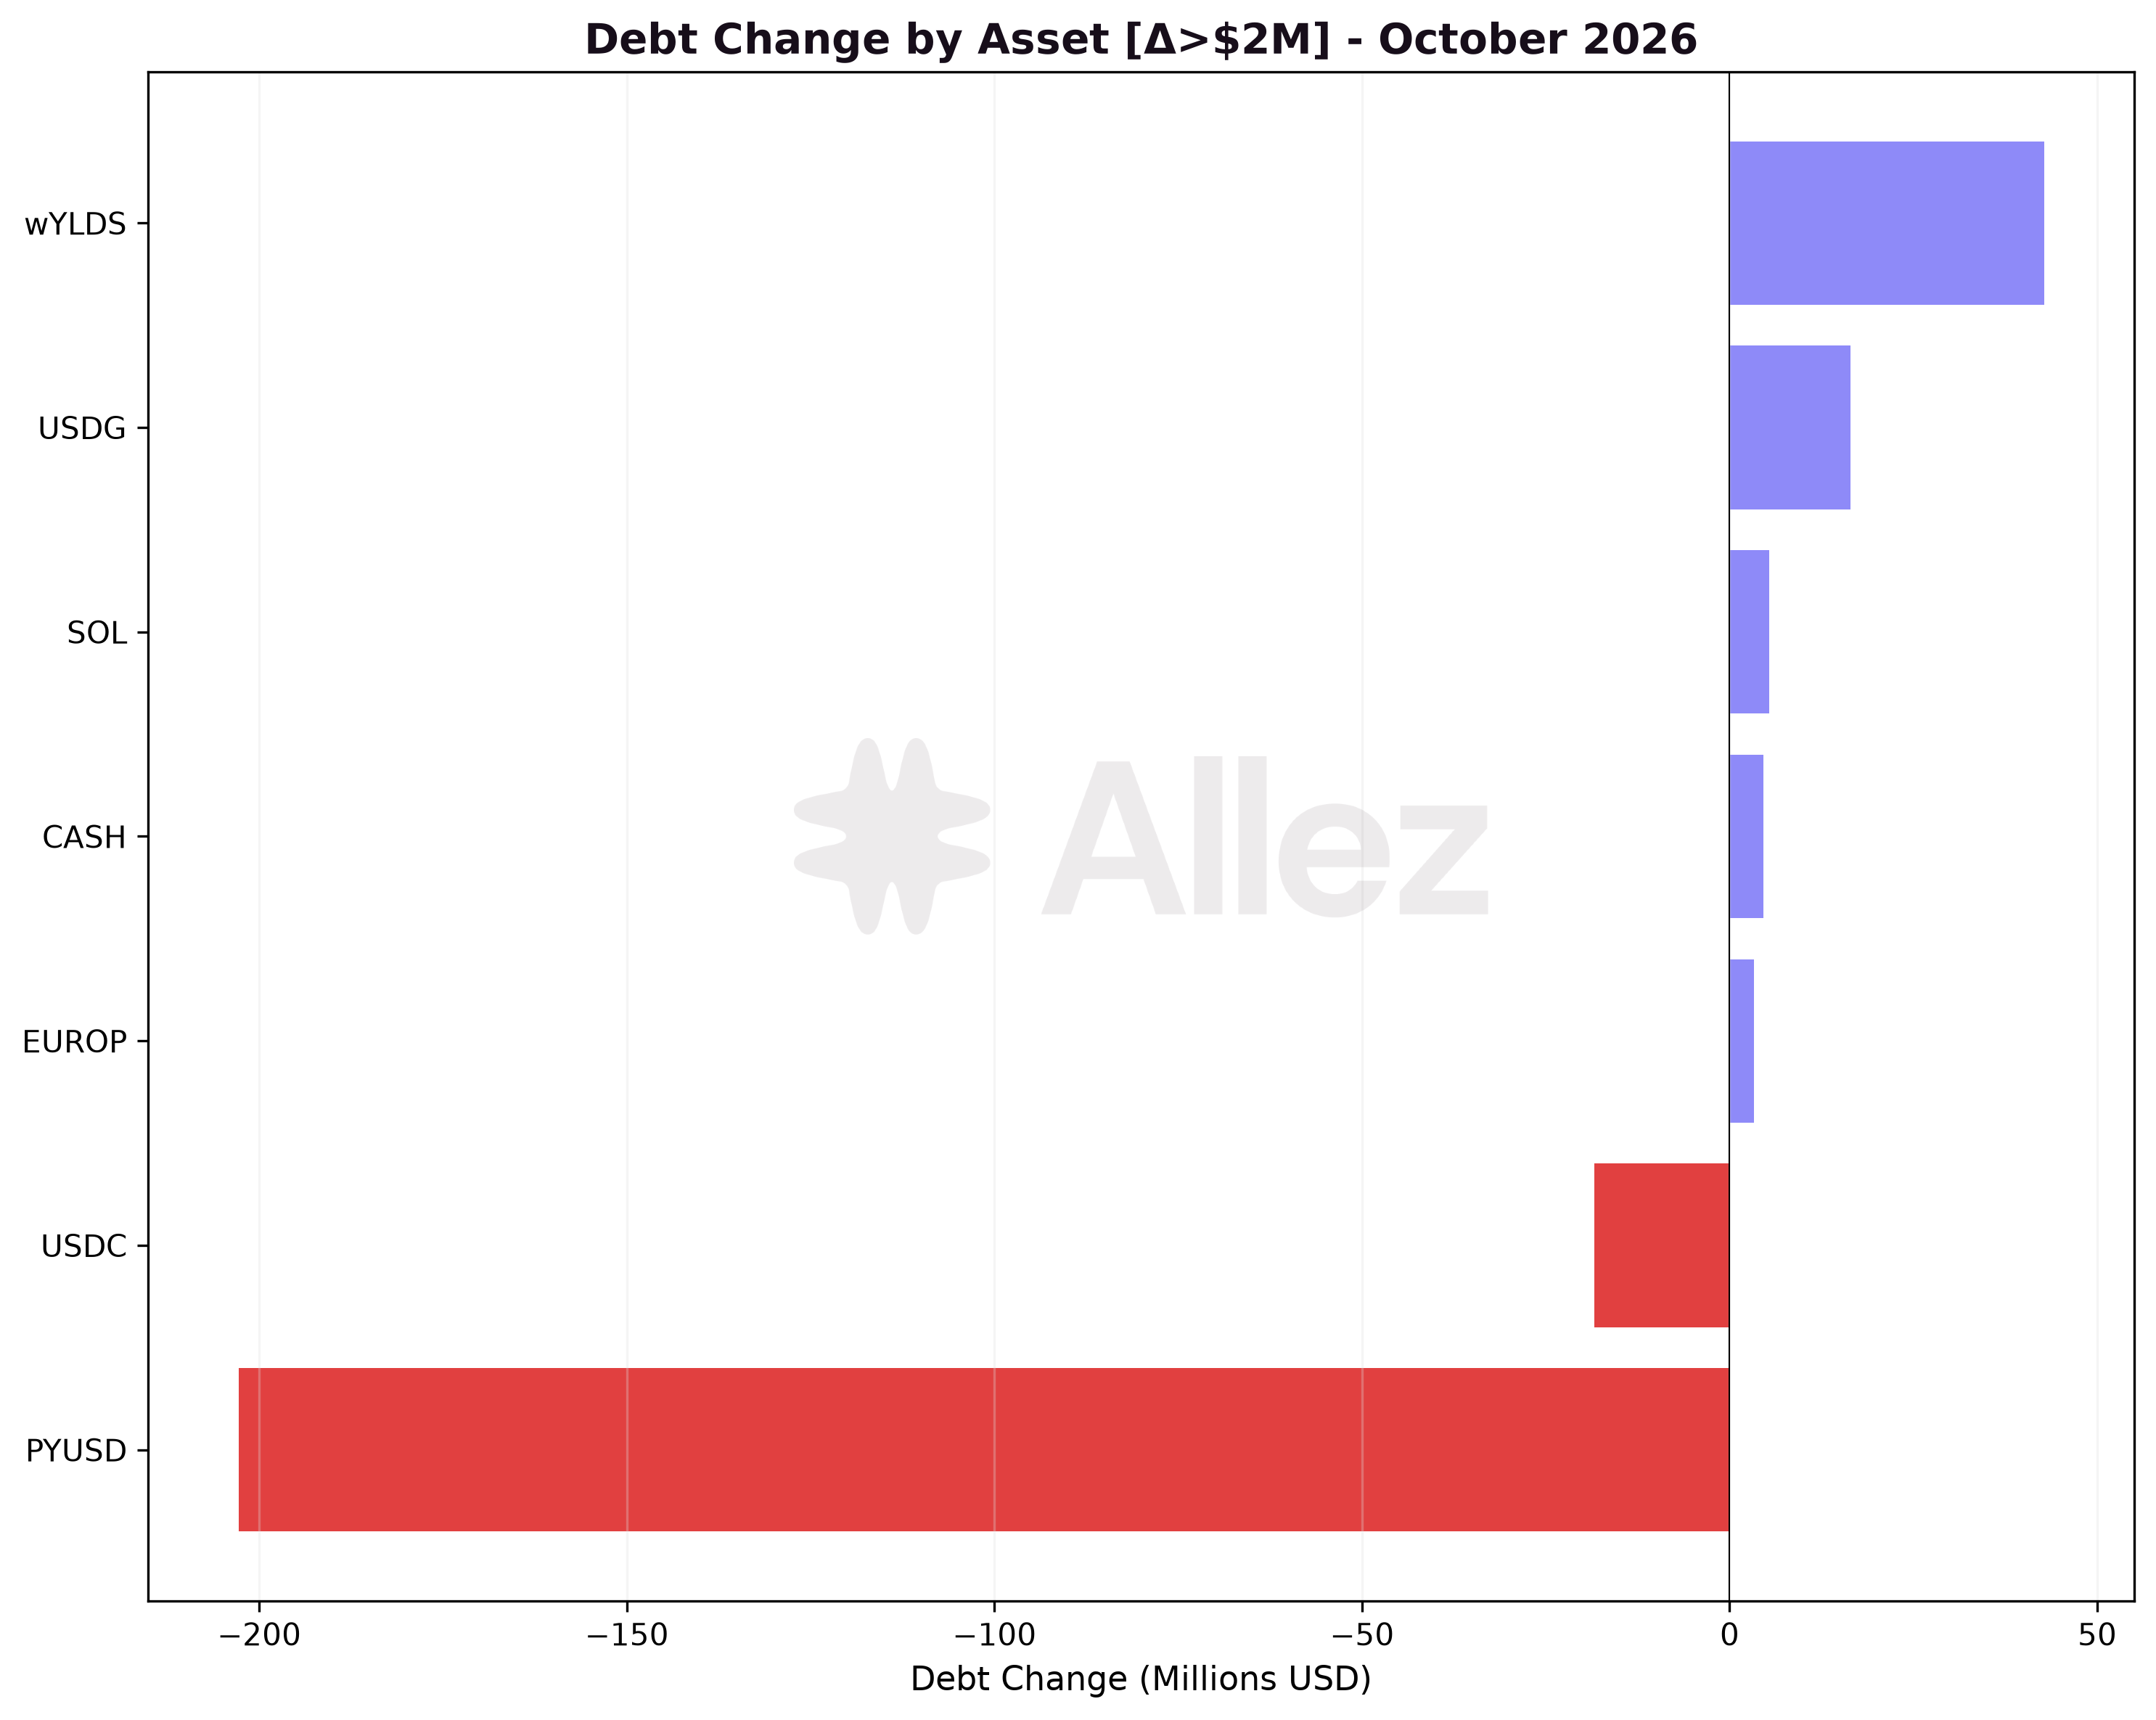
PYUSD borrowing fell $202.8M as the USDe positions behind it closed in the Ethena unwind. wYLDS led new borrowing (+$42.7M), followed by USDG (+$16.4M).
3. Risk and Liquidations
Distance to Liquidation (DTL): Correlated vs Uncorrelated Positions
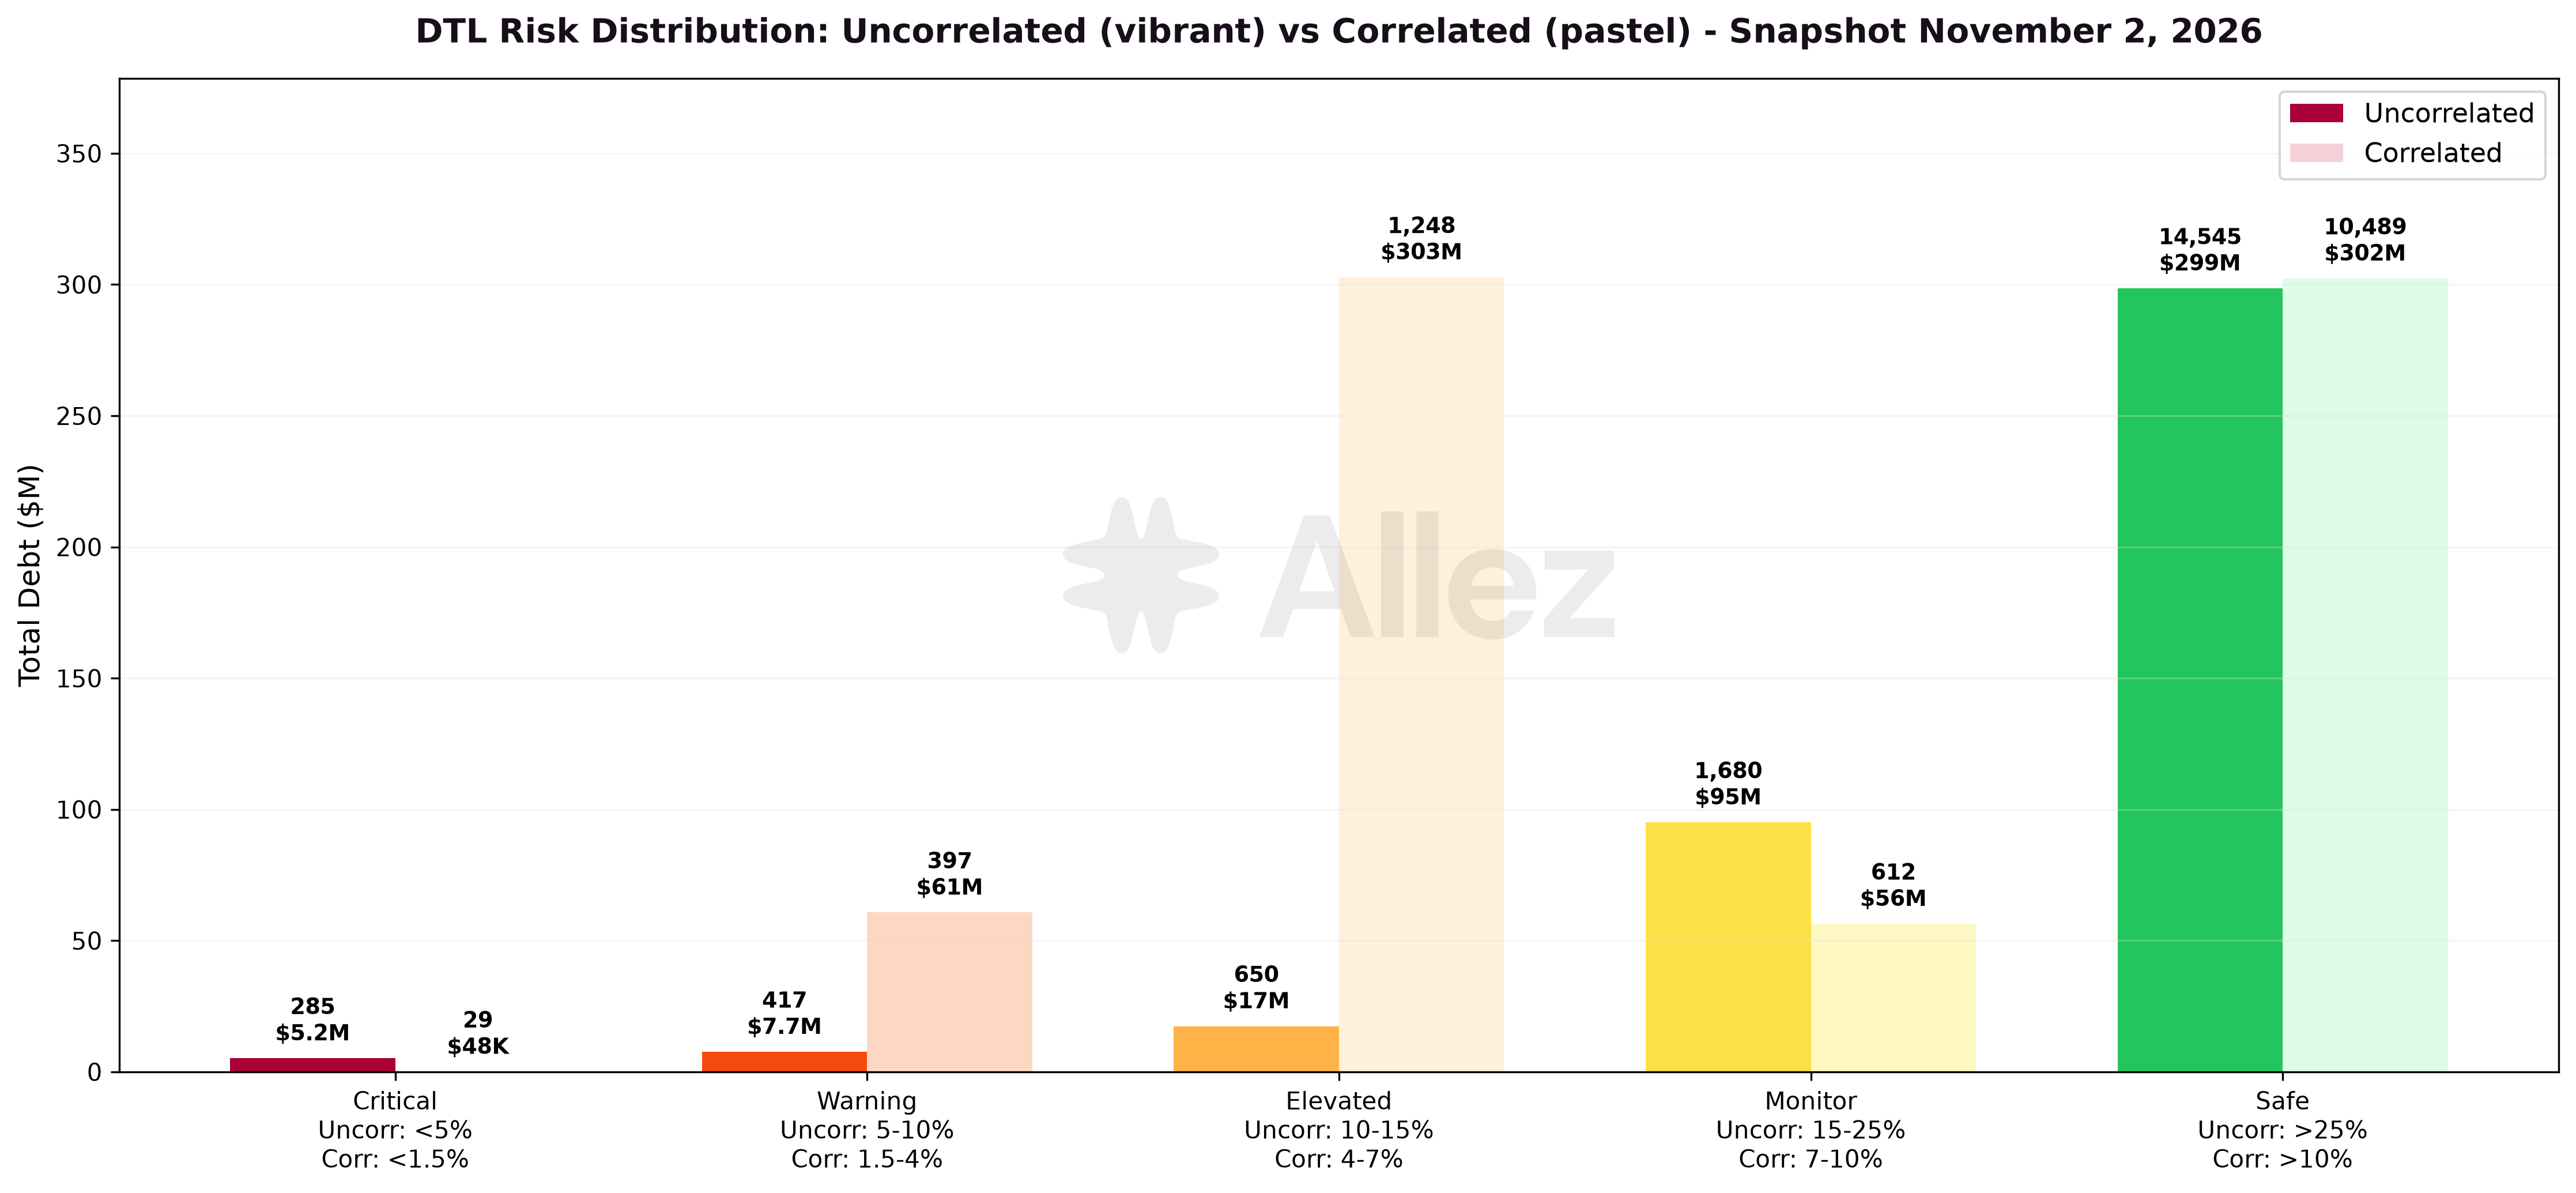
Most borrowing remains well clear of liquidation. Uncorrelated pairs are those where collateral and debt move independently, such as SOL against USDC. Correlated pairs move together, such as an LST against SOL. See the appendix for definitions.
Uncorrelated positions:
| Tier | DTL range | % debt | vs. September | Borrow value | vs. September | MoM | Collateral-debt pairs |
|---|---|---|---|---|---|---|---|
| Critical | < 5% | 1.2% | 0.5% | $5.19M | $2.01M | +158.1% | 285 |
| Warning | 5-10% | 1.8% | 1.3% | $7.65M | $4.80M | +59.3% | 417 |
| Elevated | 10-15% | 4.1% | 3.0% | $17.42M | $11.36M | +53.3% | 650 |
| Monitor | 15-25% | 22.4% | 23.1% | $95.07M | $87.69M | +8.4% | 1,680 |
| Safe | > 25% | 70.4% | 72.1% | $298.57M | $273.46M | +9.2% | 14,545 |
Correlated positions:
| Tier | DTL range | % debt | vs. September | Borrow value | vs. September | MoM | Collateral-debt pairs |
|---|---|---|---|---|---|---|---|
| Critical | < 1.5% | <0.1% | <0.1% | $0.05M | $0.03M | +53.5% | 29 |
| Warning | 1.5-4% | 8.4% | 22.1% | $60.71M | $201.84M | -69.9% | 397 |
| Elevated | 4-7% | 41.9% | 39.0% | $302.82M | $357.02M | -15.2% | 1,248 |
| Monitor | 7-10% | 7.8% | 5.8% | $56.43M | $52.79M | +6.9% | 612 |
| Safe | > 10% | 41.9% | 33.2% | $302.34M | $303.50M | -0.4% | 10,489 |
In the uncorrelated book, exposure within 10% of liquidation rose from $6.8M to $12.8M after SOL's 19.5% decline. It now makes up 3.0% of uncorrelated borrowing. Critical exposure is concentrated in the SOL/BTC market, in SOL and cbBTC collateral borrowing USDT, PYUSD and USDS. SOL collateral borrowing USDT is the largest Warning exposure. The Safe tier holds 70.4% of uncorrelated borrowing.
In the correlated book, the Warning tier fell from $201.8M to $60.7M as USDe positions borrowing PYUSD closed. The Warning and Elevated tiers together hold 50.3% of correlated borrowing, against 61.1% in September.
Liquidation summary (October):
| Metric | October | September | MoM |
|---|---|---|---|
| Events | 1,247 | 725 | +72.0% |
| Collateral seized | $915.2K | $436.3K | +109.8% |
| Debt repaid | $900.0K | $431.9K | +108.4% |
| Average size | $734 | $602 | +21.9% |
Excludes 4,277 repeated small liquidations of flagged positions ($48 seized).
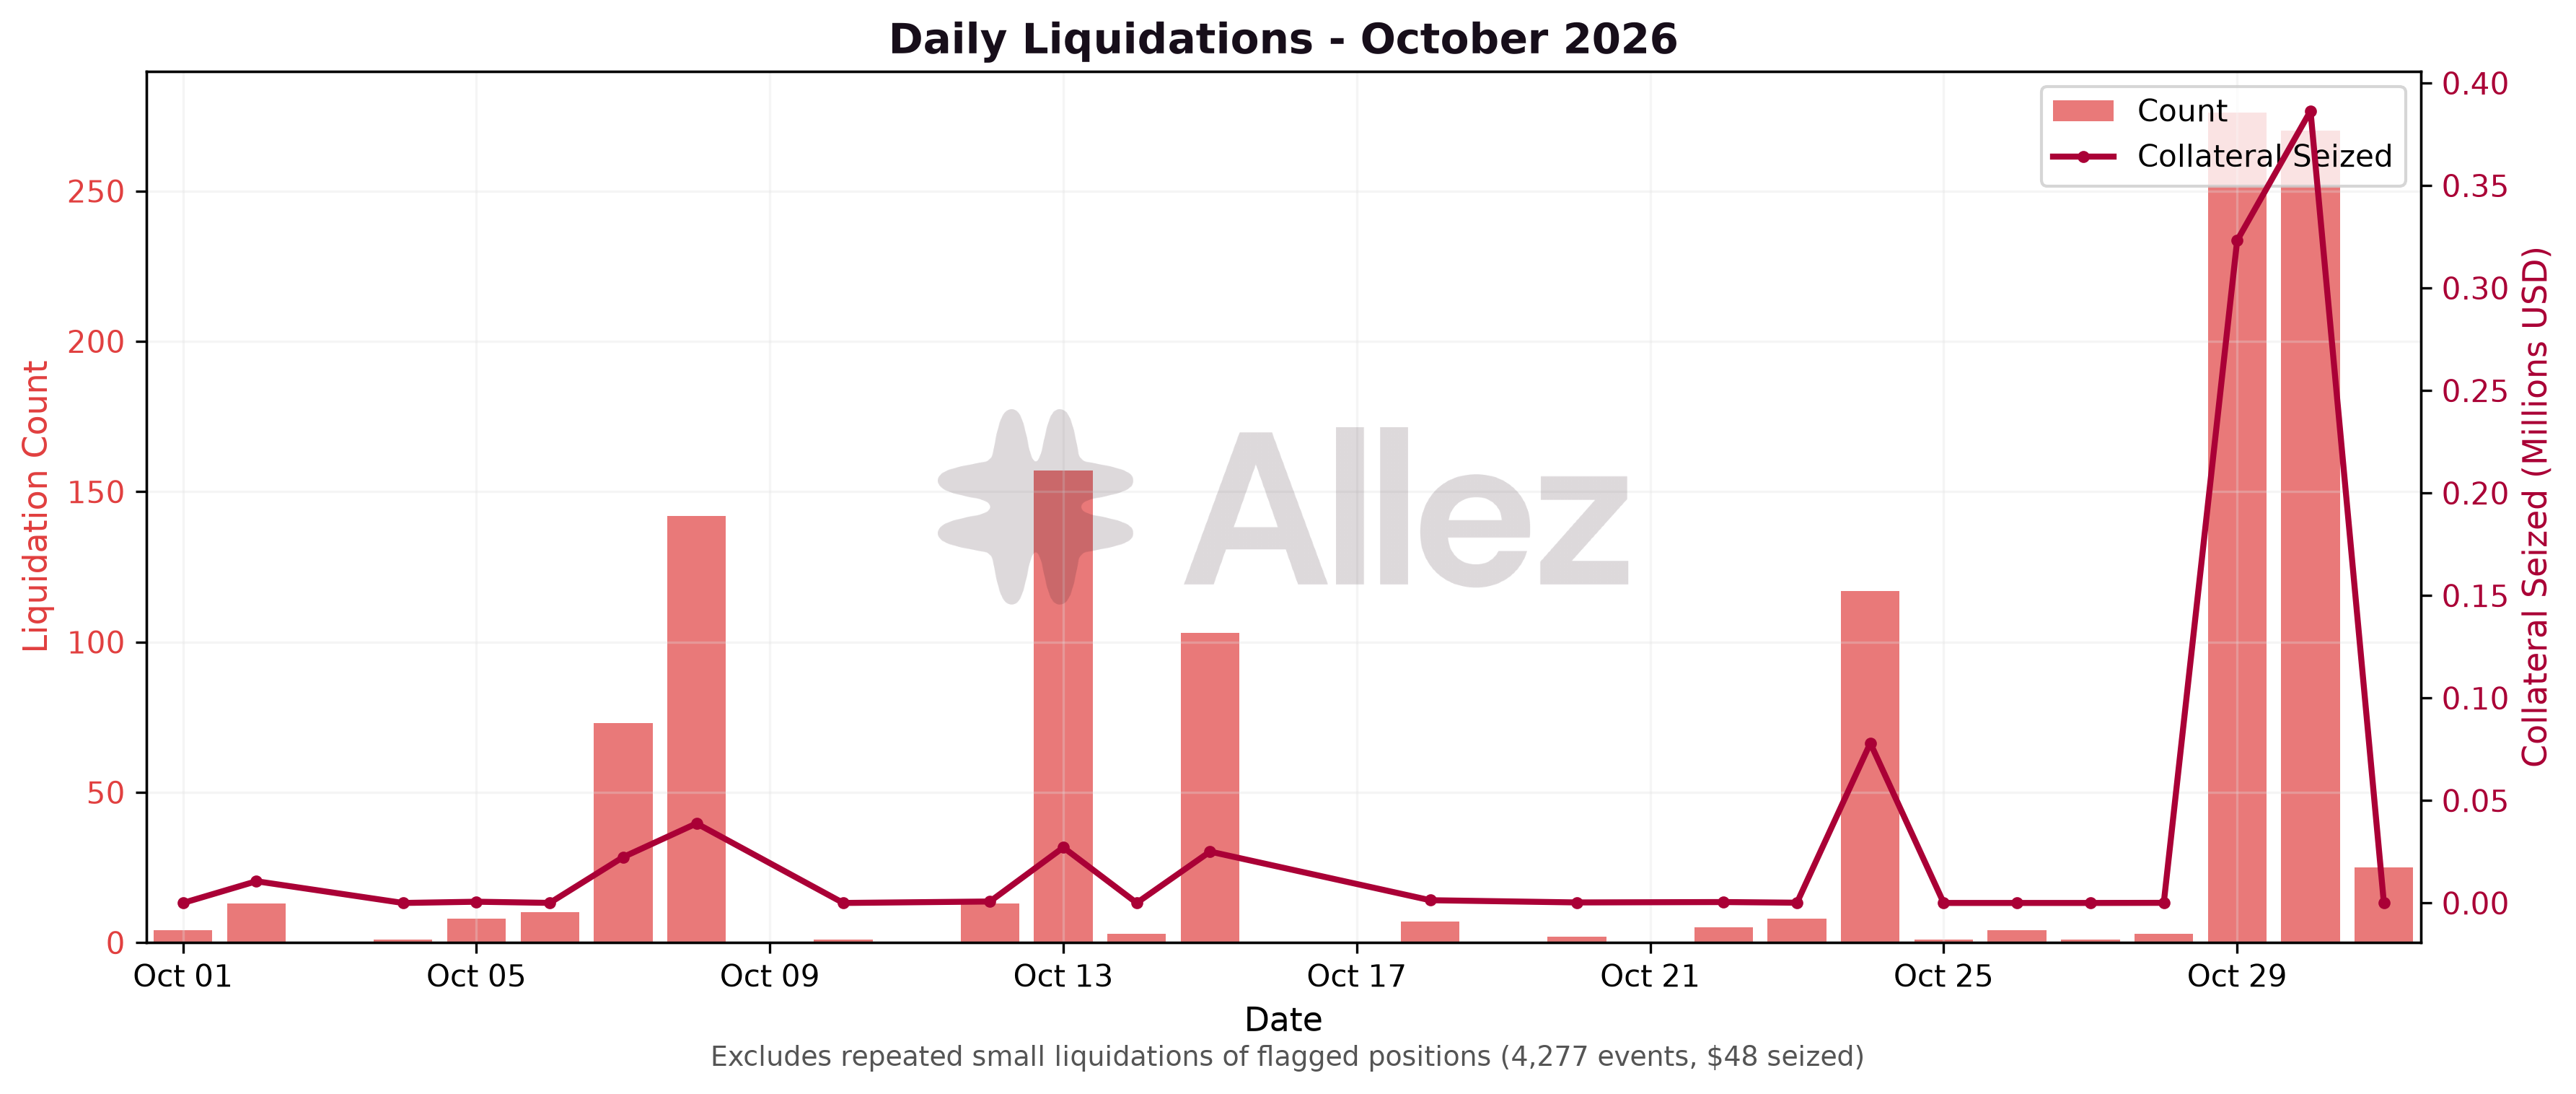
Liquidations stayed low for most of October, at $205.6K of collateral from October 1 to 28. October 29 and 30 accounted for $709.6K, 78% of the month's $915.2K across 1,247 events.
Liquidators seized about $112K of collateral during a broader crypto selloff on the afternoon of October 29. About $585K followed between 20:06 UTC on October 29 and 02:00 UTC on October 30, after the Binance hot-wallet hack, as SOL fell toward its low of $92.70.
Over the full month, SOL made up the largest share of liquidated collateral, against USDC ($224.2K), USDT ($192.2K) and USDS ($180.5K), 65% of the month's value together. Tokenized equities followed, with GOOGLx ($66.1K) and AAPLx ($45.7K) against USDC.
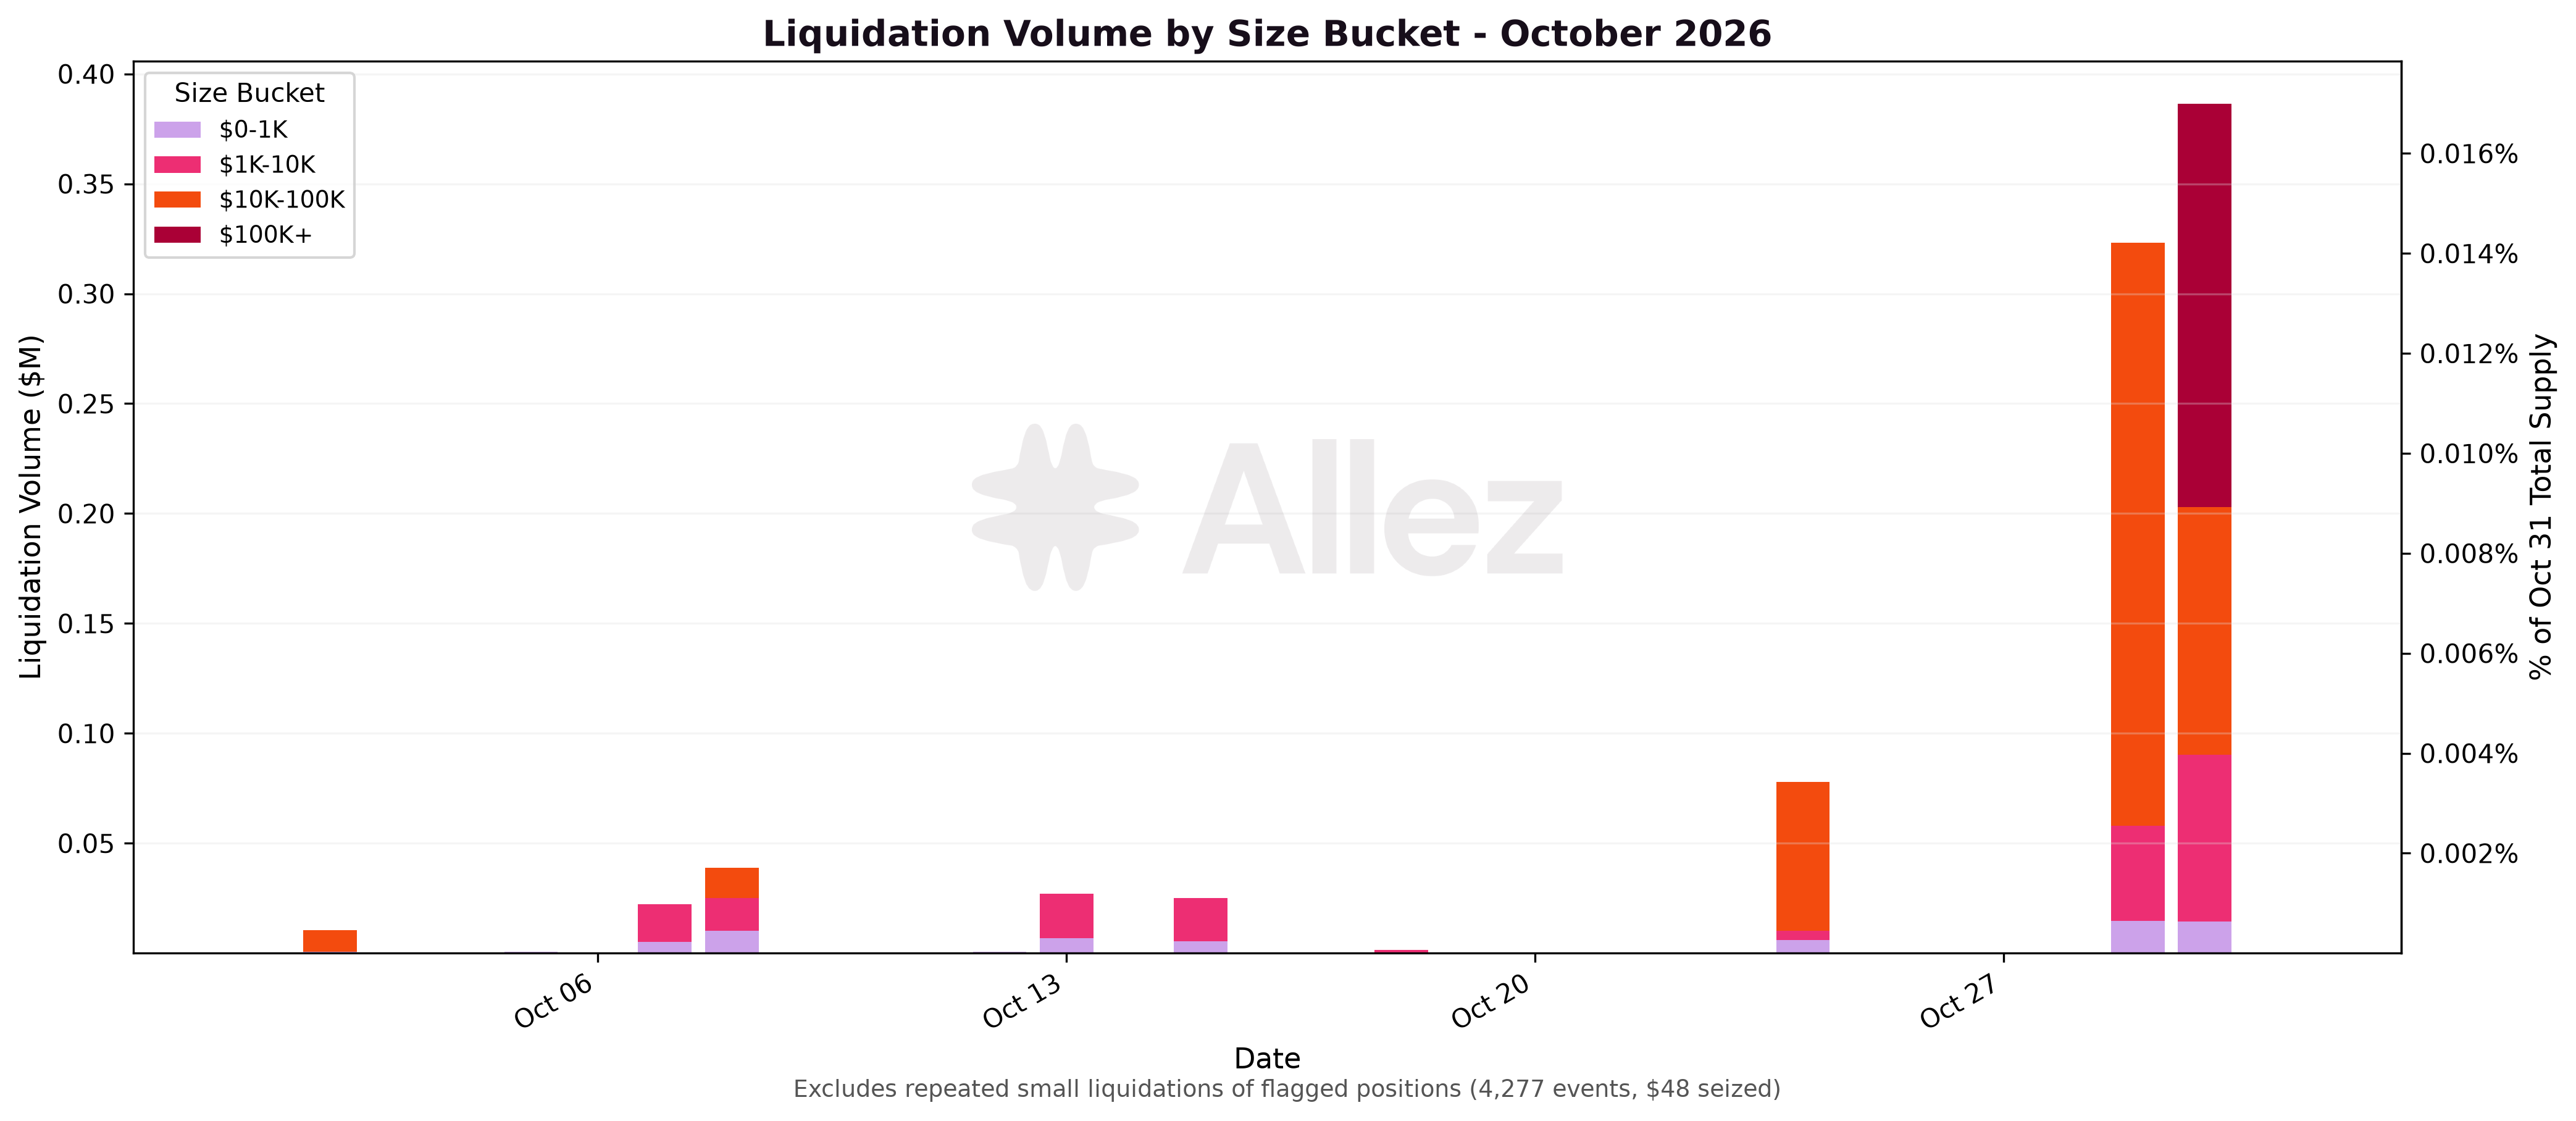
| Size bucket | Volume | Events |
|---|---|---|
| $0-1K | $65.4K | 1,157 |
| $1K-10K | $197.0K | 73 |
| $10K-100K | $469.3K | 16 |
| $100K+ | $183.5K | 1 |
The 17 largest liquidations, each above $10K, account for 71% of the value. Liquidations under $1K made up 93% of events but 7% of value.
Stress Testing:
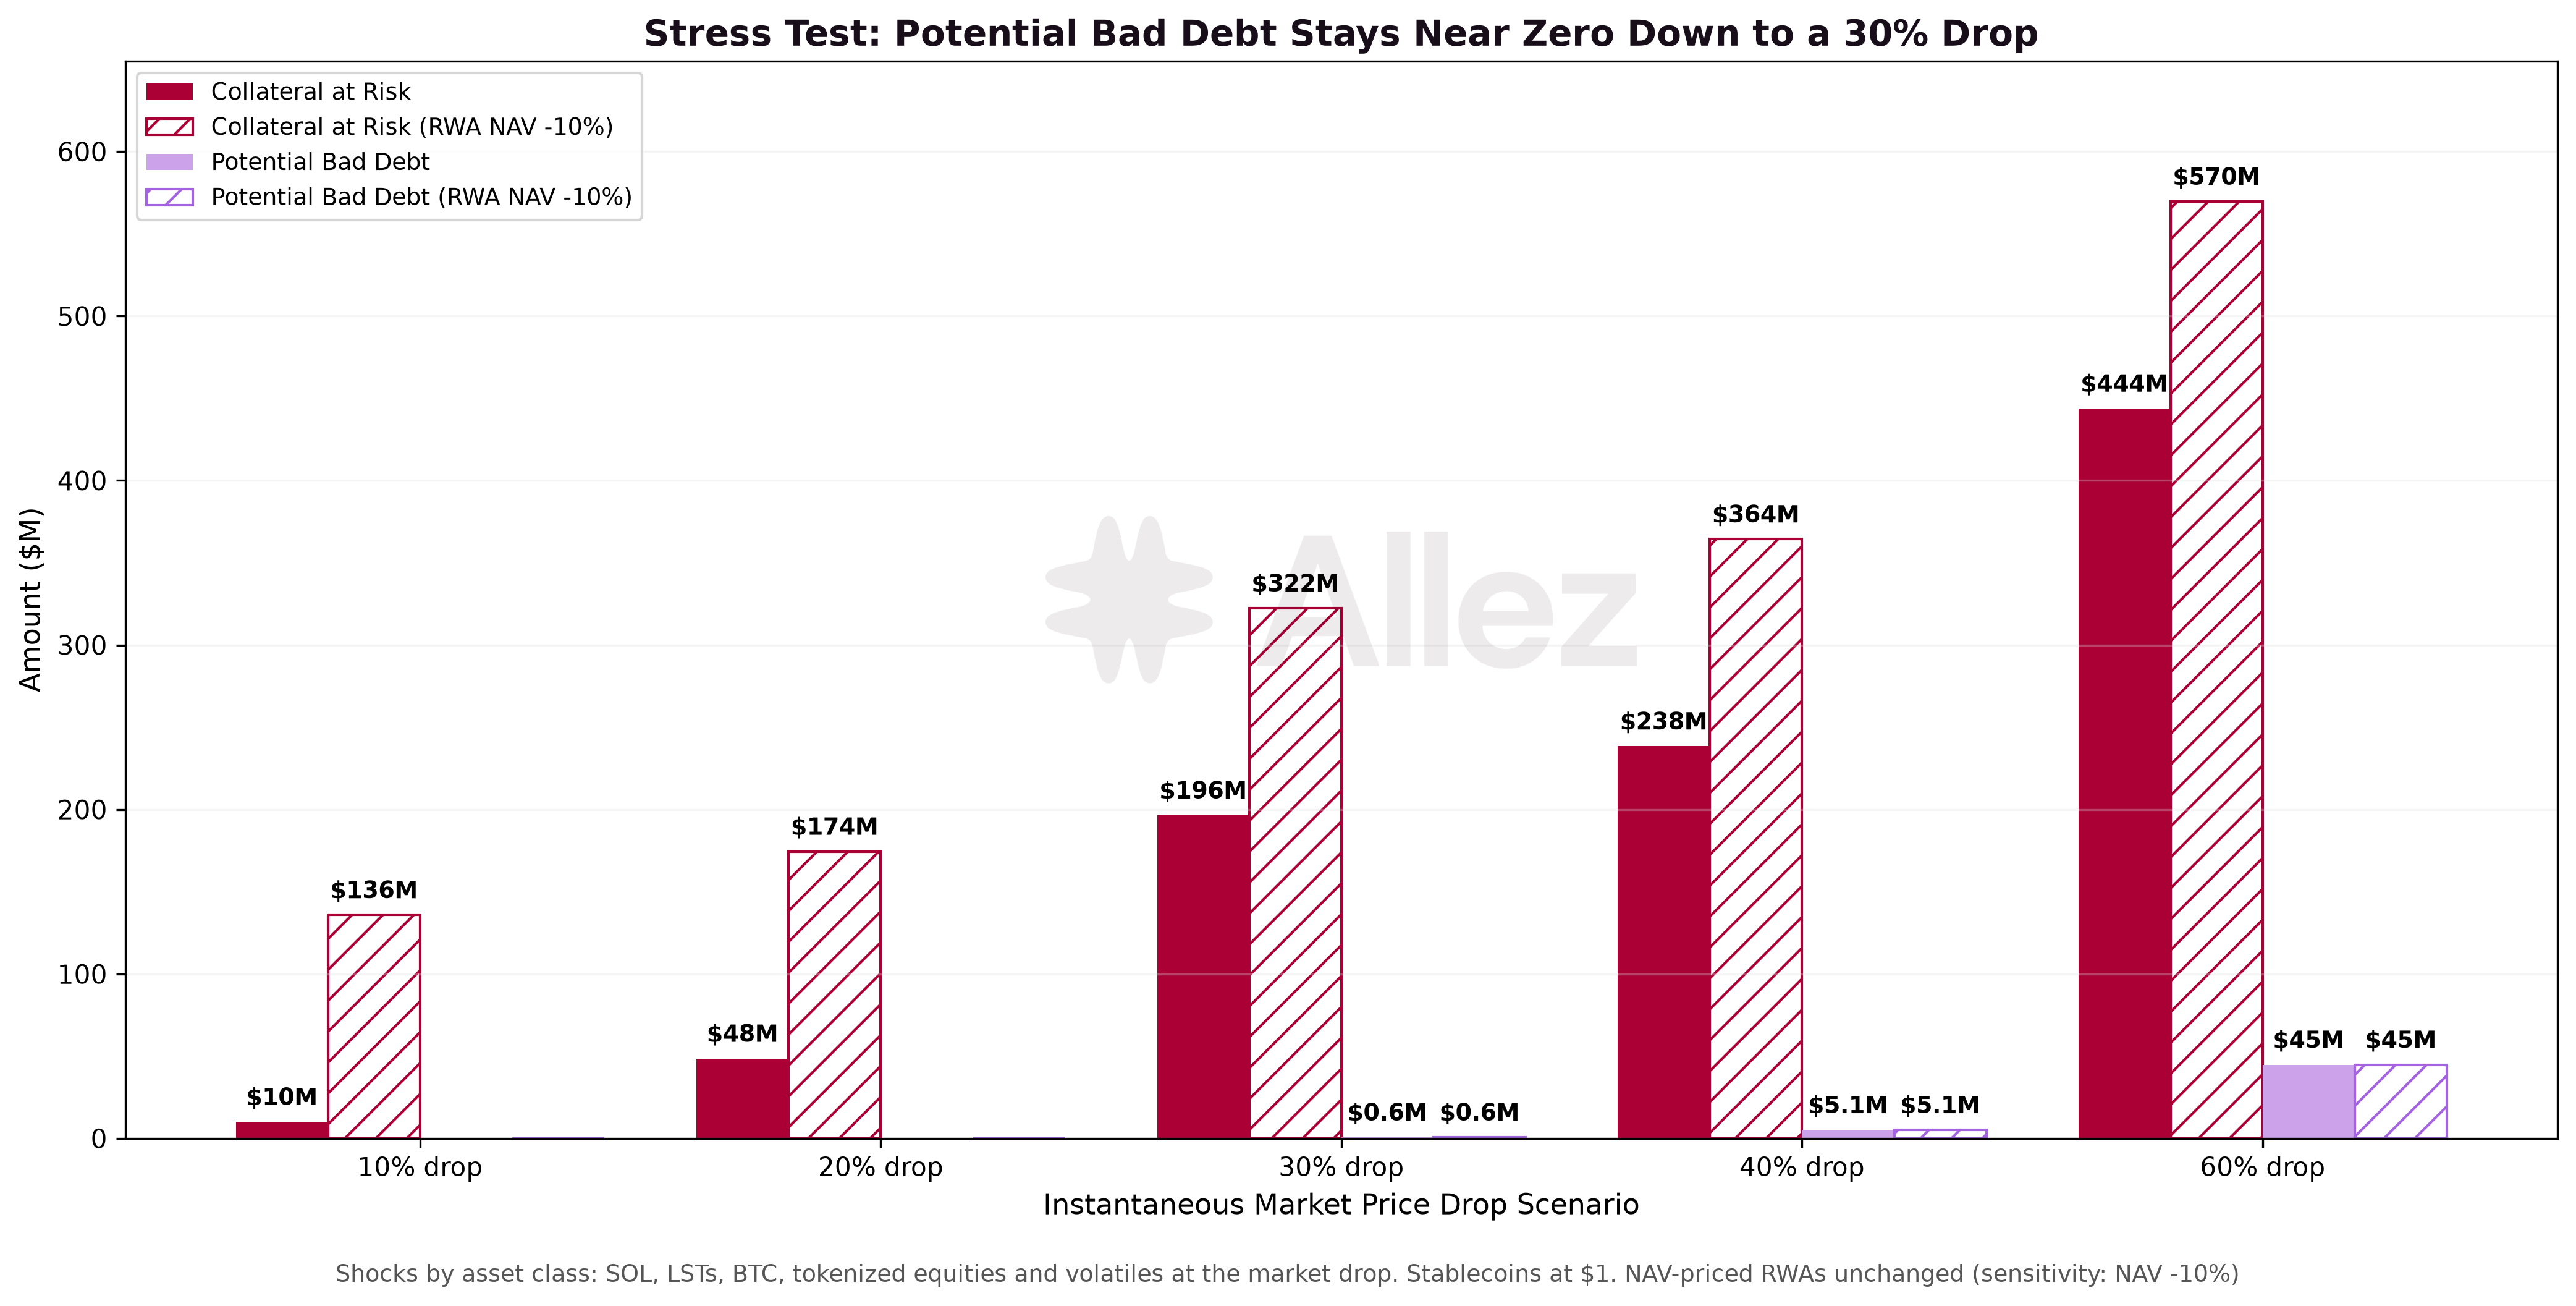
| Price shock | Collateral at risk | September | MoM | Potential bad debt | Positions at risk | At risk, RWA NAV -10% | Bad debt, RWA NAV -10% |
|---|---|---|---|---|---|---|---|
| -10% | $10.0M | $3.9M | +156% | $0.0M | 488 | $135.8M | $0.0M |
| -20% | $48.5M | $24.0M | +102% | $0.0M | 1,188 | $174.4M | $0.0M |
| -30% | $196.4M | $173.3M | +13% | $0.6M | 3,630 | $322.3M | $0.6M |
| -40% | $238.4M | $238.4M | 0% | $5.1M | 5,534 | $364.3M | $5.1M |
| -60% | $443.8M | $455.5M | -3% | $44.8M | 13,045 | $569.6M | $44.8M |
Collateral at risk at small drops rose from September: $10.0M at -10% (from $3.9M) and $48.5M at -20% (from $24.0M), now 2.1% of supply. SOL's 19.5% decline left SOL-backed positions closer to their liquidation thresholds. A smaller further drop now reaches them. Potential bad debt stays at $0.6M or less down to a 30% drop. Most of the jump between -20% and -30% again comes from two large dSOL positions borrowing stablecoins ($83.4M of collateral). The RWA sensitivity adds about $125M of collateral at risk but no bad debt.
Liquidation Cascade and On-Chain Exit Depth (SOL)
For SOL collateral in the SOL/BTC market, on-chain liquidity absorbs estimated liquidation selling with less than 2% price impact down to about a 24.5% SOL drop from the current price, against 38% in September.
On-chain depth held steady, at $14.5M within 2% of price. The change comes from positions moving closer to liquidation as SOL fell. The largest SOL position, about $16M of SOL against $10M of debt, now liquidates after a drop of about 20%, against about 34% in September. It sits in a $19.2M block of SOL collateral that liquidates between a 20% and 22.5% drop.
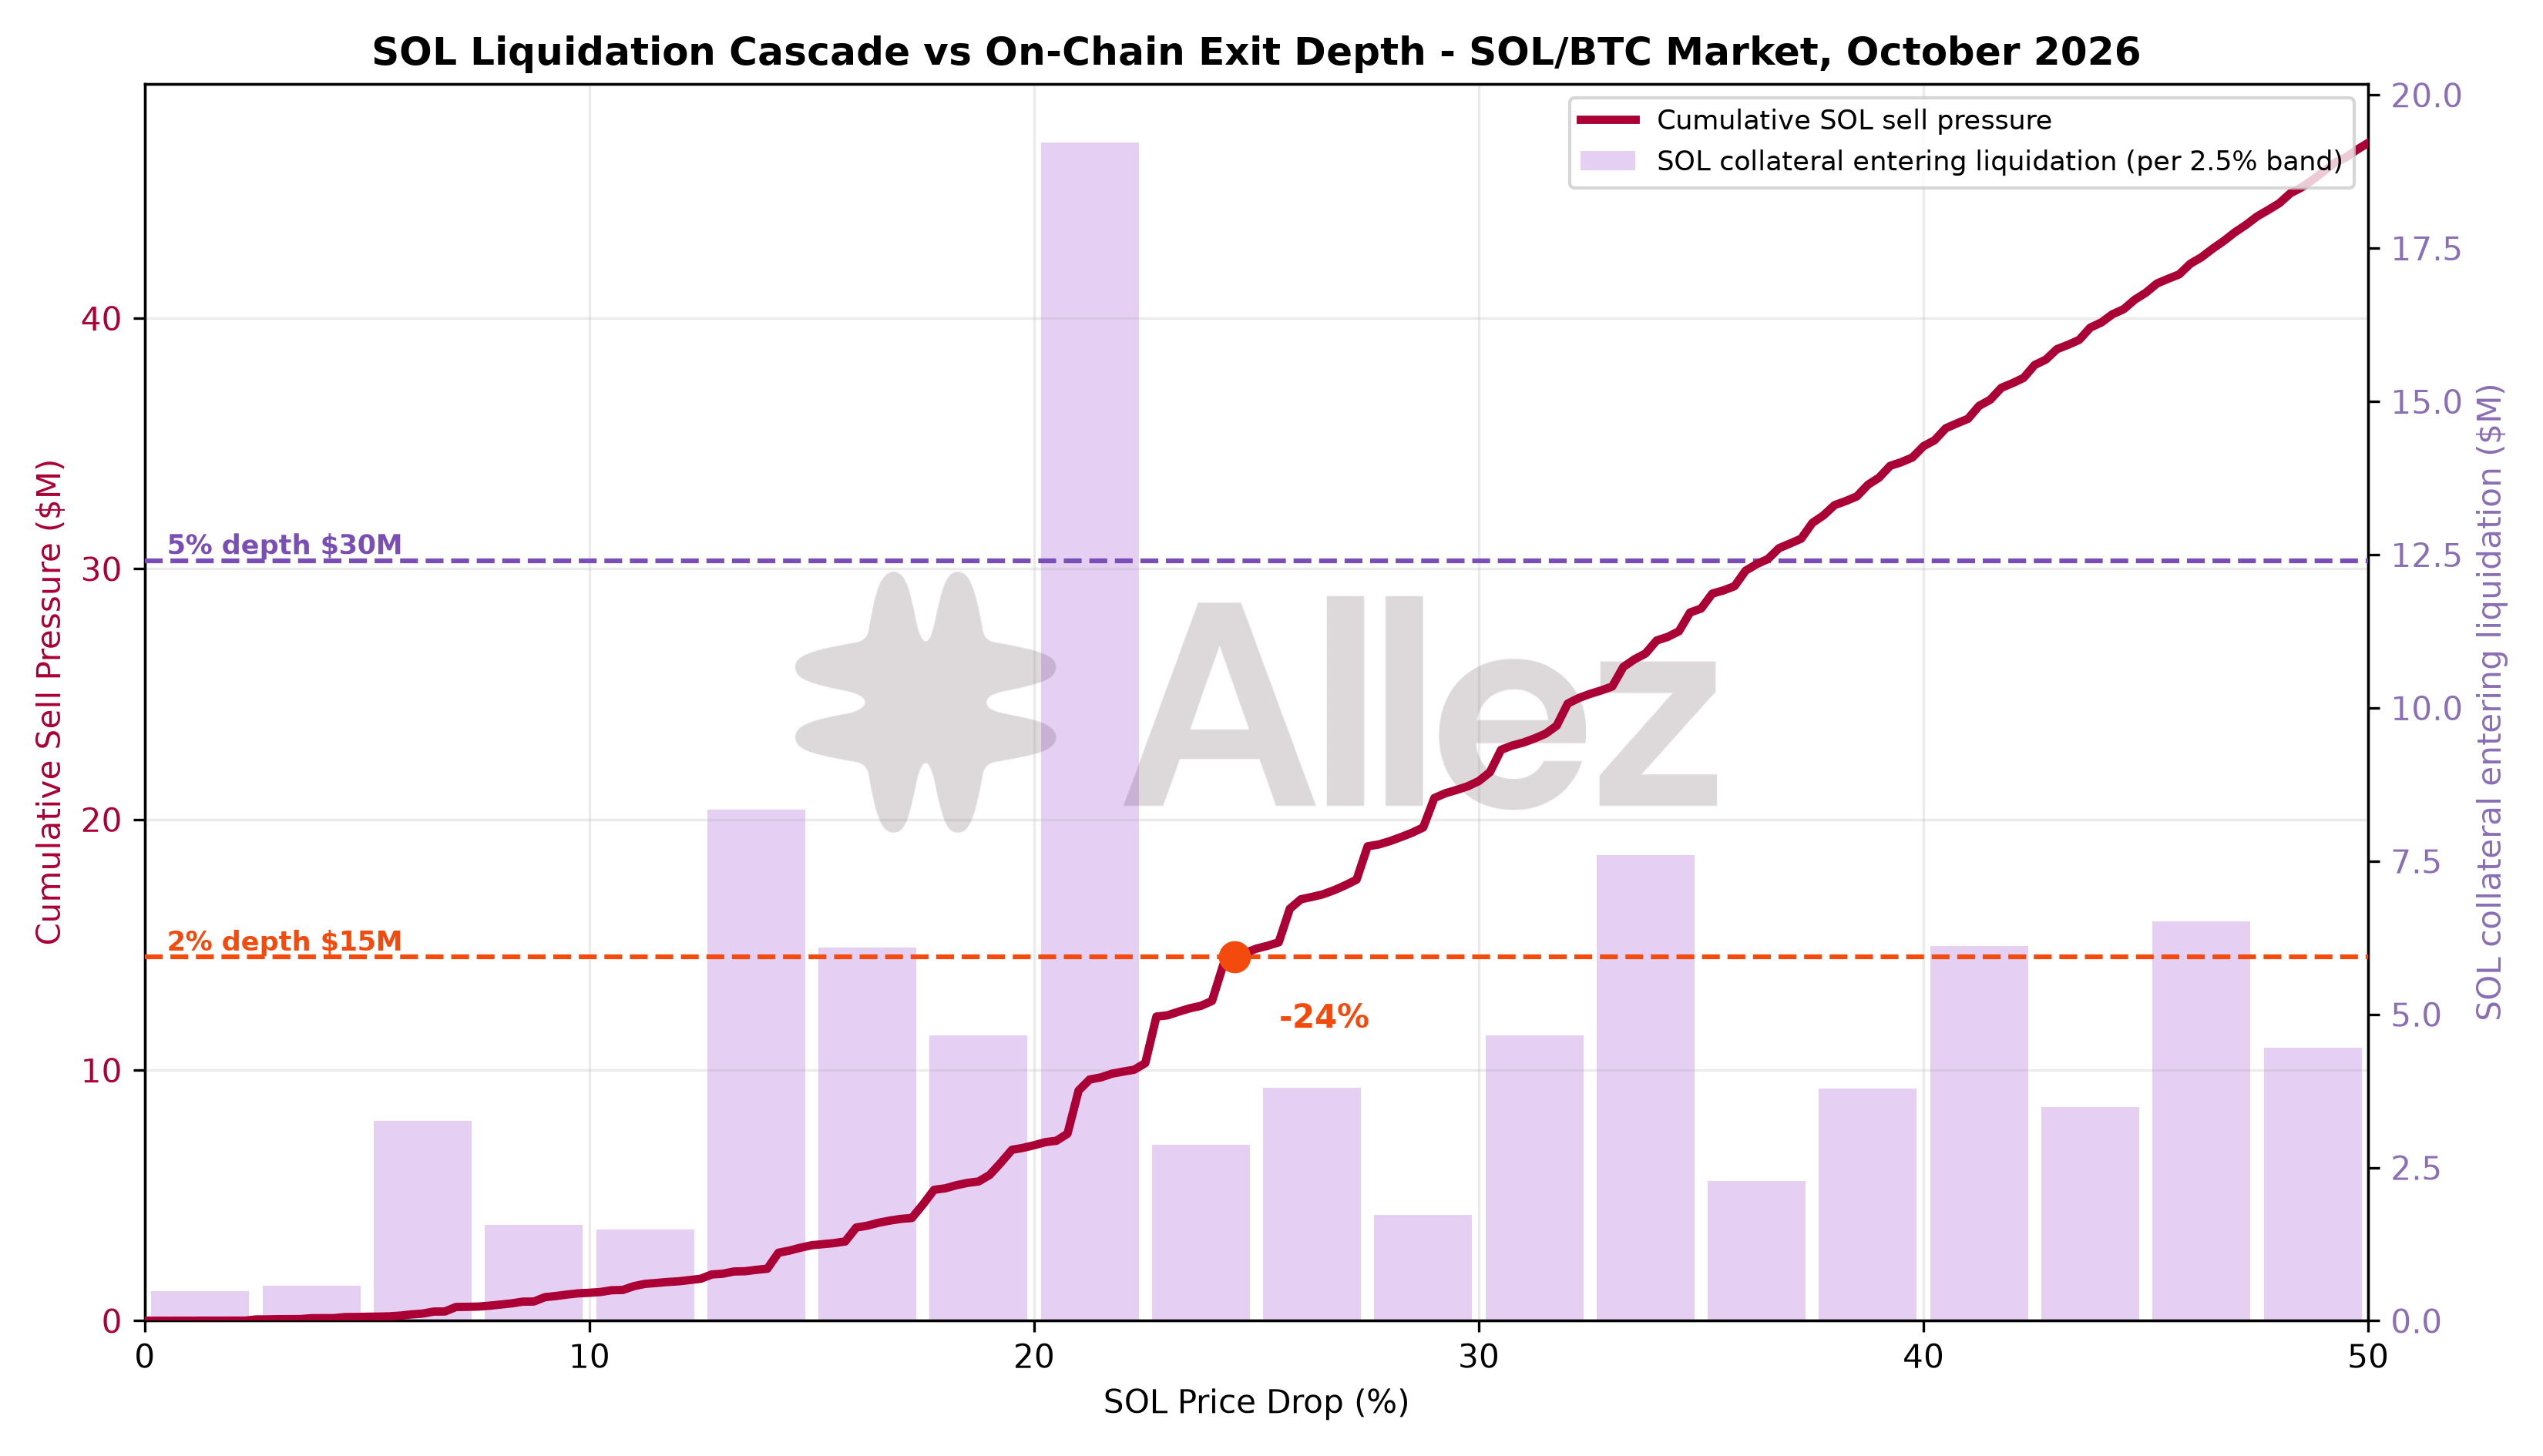
| SOL price drop | Cumulative SOL sell pressure | September | MoM | Added price impact | 2% depth coverage | 5% depth coverage |
|---|---|---|---|---|---|---|
| -10% | $1.1M | $0.33M | +242% | 0.07% | 13.0x | 27.1x |
| -20% | $7.0M | $2.2M | +223% | 0.76% | 2.1x | 4.3x |
| -30% | $21.5M | $6.7M | +221% | 2.54% | 0.67x | 1.41x |
| -40% | $34.9M | $17.1M | +104% | 12.84% | 0.42x | 0.87x |
| -50% | $47.0M | $28.2M | +67% | 30.20% | 0.31x | 0.65x |
Added price impact is the extra price impact from selling the cumulative SOL in one swap into USDC. Depth coverage is the SOL that can be sold within 2% or 5% of price impact, divided by the sell pressure. Above 1.0x, on-chain liquidity absorbs the selling within that impact. See the appendix for how depth is measured.
4. Per-Market Micro Analysis
Spotlight: Kamino Fixed Rates and the AUTO Market
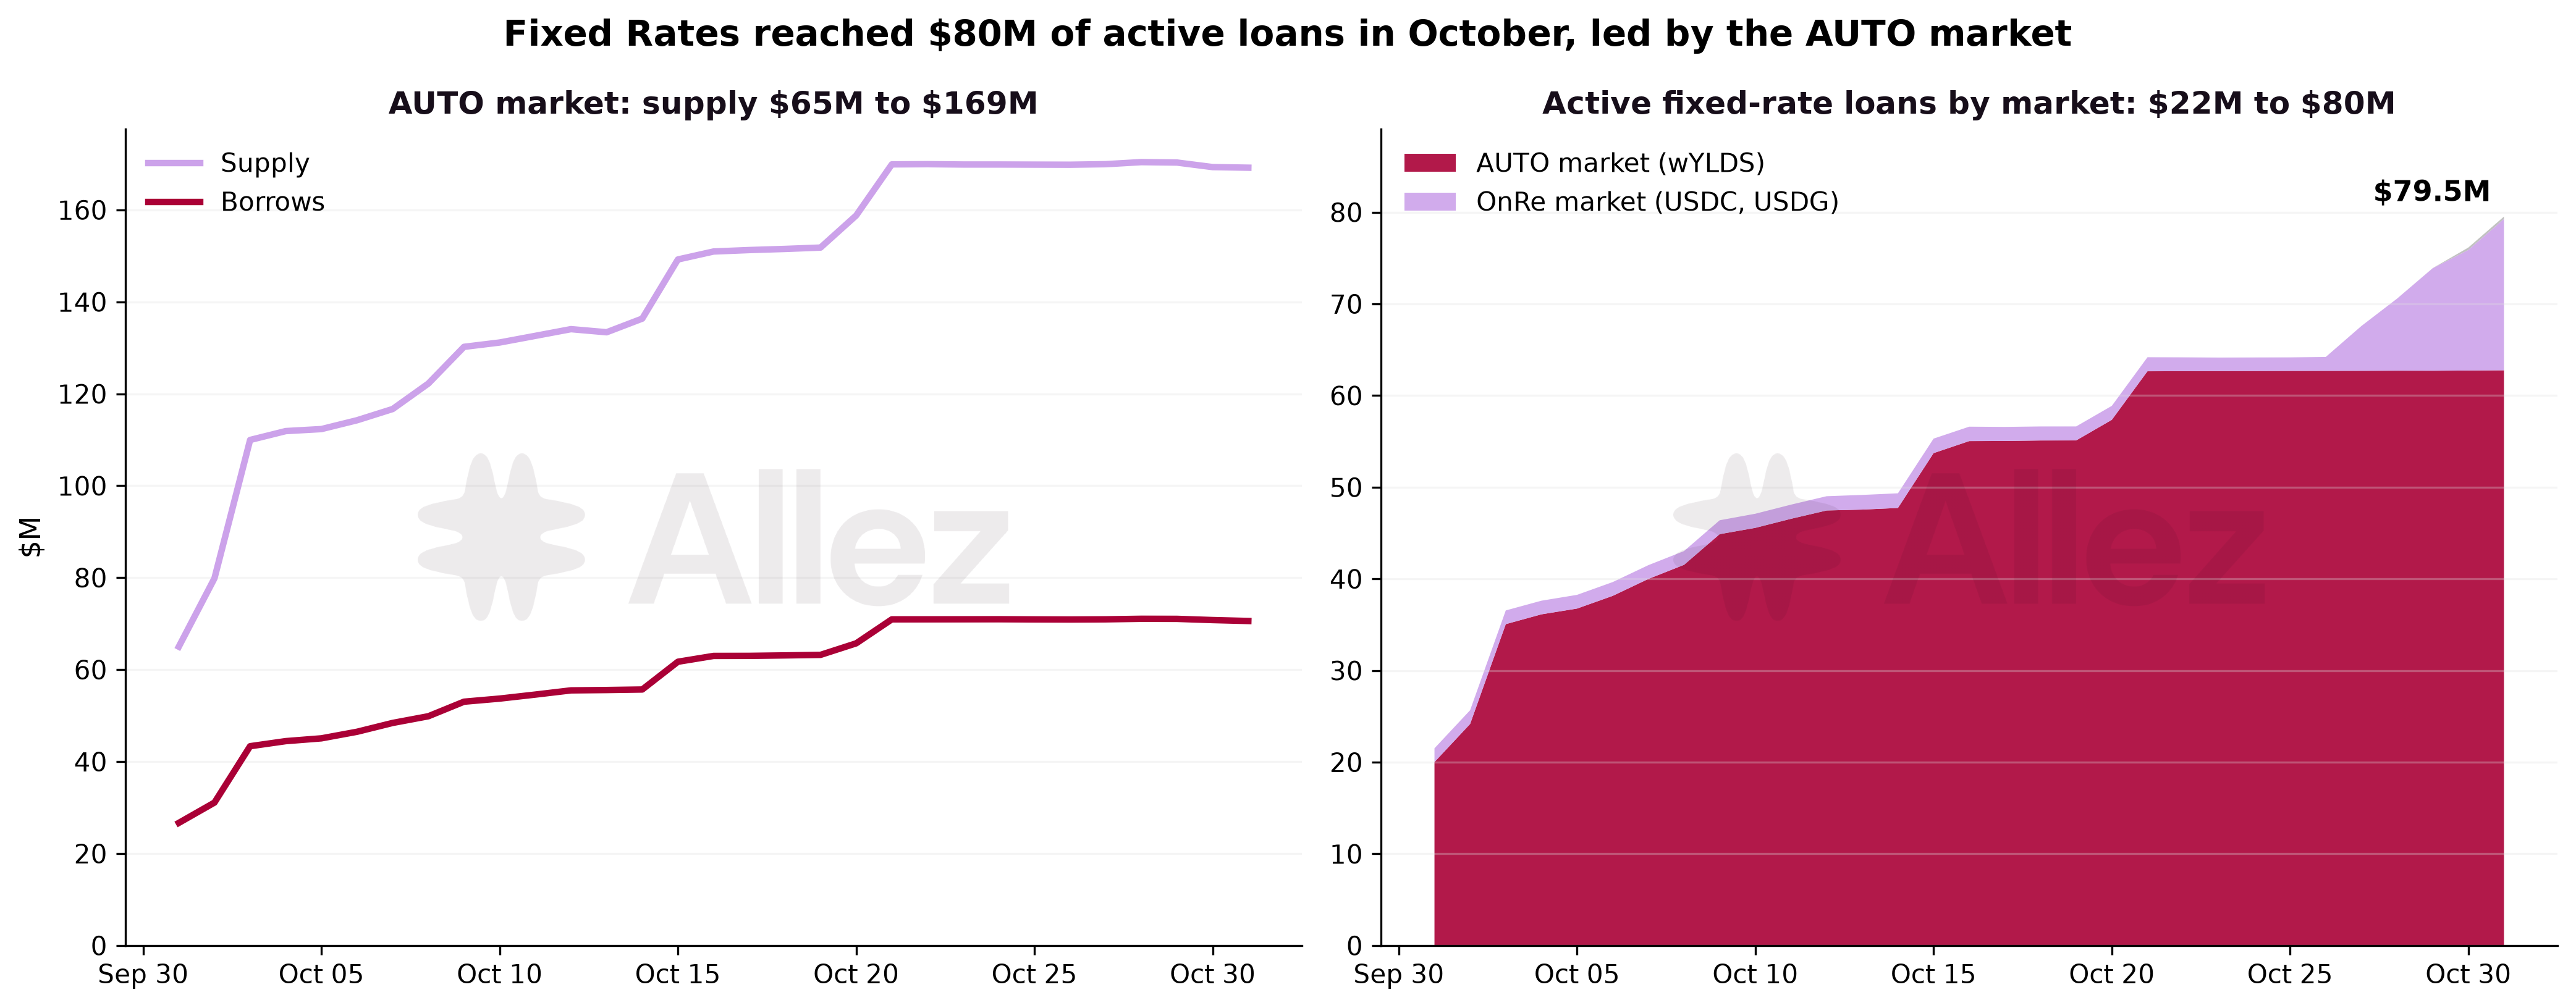
Kamino Fixed Rates completed its first full month in October. Active fixed-rate loans grew from $21.5M to $79.5M. The AUTO market holds $62.8M of them: wYLDS borrowed against AUTO across four reserves at 5.30% to 6.25% for 30-day terms. Fixed-rate loans make up 89% of AUTO market borrowing. The OnRe market held $16.5M of fixed-rate USDC and USDG loans, $15.0M of it opened between October 27 and 31.
AUTO market supply rose 160.5% to $169.2M, and its borrowing 165.7% to $70.6M. Auto Rollover renewed more than $12M of maturing loans into new 30-day terms.
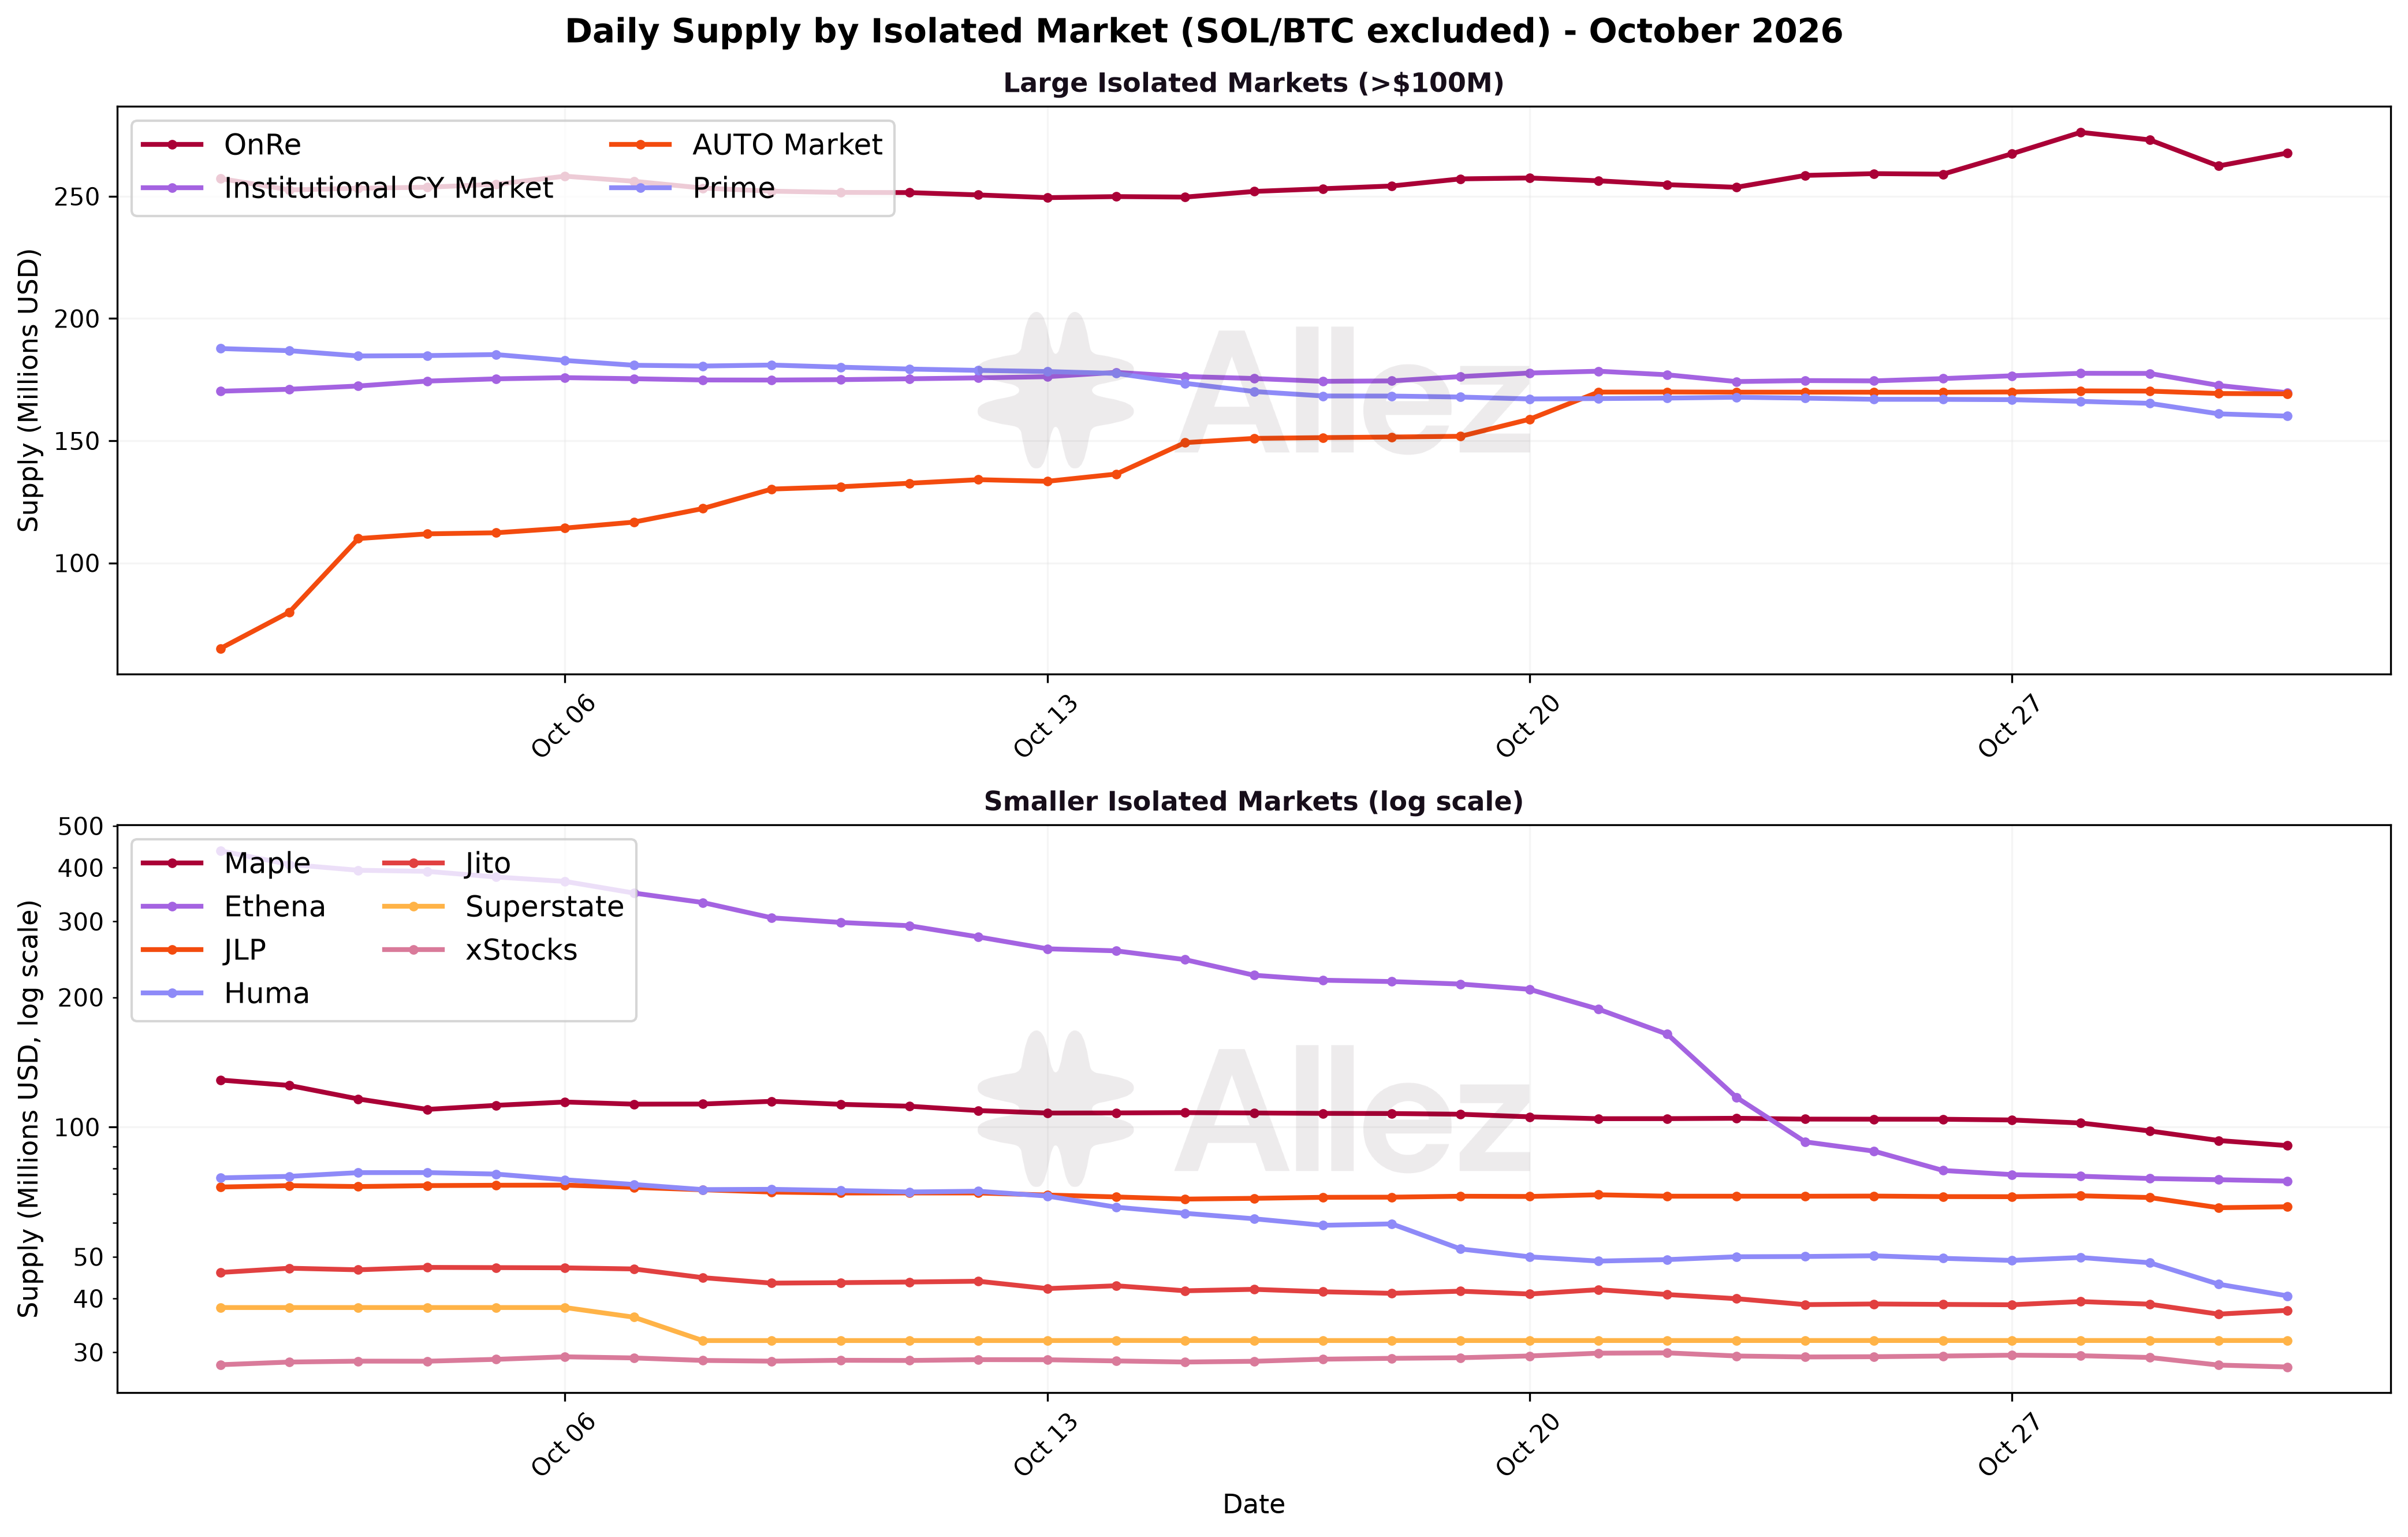
Growing markets: AUTO (+160.5% to $169.2M), Schuman EUROP Prime (+155.2% to $11.6M), Sentora xStocks (+81.6% to $16.1M), Plume Vaults (+69.9% to $16.8M), ZCASH (+28.5% to $5.6M).
Contracting markets: Ethena (-83.6% to $74.9M), Huma (-46.2% to $40.6M), Maple (-32.3% to $90.5M), Jito (-19.4% to $37.5M), SolBlaze (-17.7% to $13.5M), Prime (-14.9% to $160.1M), SOL/BTC (-12.7% to $995.1M).
The Ethena market lost $380.6M of supply as USDe collateral and PYUSD debt closed. Huma and Maple contracted with PST and syrupUSDC outflows. SOL/BTC declined mostly with the SOL price. The USDai market, launched in September, ended October at $8.8M of supply (-19.2%) and $3.6M of debt.
Market snapshot (month-end):
| Market | Supply | Supply MoM | Debt | Debt MoM | Util |
|---|---|---|---|---|---|
| SOL/BTC | $995.1M | -12.7% | $408.7M | -9.8% | 41% |
| OnRe | $267.7M | -1.1% | $94.3M | +6.5% | 35% |
| Institutional CY | $169.6M | -0.1% | $49.6M | +2.6% | 29% |
| AUTO | $169.2M | +160.5% | $70.6M | +165.7% | 42% |
| Prime | $160.1M | -14.9% | $70.6M | -11.2% | 44% |
| Maple | $90.5M | -32.3% | $39.3M | -31.2% | 43% |
| Ethena | $74.9M | -83.6% | $23.5M | -88.4% | 31% |
| JLP | $65.3M | -9.3% | $22.3M | -2.6% | 34% |
| Huma | $40.6M | -46.2% | $16.5M | -42.6% | 41% |
| Jito | $37.5M | -19.4% | $16.8M | -21.3% | 45% |
| Superstate | $31.9M | -16.2% | $4.8M | -36.5% | 15% |
| xStocks | $27.7M | -0.9% | $5.4M | +0.3% | 19% |
| reUSD | $17.8M | -6.8% | $7.4M | -9.6% | 42% |
| Plume Vaults | $16.8M | +69.9% | $6.3M | +89.1% | 38% |
| Sentora xStocks | $16.1M | +81.6% | $2.6M | +122.0% | 16% |
| SolBlaze | $13.5M | -17.7% | $6.1M | -19.4% | 45% |
| Solstice | $12.8M | -16.9% | $4.3M | -28.3% | 33% |
| Obligate | $12.1M | -0.6% | $4.3M | -6.1% | 36% |
| Schuman EUROP Prime | $11.6M | +155.2% | $3.3M | new | 29% |
SOL/BTC rose to 43.8% of protocol supply from 40.6%, as other markets contracted faster. The two largest markets, SOL/BTC and OnRe, hold 55.5% of supply.
5. Kamino Lending Vaults
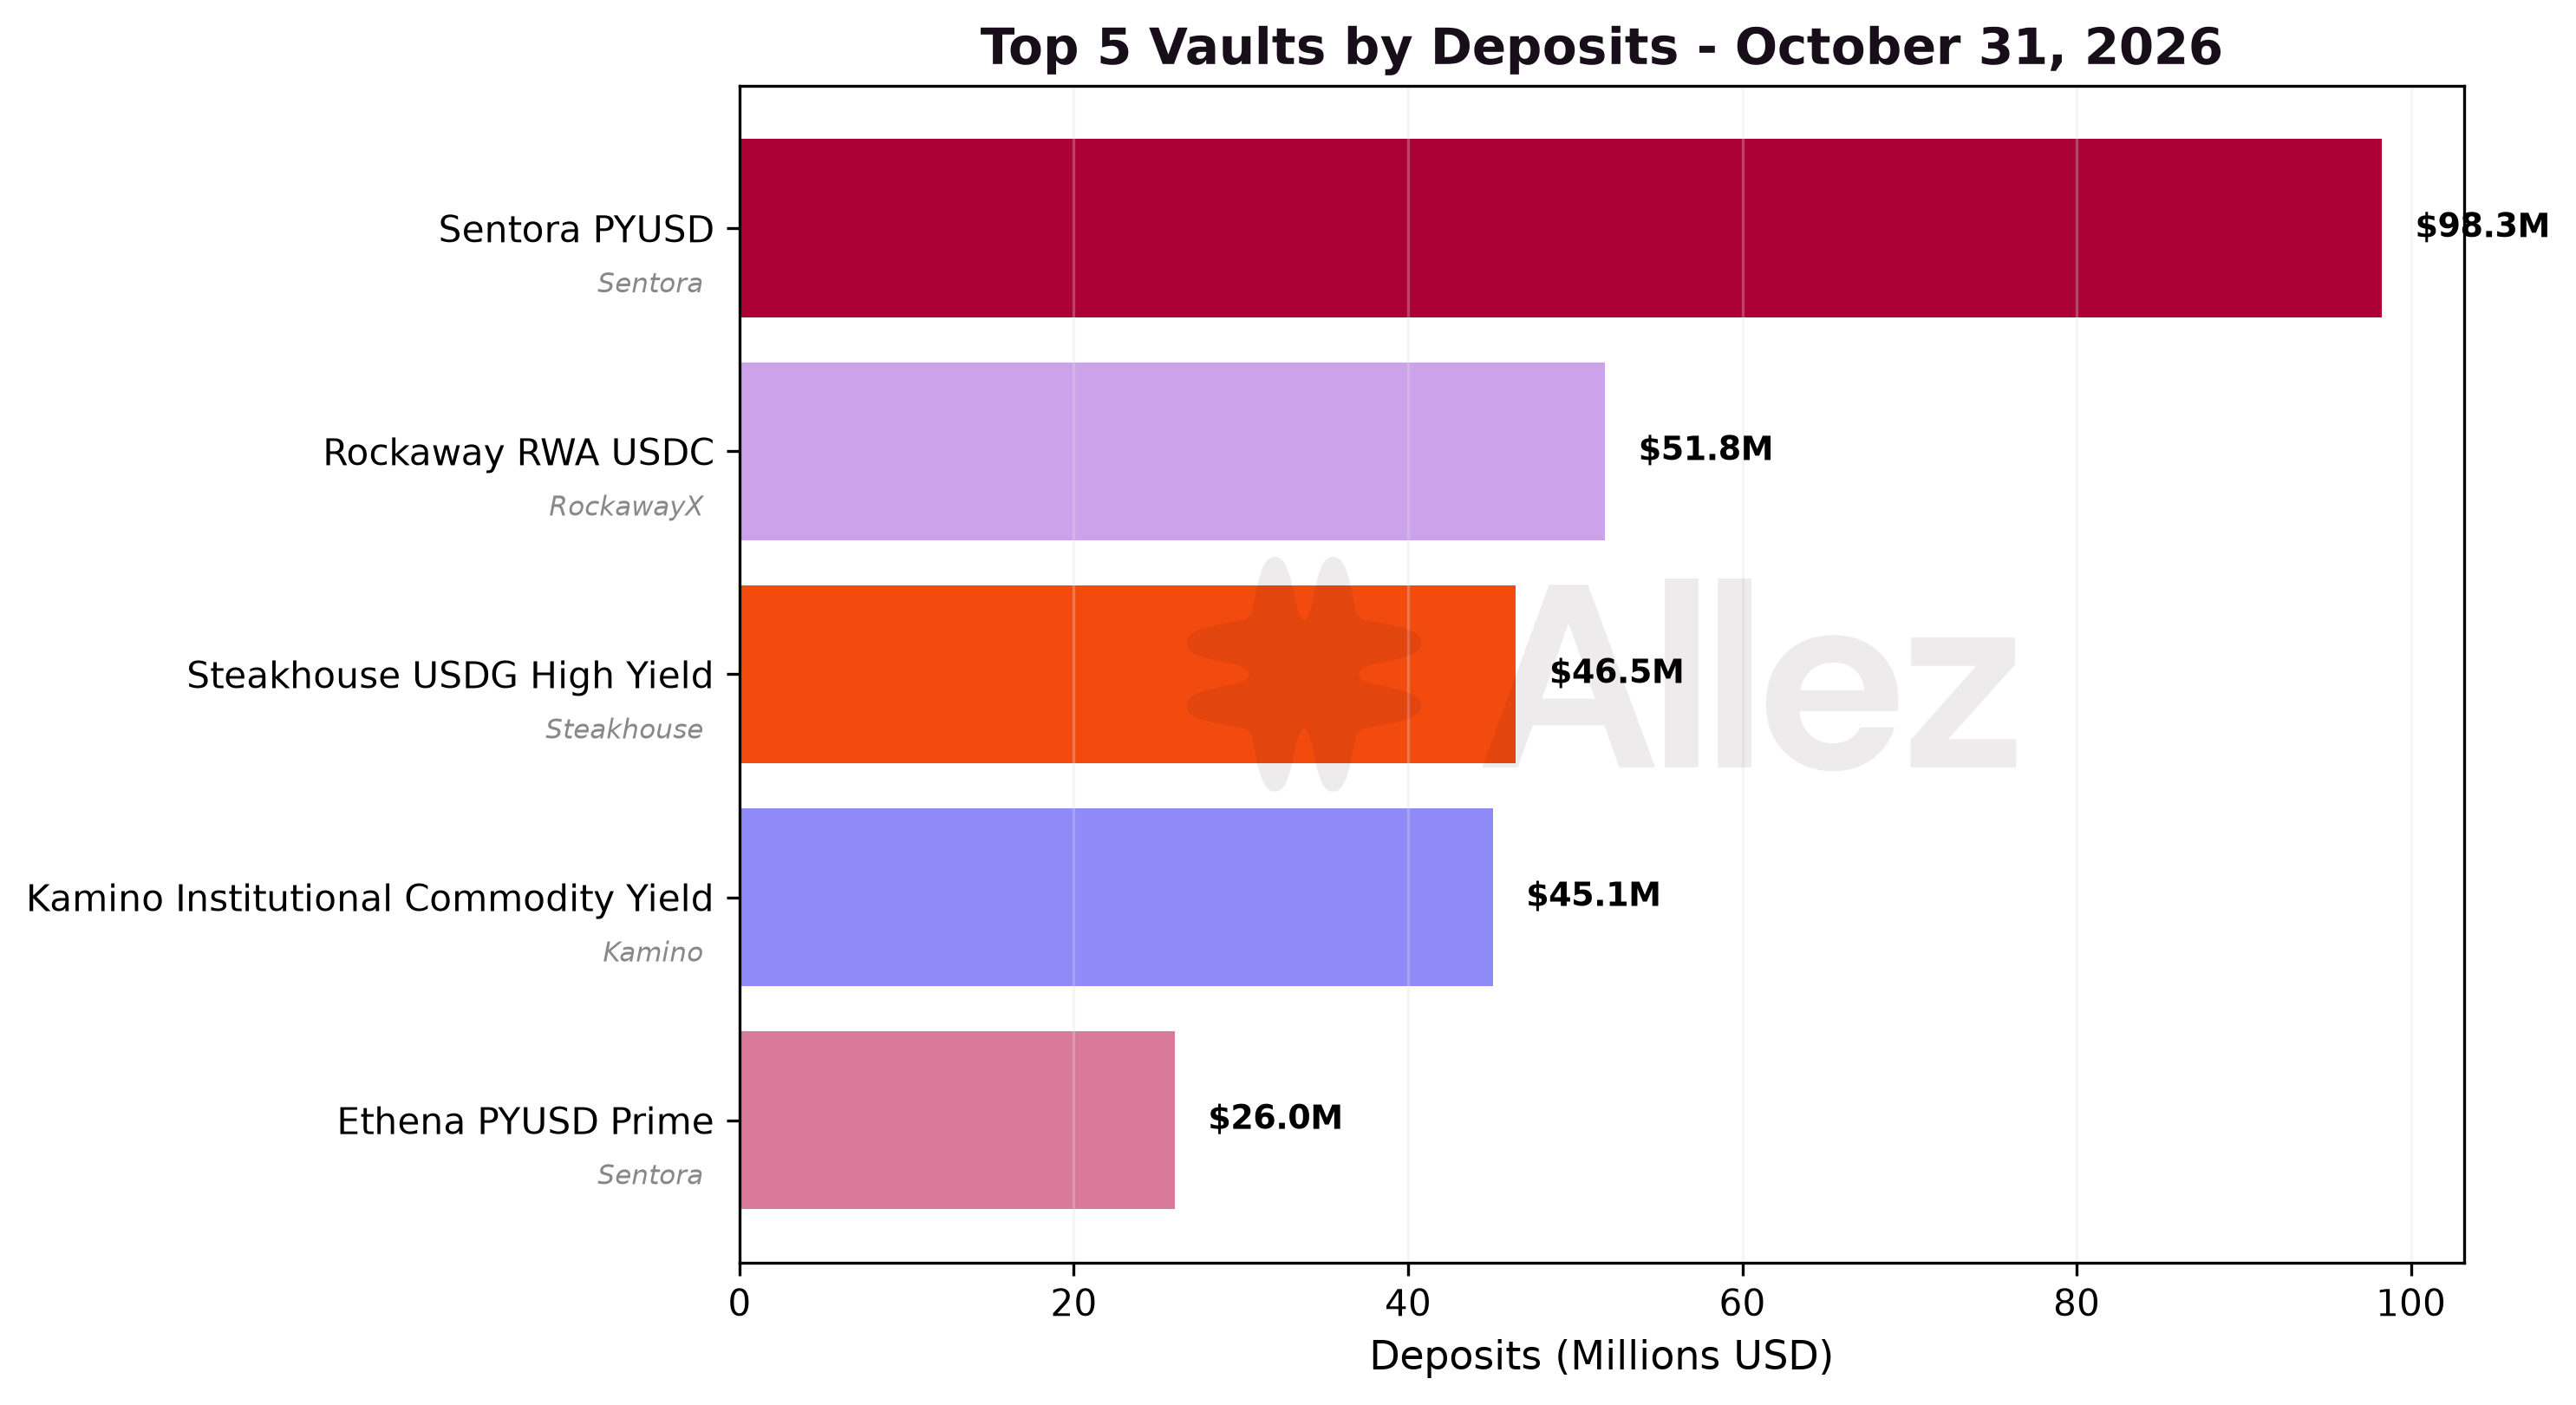
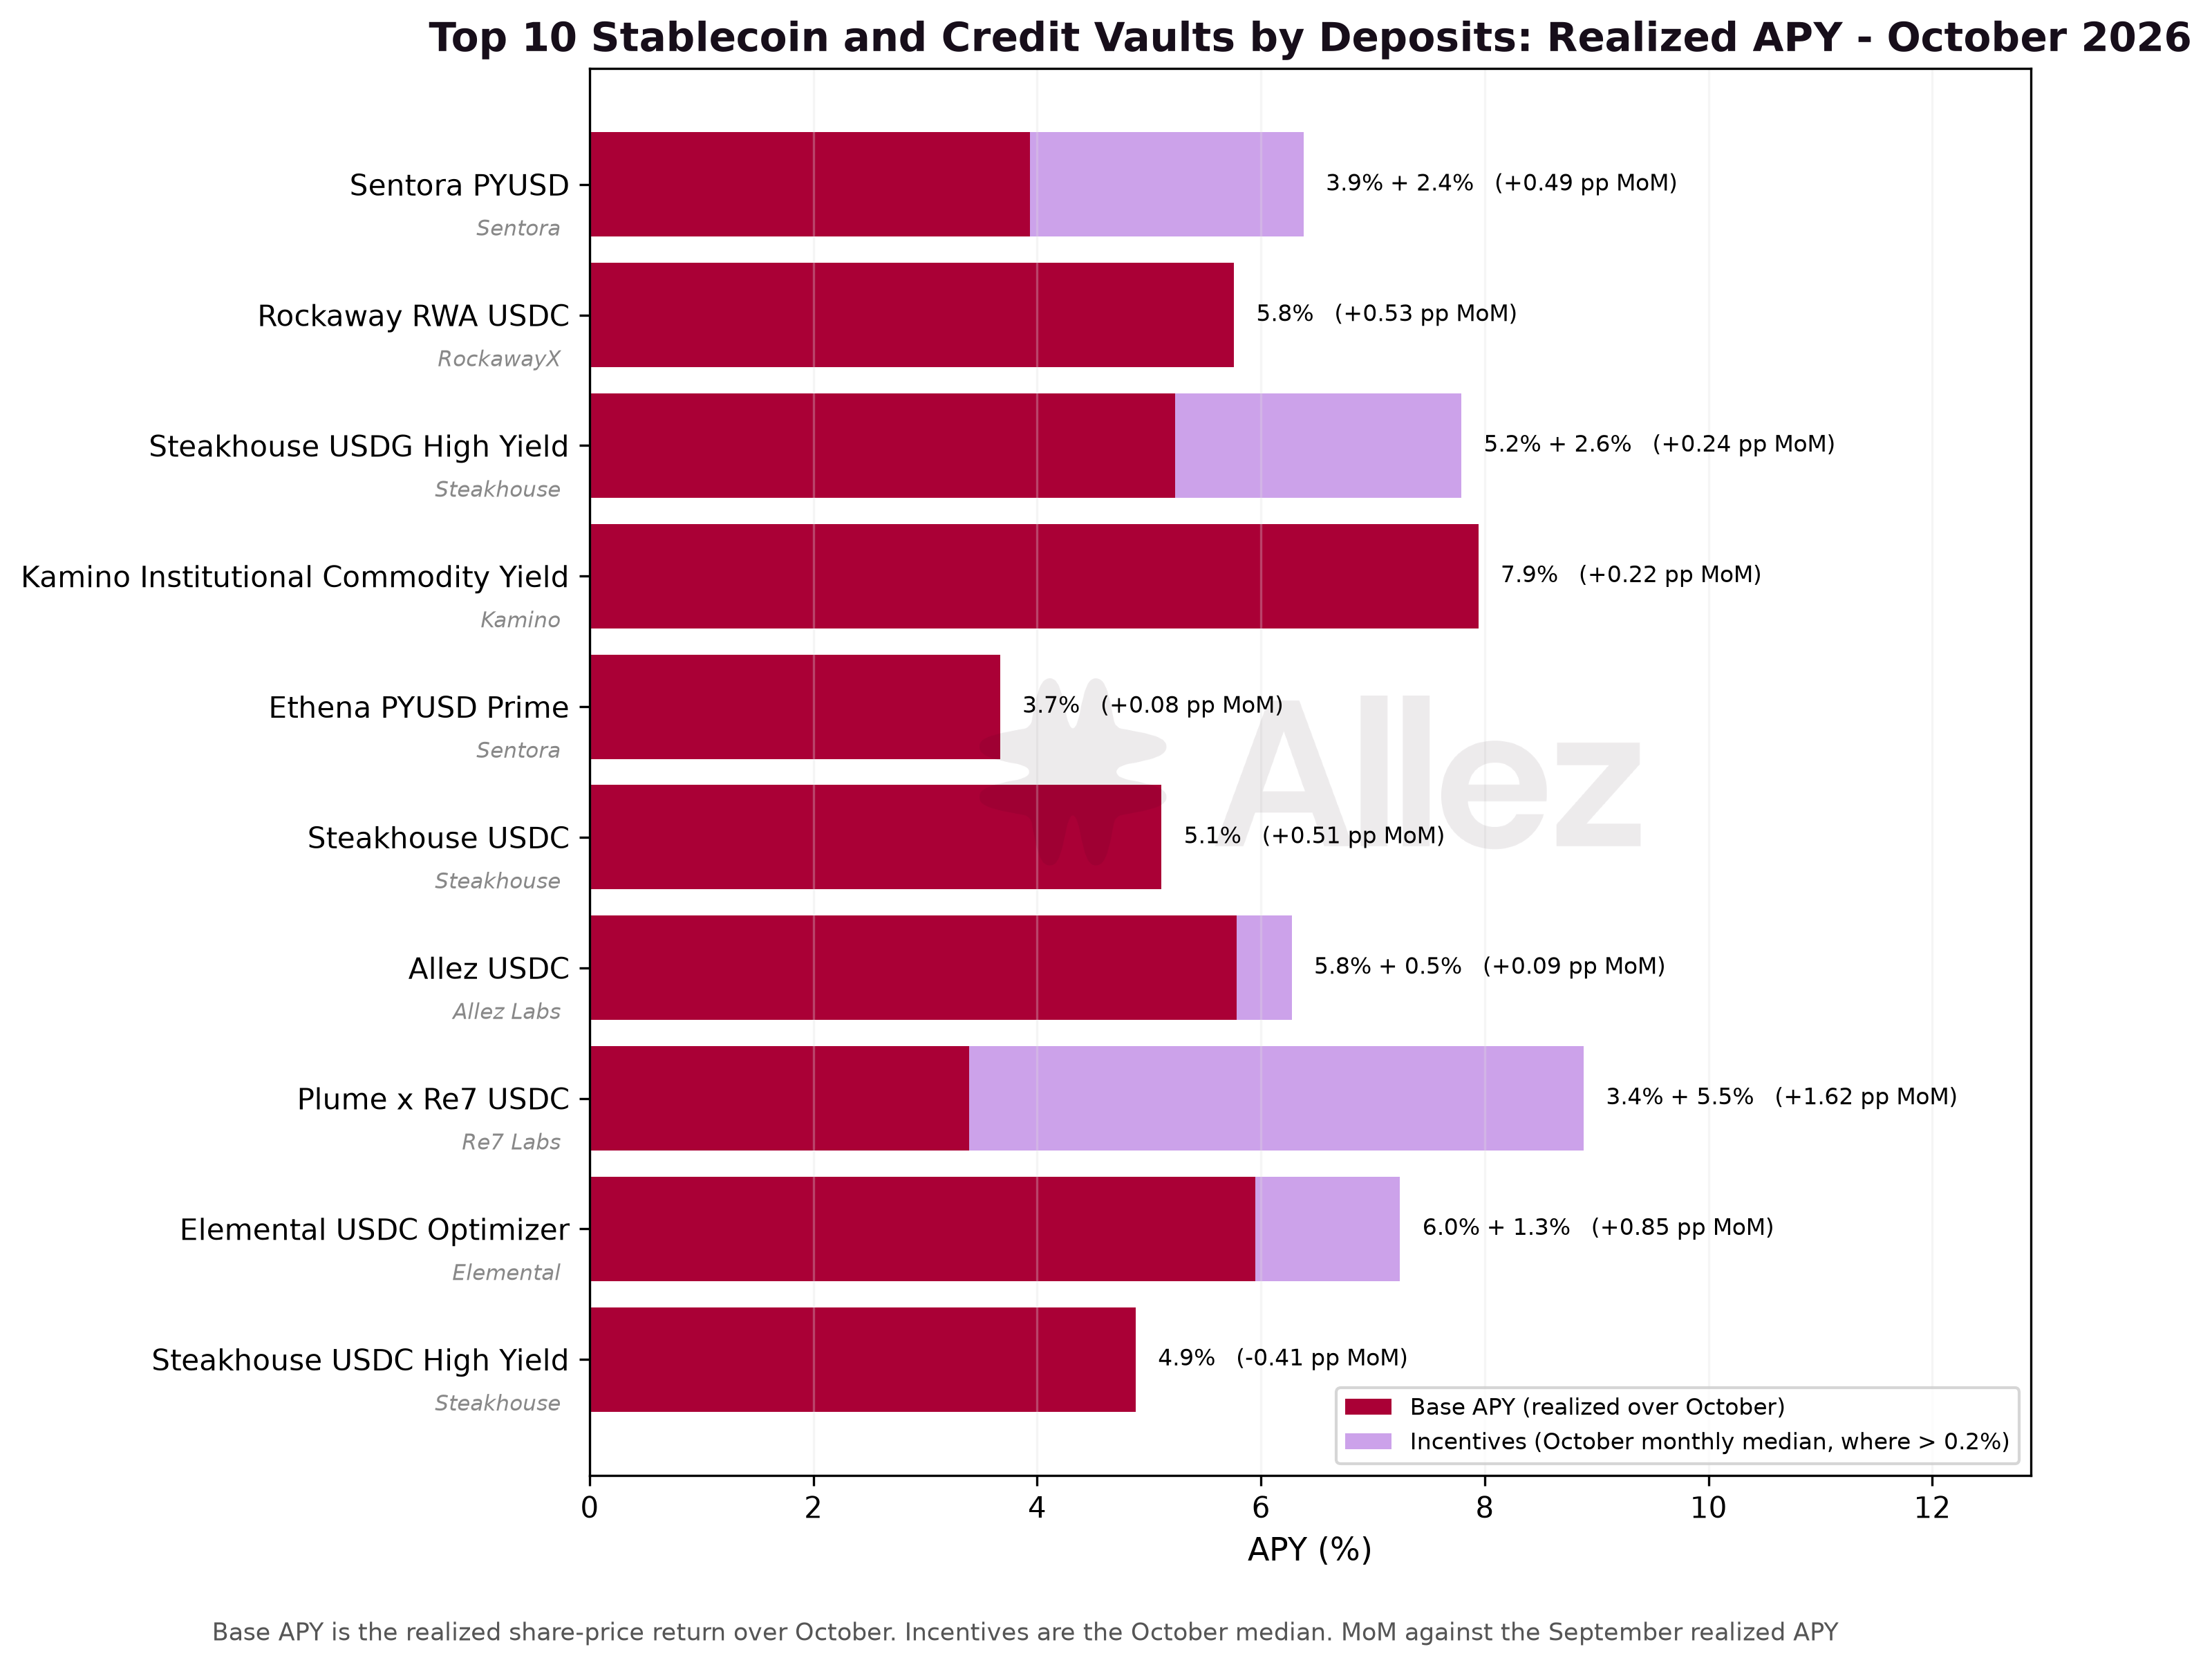
| Vault | Token | Deposits | MoM | Realized APY (October) | Incentive (Oct median) |
|---|---|---|---|---|---|
| Sentora PYUSD | PYUSD | $98.3M | -25.4% | 3.94% | +2.44% |
| Rockaway RWA USDC | USDC | $51.8M | -25.9% | 5.76% | +0.05% |
| Steakhouse USDG High Yield | USDG | $46.5M | +8.7% | 5.23% | +2.56% |
| Kamino Institutional Commodity Yield | USDC | $45.1M | -10.6% | 7.94% | none |
| Ethena PYUSD Prime | PYUSD | $26.0M | -88.0% | 3.67% | none |
| Steakhouse USDC | USDC | $16.6M | -18.4% | 5.11% | none |
| Allez USDC | USDC | $11.5M | +15.4% | 5.78% | +0.49% |
| Allez SOL | SOL | $7.9M | -24.9% | 4.41% | +0.21% |
| Plume x Re7 USDC | USDC | $7.6M | +47.3% | 3.39% | +5.49% |
Ethena PYUSD Prime fell 88.0% to $26.0M with the Ethena unwind, and Sentora PYUSD became the largest vault at $98.3M.
Kamino Institutional Commodity Yield again paid the highest yield in the table at 7.94%. Realized yields rose at Steakhouse USDC (4.60% to 5.11%), Rockaway RWA USDC (5.22% to 5.76%) and Sentora PYUSD (3.45% to 3.94%).
6. Transaction Volume
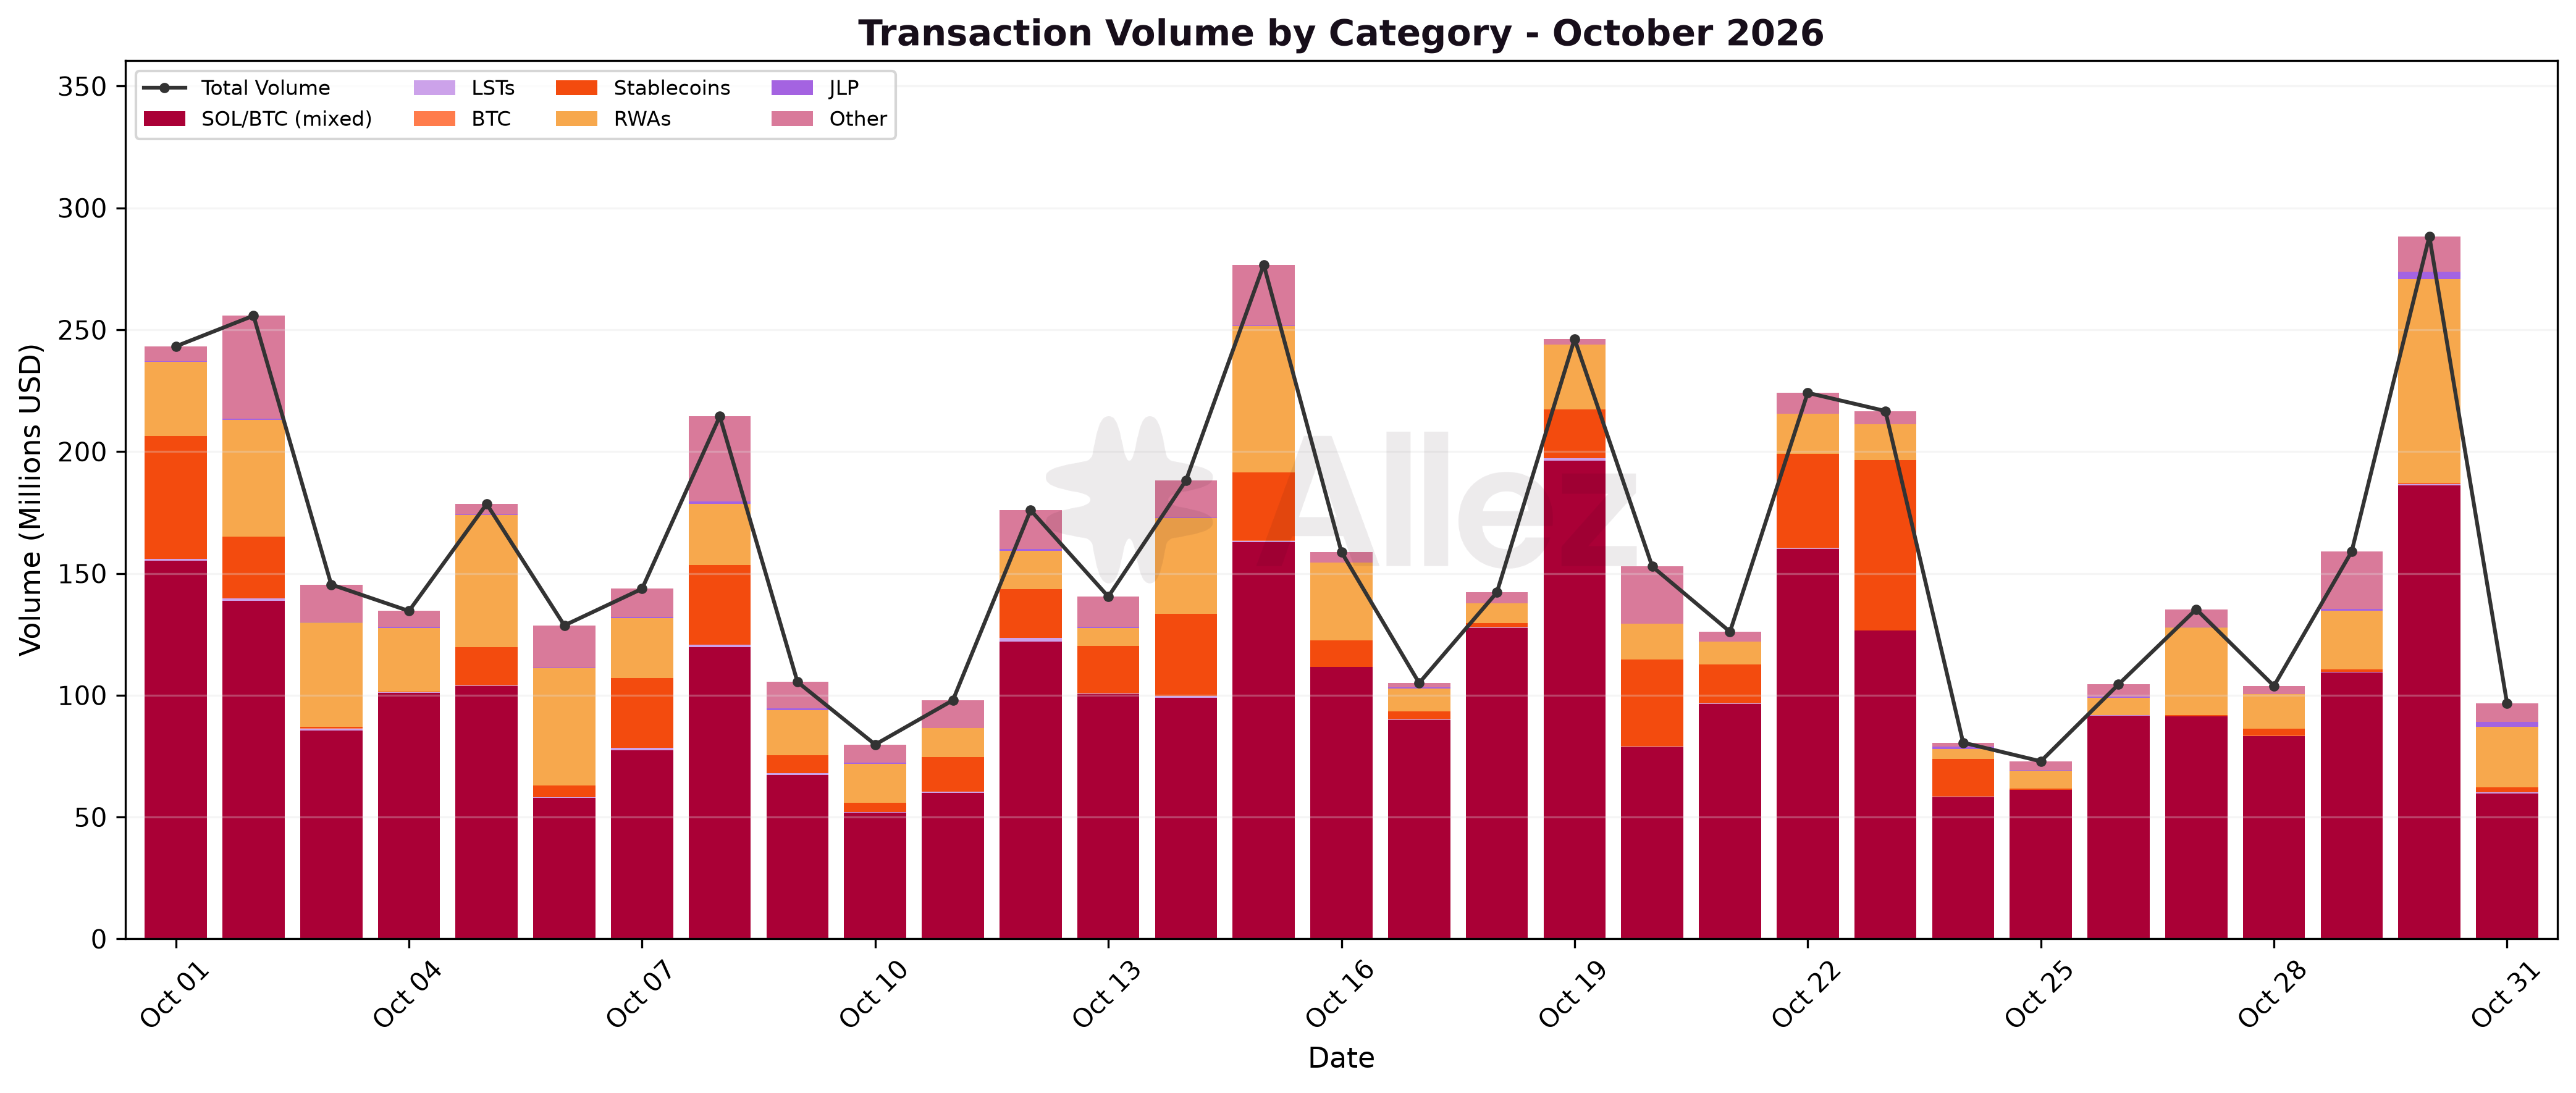
Transaction volume fell 19.2% to $4.92B, from $6.09B in September. SOL/BTC carried $3.23B, followed by Ethena at $0.50B and OnRe at $0.45B.
Volume by type:
| Type | Volume | MoM |
|---|---|---|
| Withdraw | $1.87B | -24.2% |
| Deposit | $1.74B | -28.9% |
| Repay | $0.76B | +8.6% |
| Borrow | $0.54B | +16.0% |
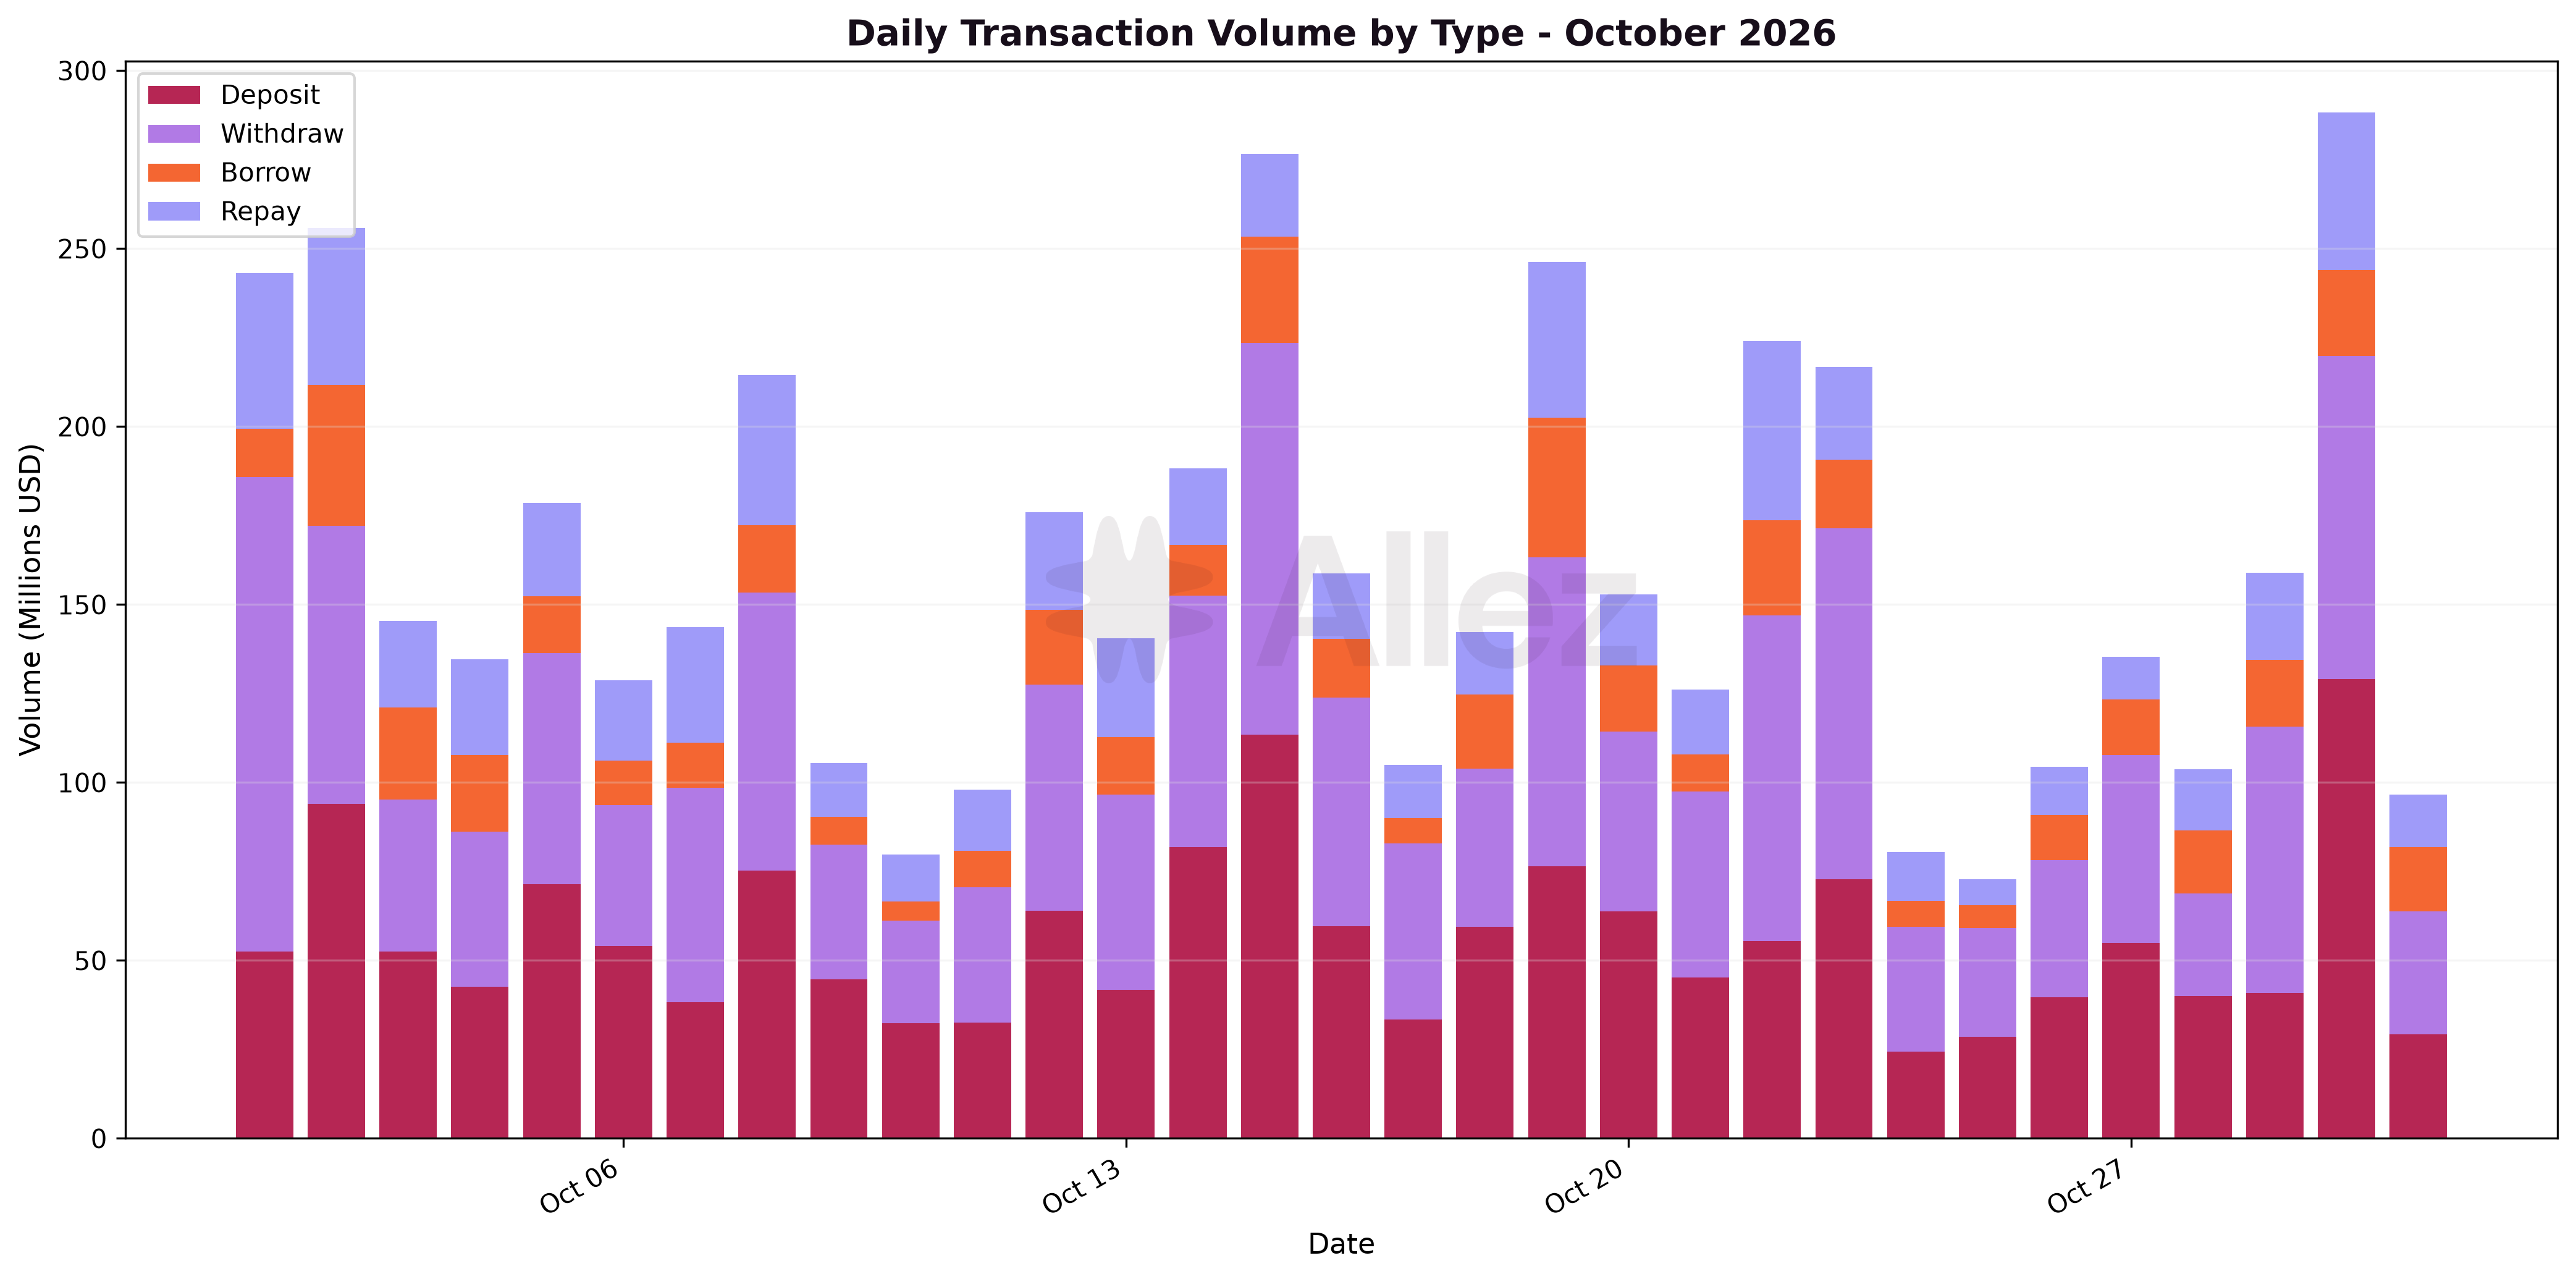
Deposits and withdrawals declined, while borrow and repay volumes rose.
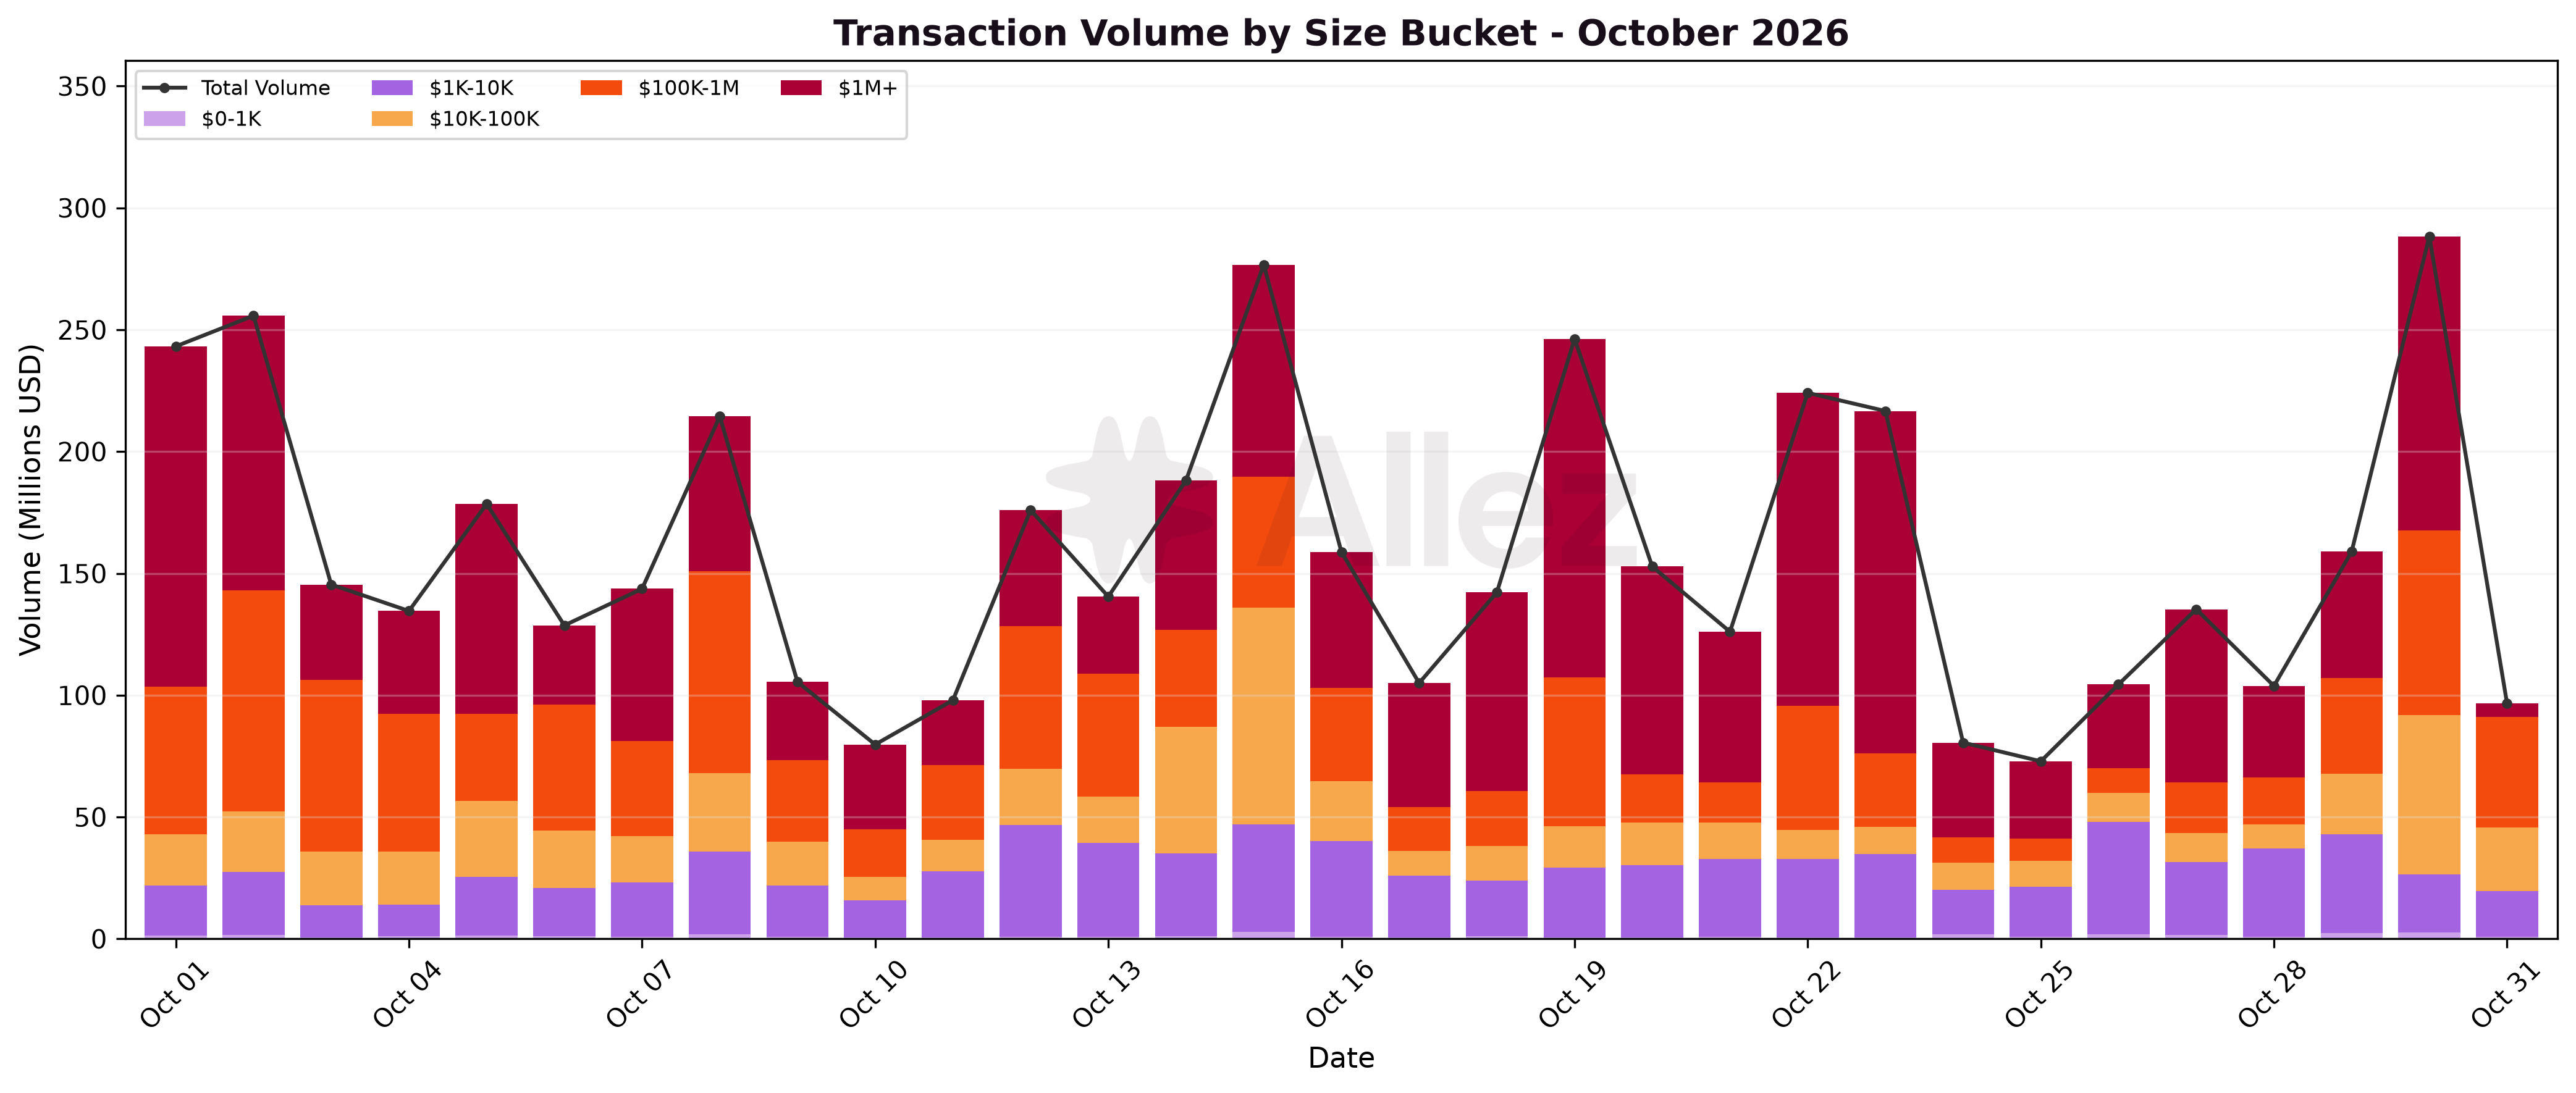
Transactions above $100K accounted for 67.0% of volume, against 79.5% in September, as the $1M+ bucket fell from $3.43B to $2.04B. Volume between $1K and $100K grew, from $1.21B to $1.59B.
Interest paid by borrowers held at $4.73M against $4.72M in September, despite lower debt. The average borrow rate was 6.24% on stablecoins and 5.94% on SOL.
7. Conclusions and Forward Look
Kamino came through a difficult October in good shape. SOL fell almost 20% and the Ethena market unwound most of its positions, yet liquidations stayed small and orderly, including during the October 29 and 30 selloff.
SOL-backed positions moved closer to their liquidation thresholds as the price fell. The buffer remains comfortable. On-chain SOL liquidity can absorb liquidations through a much larger decline, and the stress test shows almost no bad debt down to a 30% drop.
Growth came from new products. Fixed Rates nearly quadrupled in its first full month, and Auto Rollover renewed the first loans to mature.
Outlook
For November, we will watch three areas:
-
Fixed Rates renewals, as more loans reach maturity and test Auto Rollover at scale.
-
The new Backpack market, which brings tokenized equities as collateral.
-
The largest SOL positions, which moved closer to liquidation as SOL fell. The largest now liquidates after a drop of about 20%.
Appendix: Asset Category Classification
| Category | Month-end Supply | Share | Supply MoM | Representative assets |
|---|---|---|---|---|
| Stablecoins | $680.9M | 29.9% | -37.3% | USDC, PYUSD, USDG, USDe, USDT, USDS, USX, CASH |
| RWAs | $694.6M | 30.5% | +5.6% | ONyc, AUTO, PRIME, wYLDS, syrupUSDC, PST, reUSD, tokenized stocks |
| LSTs | $505.8M | 22.2% | -15.9% | dSOL, dfdvSOL, JitoSOL, jupSOL, mSOL, hSOL, INF |
| SOL | $264.1M | 11.6% | -15.6% | SOL |
| BTC | $68.0M | 3.0% | -21.6% | cbBTC, xBTC, WBTC, zBTC, fBTC |
| Other | $60.6M | 2.7% | -8.5% | JLP, ETH, ZEC, HYPE, BONK, JUP, KMNO |
Classification notes: LSTs are Solana liquid-staking tokens representing staked SOL. This covers tokens ending in SOL other than SOL itself, plus INF. RWAs are tokenized real-world assets, including private-credit tokens (PRIME, syrupUSDC), insurance tokens (ONyc) and tokenized equities. From October, we classify the Institutional CY market collateral and the Backpack tokenized equities (MU, SKHY, SPCX, SNDK) as RWAs. Stablecoins are USD-pegged tokens. Exponent PT tokens take the category of their underlying.
Methodology notes
Distance to liquidation (DTL). For each collateral-debt pair, DTL is the percentage move in the collateral price against the debt price that would bring the position to its liquidation threshold. Uncorrelated pairs (such as SOL against USDC) use wider tiers than correlated pairs (such as an LST against SOL), because correlated prices rarely diverge by much.
On-chain exit depth. Depth is the amount of SOL that can be sold into USDC through Jupiter's aggregated routing within a given price impact, quoted at the time of writing. The cascade model sells, at each SOL price drop, the collateral liquidators would seize from positions crossing their thresholds. Depth is quoted for a single swap and does not include liquidity that returns between blocks.
This report represents independent risk analysis by Allez Labs for the Kamino Finance community.
Prepared by: Allez Labs Risk Team
Report Date: October 31, 2026
Next Report: November 2026 Monthly Report published in December 2026