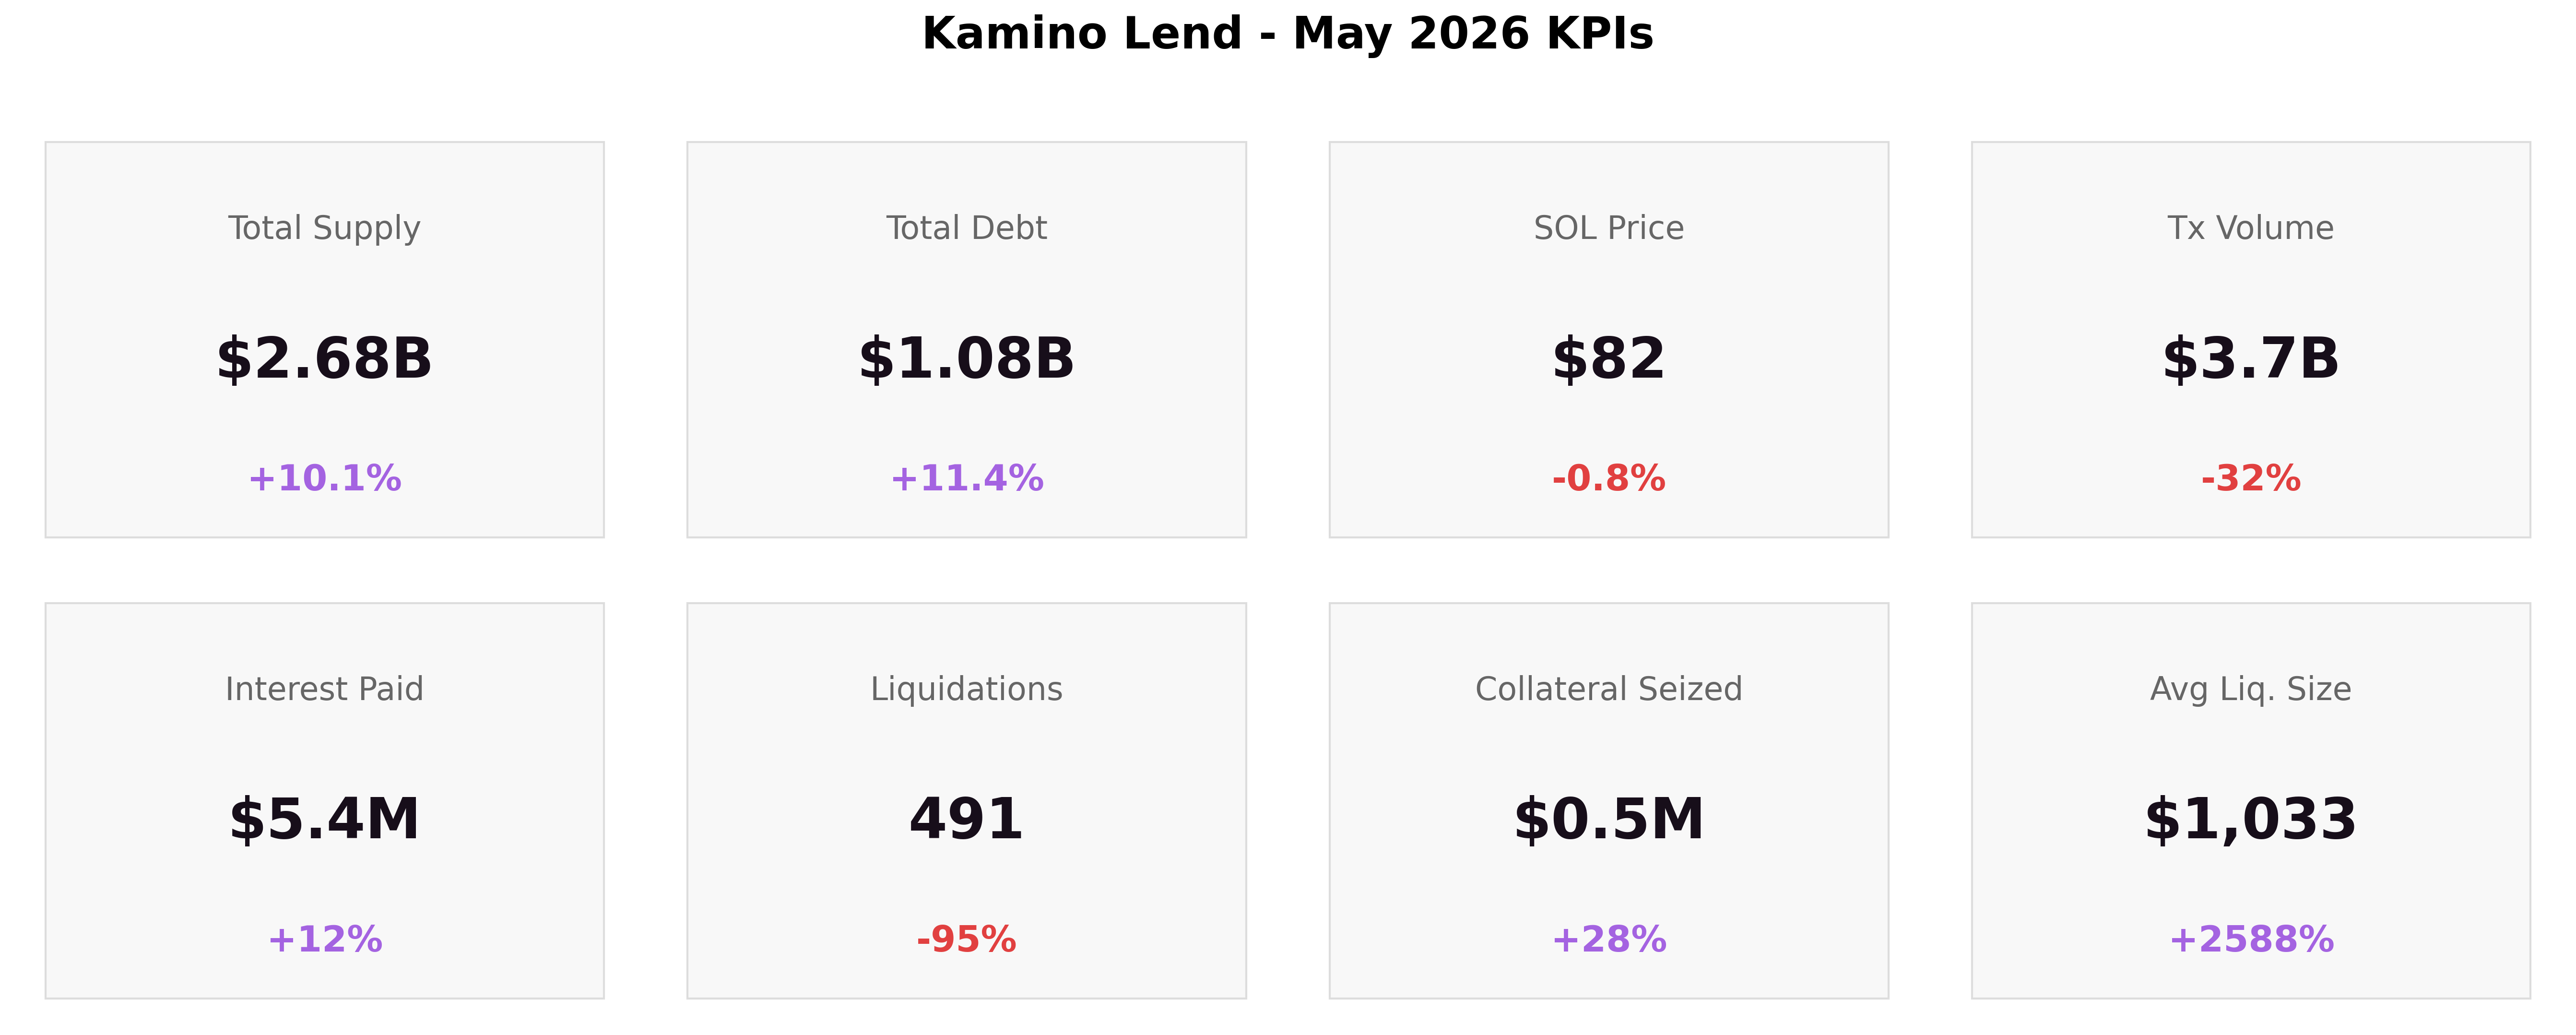
May was a strong month for the protocol, with total supply rising 10.1% to $2.68B and total debt increasing 11.4% to $1.08B. Growth was led by stablecoins, particularly the newly launched Ethena USDe/USDG market, which reached $483.2M by month-end and became the protocol’s second-largest market. While volatile markets generally deleveraged, several specialized markets also expanded meaningfully, including OnRe, xStocks, and Solstice. Protocol health remained solid through the shift. Liquidations were minimal, SOL traded in a narrow $81–$96 range, and the Ethena market was launched with a stricter risk framework, including isolated deployment, a 1:1 USDe/USDT oracle, a ±1% pause band, and enhanced bridge-security standards.
1. Market Context & SOL Price
The Ethena Market launch lifted Kamino through the month of May. Protocol utilization held steady at 40.5%, and the month was stable on every other axis: liquidations were minimal and SOL traded in a narrow band.
-
Total Supply: $2.68B (+10.1%)
-
Total Debt: $1.08B (+11.4%)
-
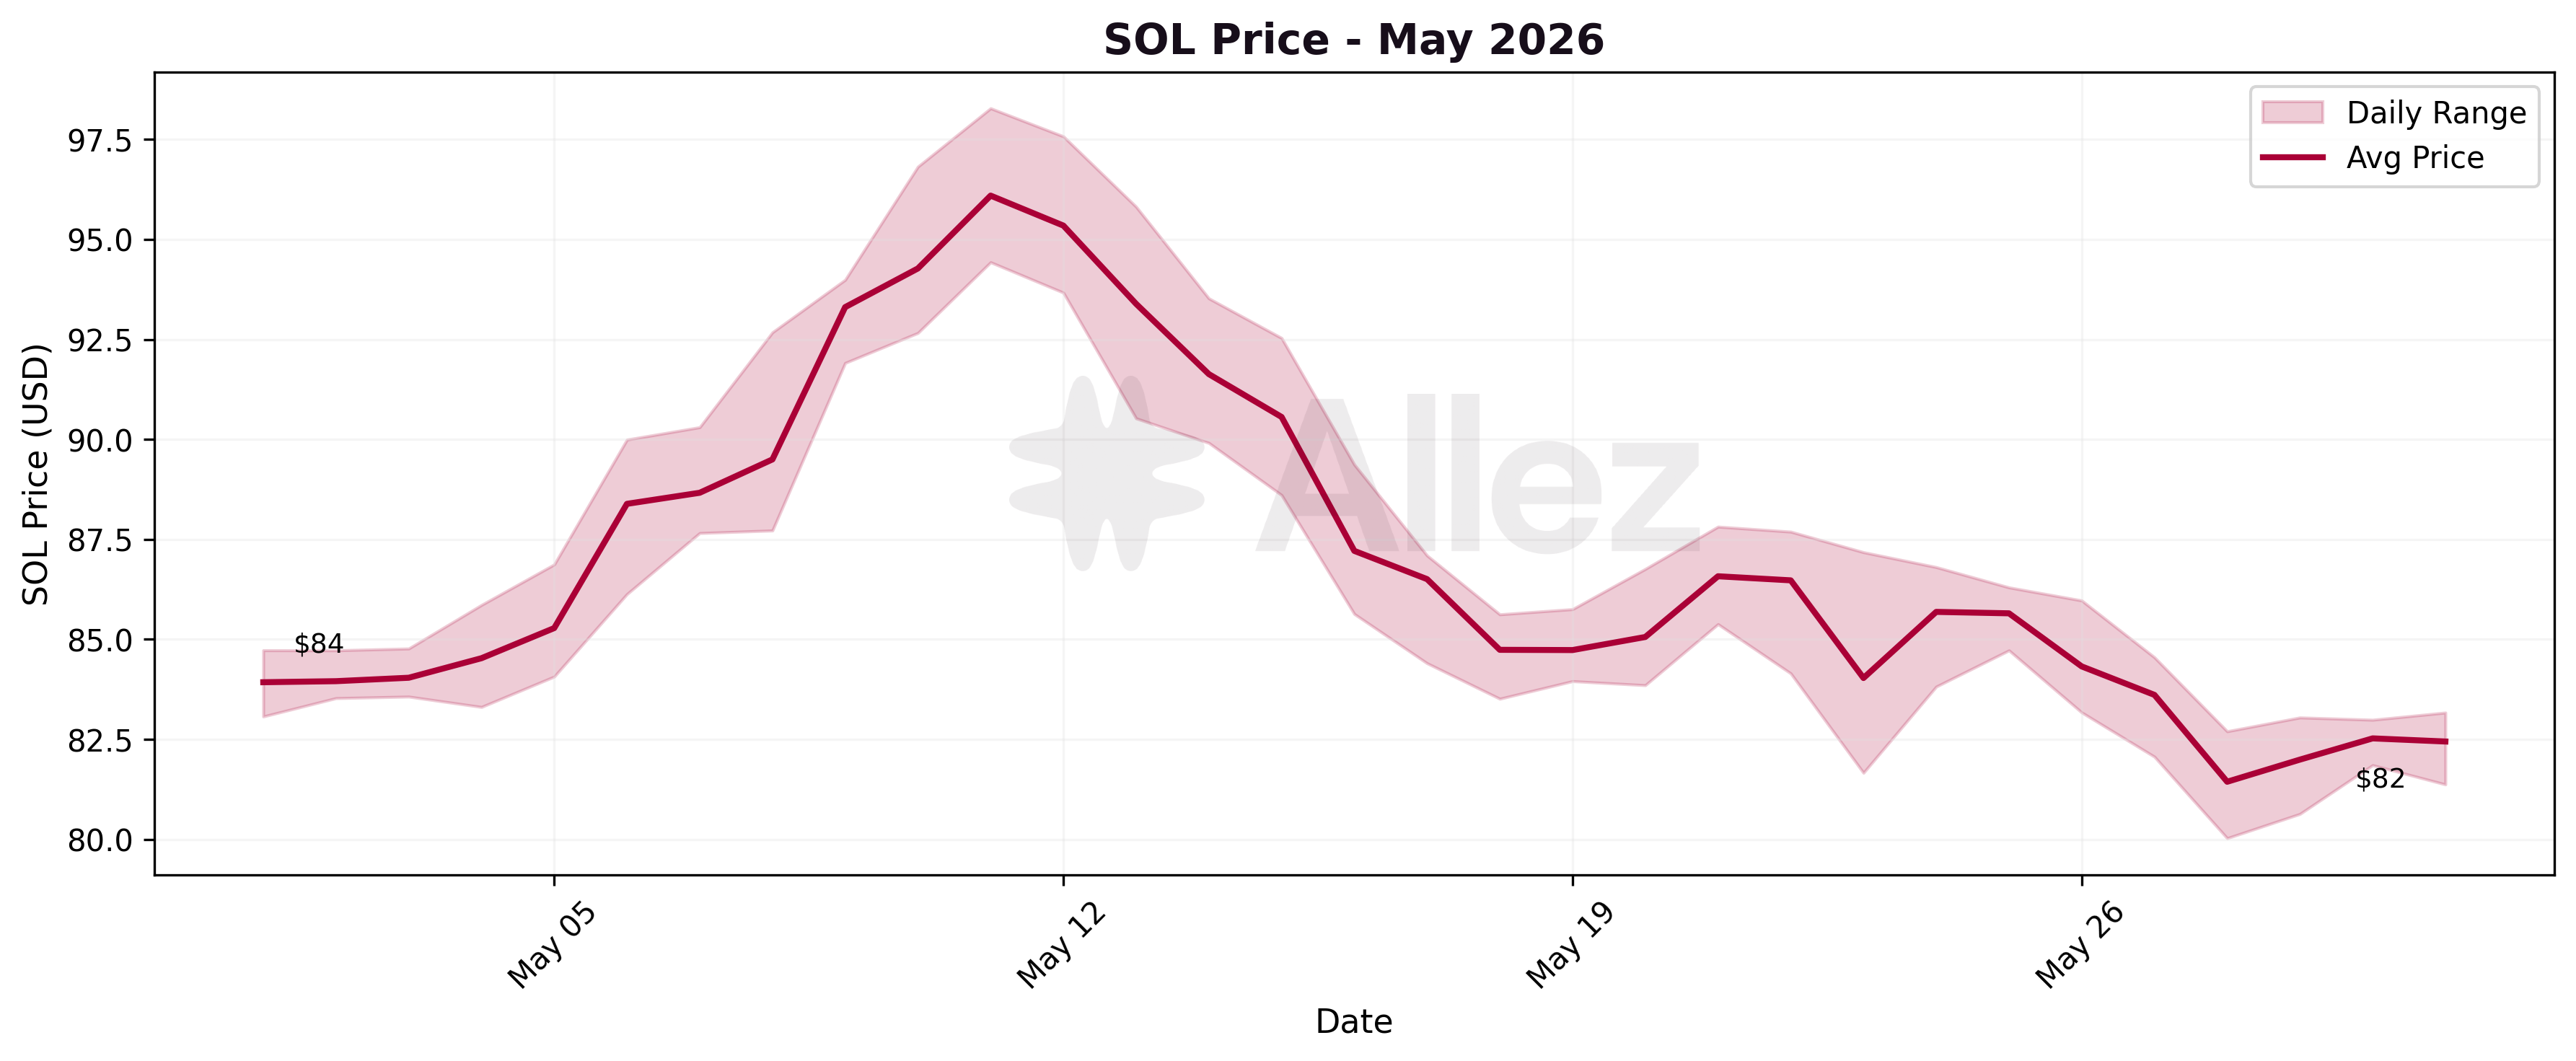
SOL Price: $82 (-0.8% MoM)
-
Transaction Volume: $3.75B (-32%)
-
Interest Paid: $5.36M (+12% MoM)
-
Liquidations: 491 (-95%)
-
Collateral Seized: $0.51M (+27%)
-
Avg Liquidation Size: $1,033
SOL opened the month at $83.93 and closed at $82.45, with daily prices between $81.44 and $96.10. Against April's $83.09 close that is -0.8% month-over-month, effectively flat.
Interest paid rose +12% to $5.36M: average daily debt grew around +5% MoM (to $1.08B) as the Ethena market scaled mid-month, and the implied protocol-wide average borrow rate firmed to ~5.9%, the combination accounting for the interest increase. Meanwhile transaction volume of $3.75B continued a multi-month decline, down -32% from April's $5.5B.
Kamino Ecosystem Updates:
-
Ethena market launched May 13, an isolated one-click Multiply venue looping Ethena’s yield bearing USDe against USDG up to 12.5x for the yield spread (Kamino, May 13). Within a day it passed $400M supply and hit its $200M USDG borrow cap (Kamino, May 14).
-
STRCx market launched May 28 with up to 2x leverage, 50% maximum LTV and a 65% liquidation threshold (Kamino, May 28).
-
Pyth oracle outage May 22, a network-wide Pyth outage halted price production for several hours, absorbed by Kamino Scope Oracle infra without incident.
-
xStocks borrow-incentive campaign went live May 14: $50K in USDC borrow rewards across xStocks assets (SPYx, TSLAx and others) over three months (Kamino, May 14).
-
Credit Mode on XPlace, powered by Kamino, introduced May 20, letting users borrow against assets while retaining exposure and yield (Kamino, May 20).
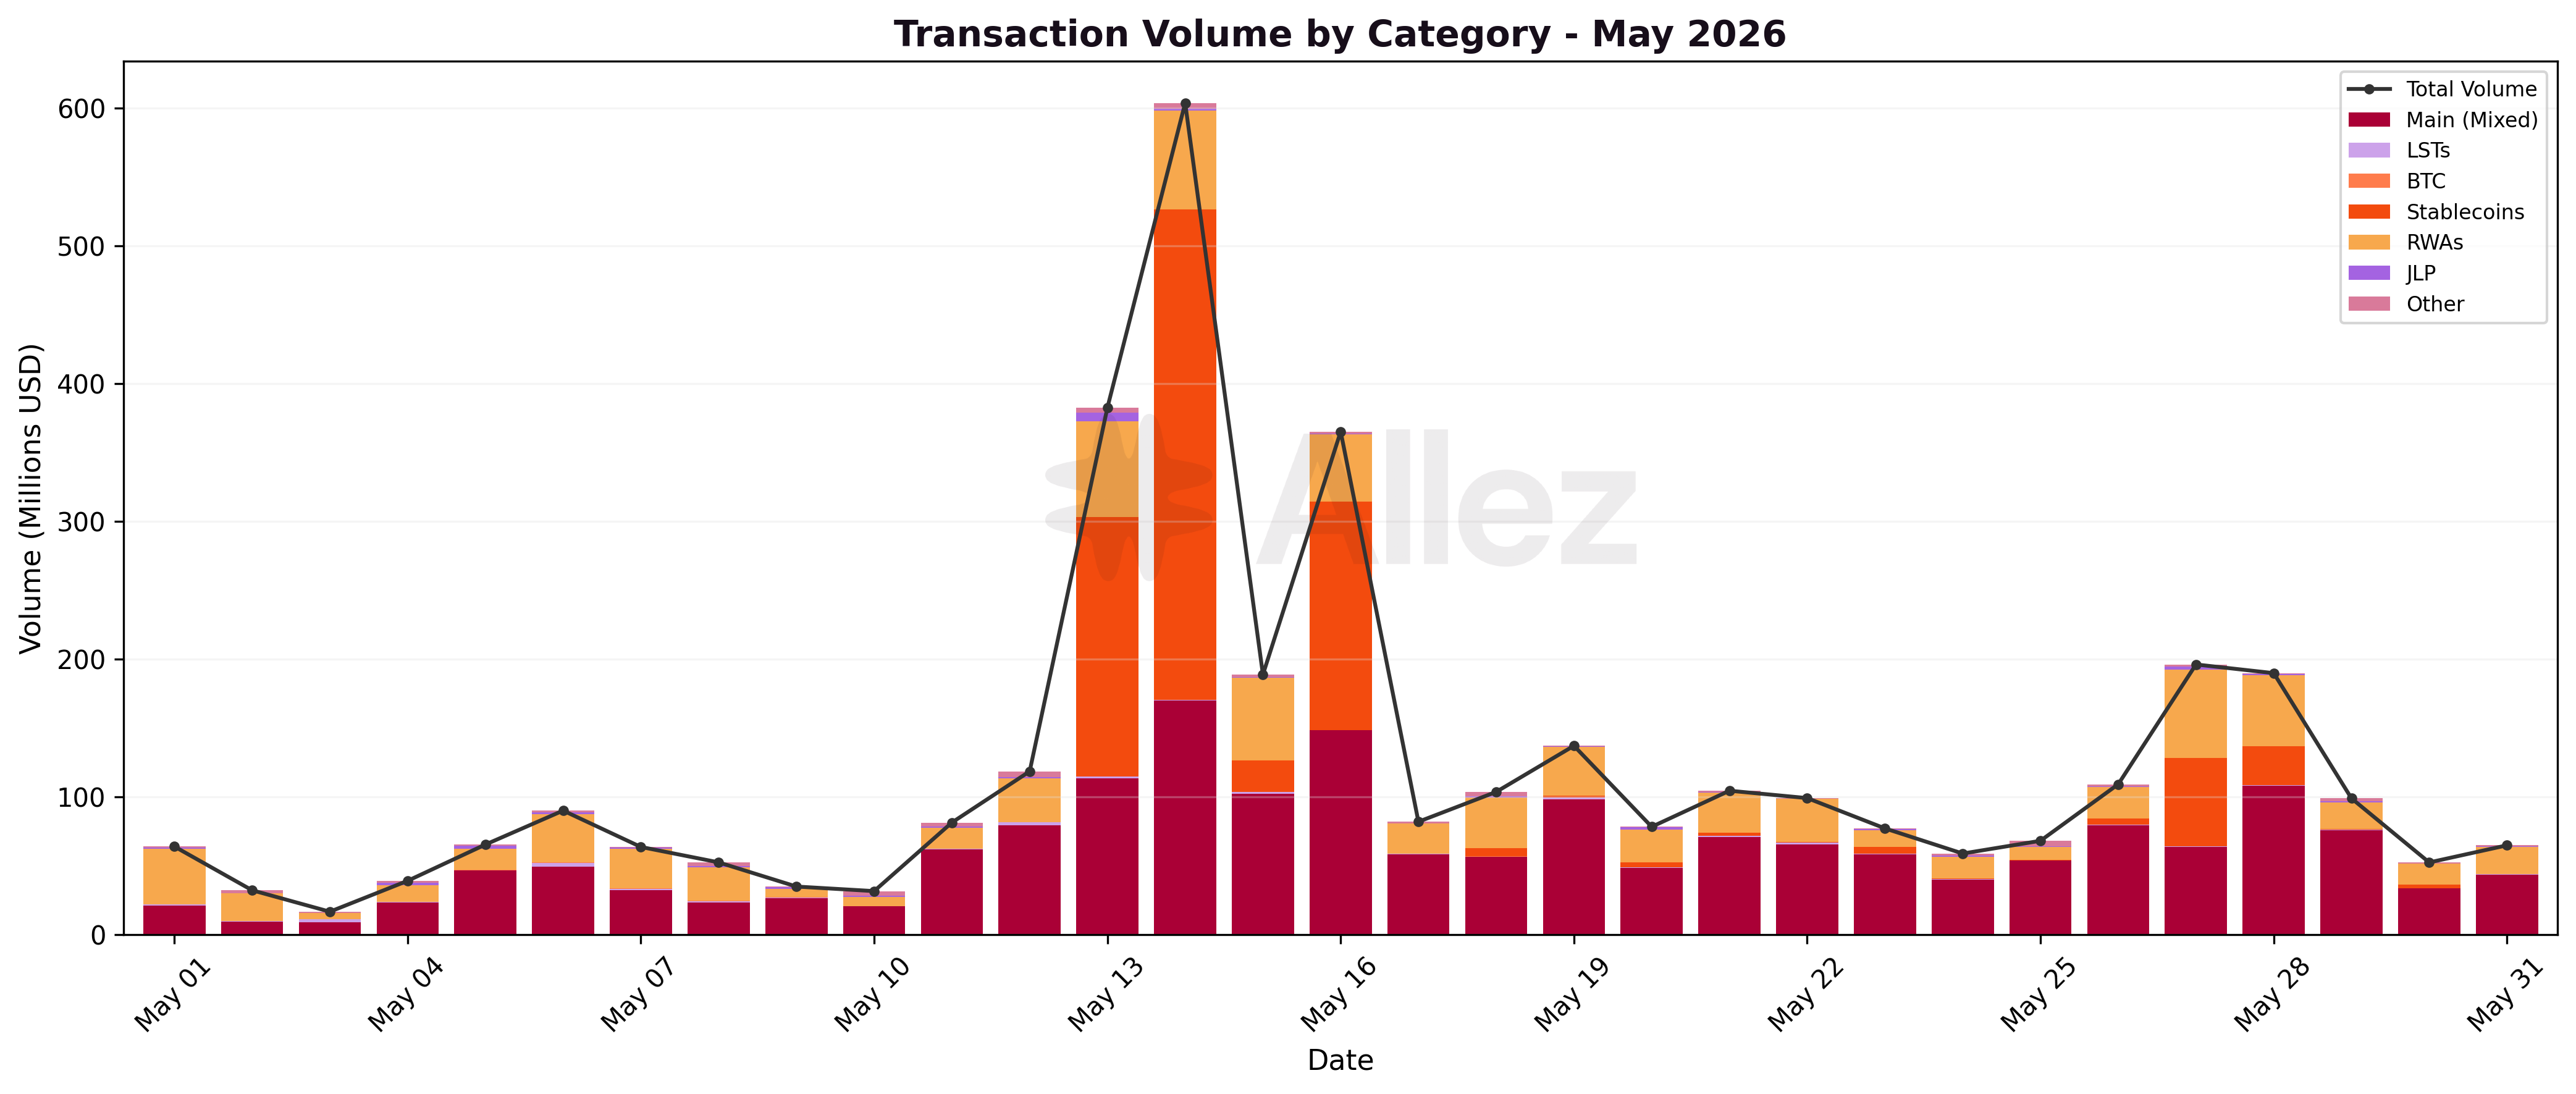
2. Macro View: Liquidity by Category
| Category | Supply | Share | Supply MoM | Debt | Debt Share | Debt MoM |
|---|---|---|---|---|---|---|
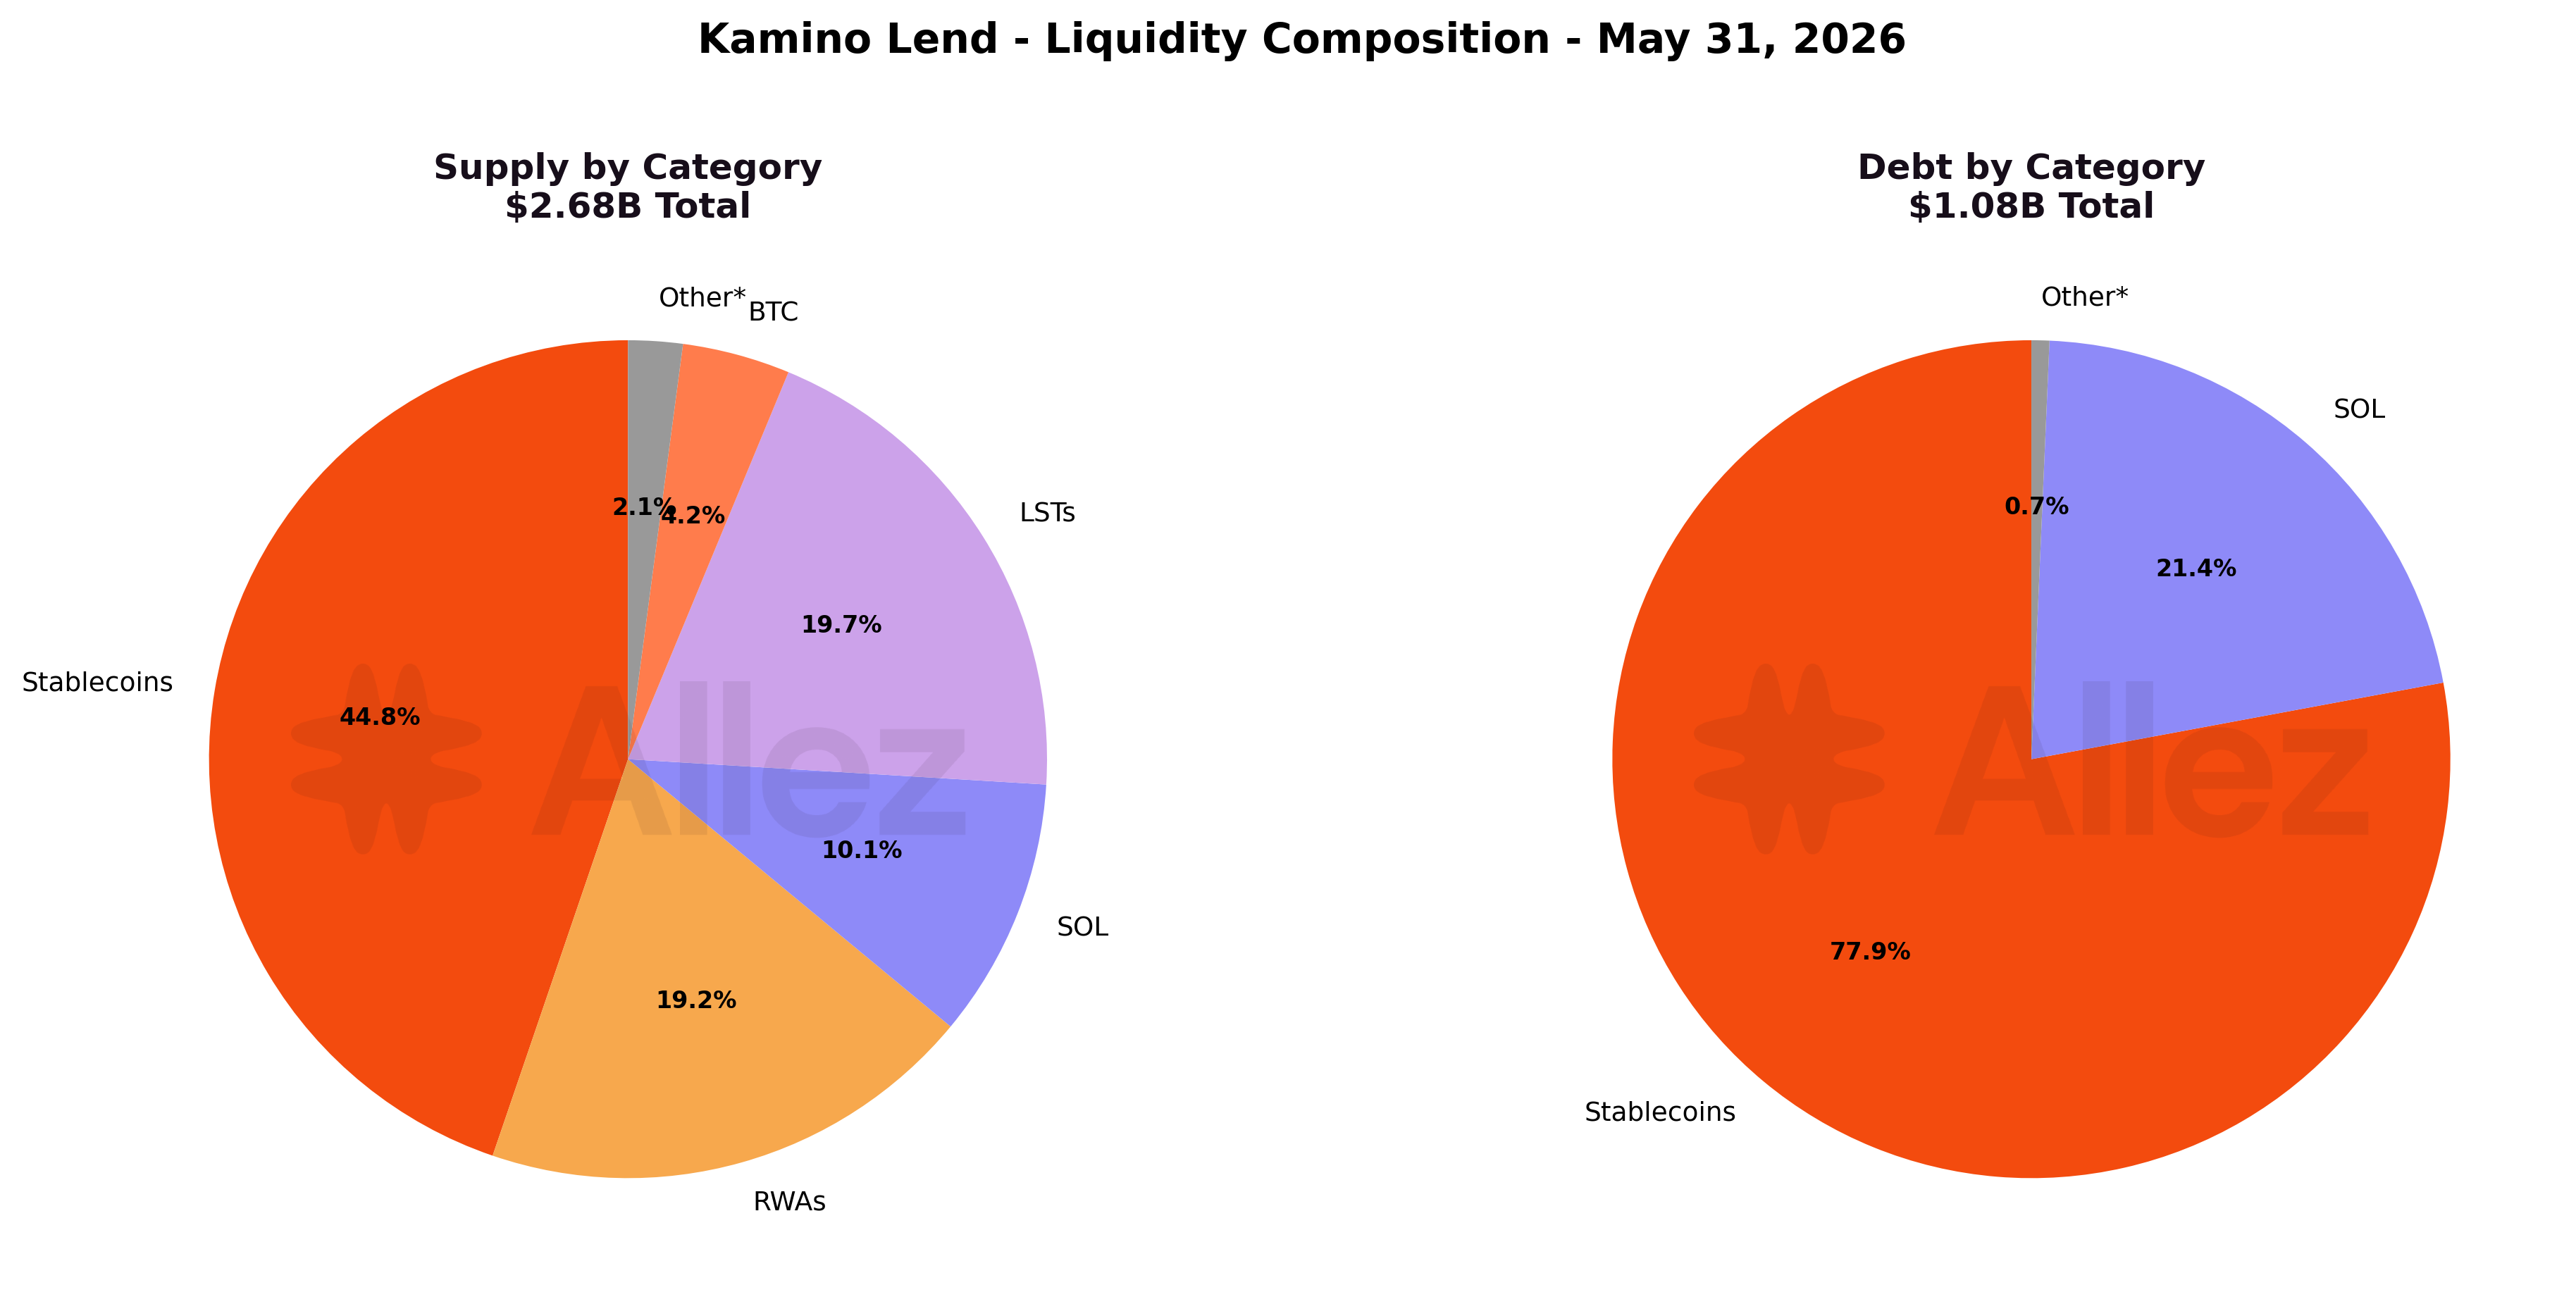
| Stablecoins | $1,198.4M | 44.8% | +49.4% | $845.3M | 77.9% | +17.9% |
| LSTs | $527.7M | 19.7% | -14.9% | $2.1M | 0.2% | -1.9% |
| RWAs | $514.6M | 19.2% | -7.9% | $0.4M | 0.0% | +31.3% |
| SOL | $269.1M | 10.1% | -2.7% | $232.0M | 21.4% | -7.5% |
| BTC | $111.3M | 4.2% | -1.8% | $3.2M | 0.3% | +0.0% |
| Other | $56.1M | 2.1% | -7.1% | $1.8M | 0.2% | +143.8% |
In May, Kamino liquidity experienced a major shift: the stablecoin share moved from 33% to 44.8% of supply, adding +$396M, while every other category contracted. The net supply increase (+$246M) is entirely stablecoin driven with net of outflows elsewhere: LSTs -$93M, RWAs -$44M, SOL -$8M, BTC -$2M.
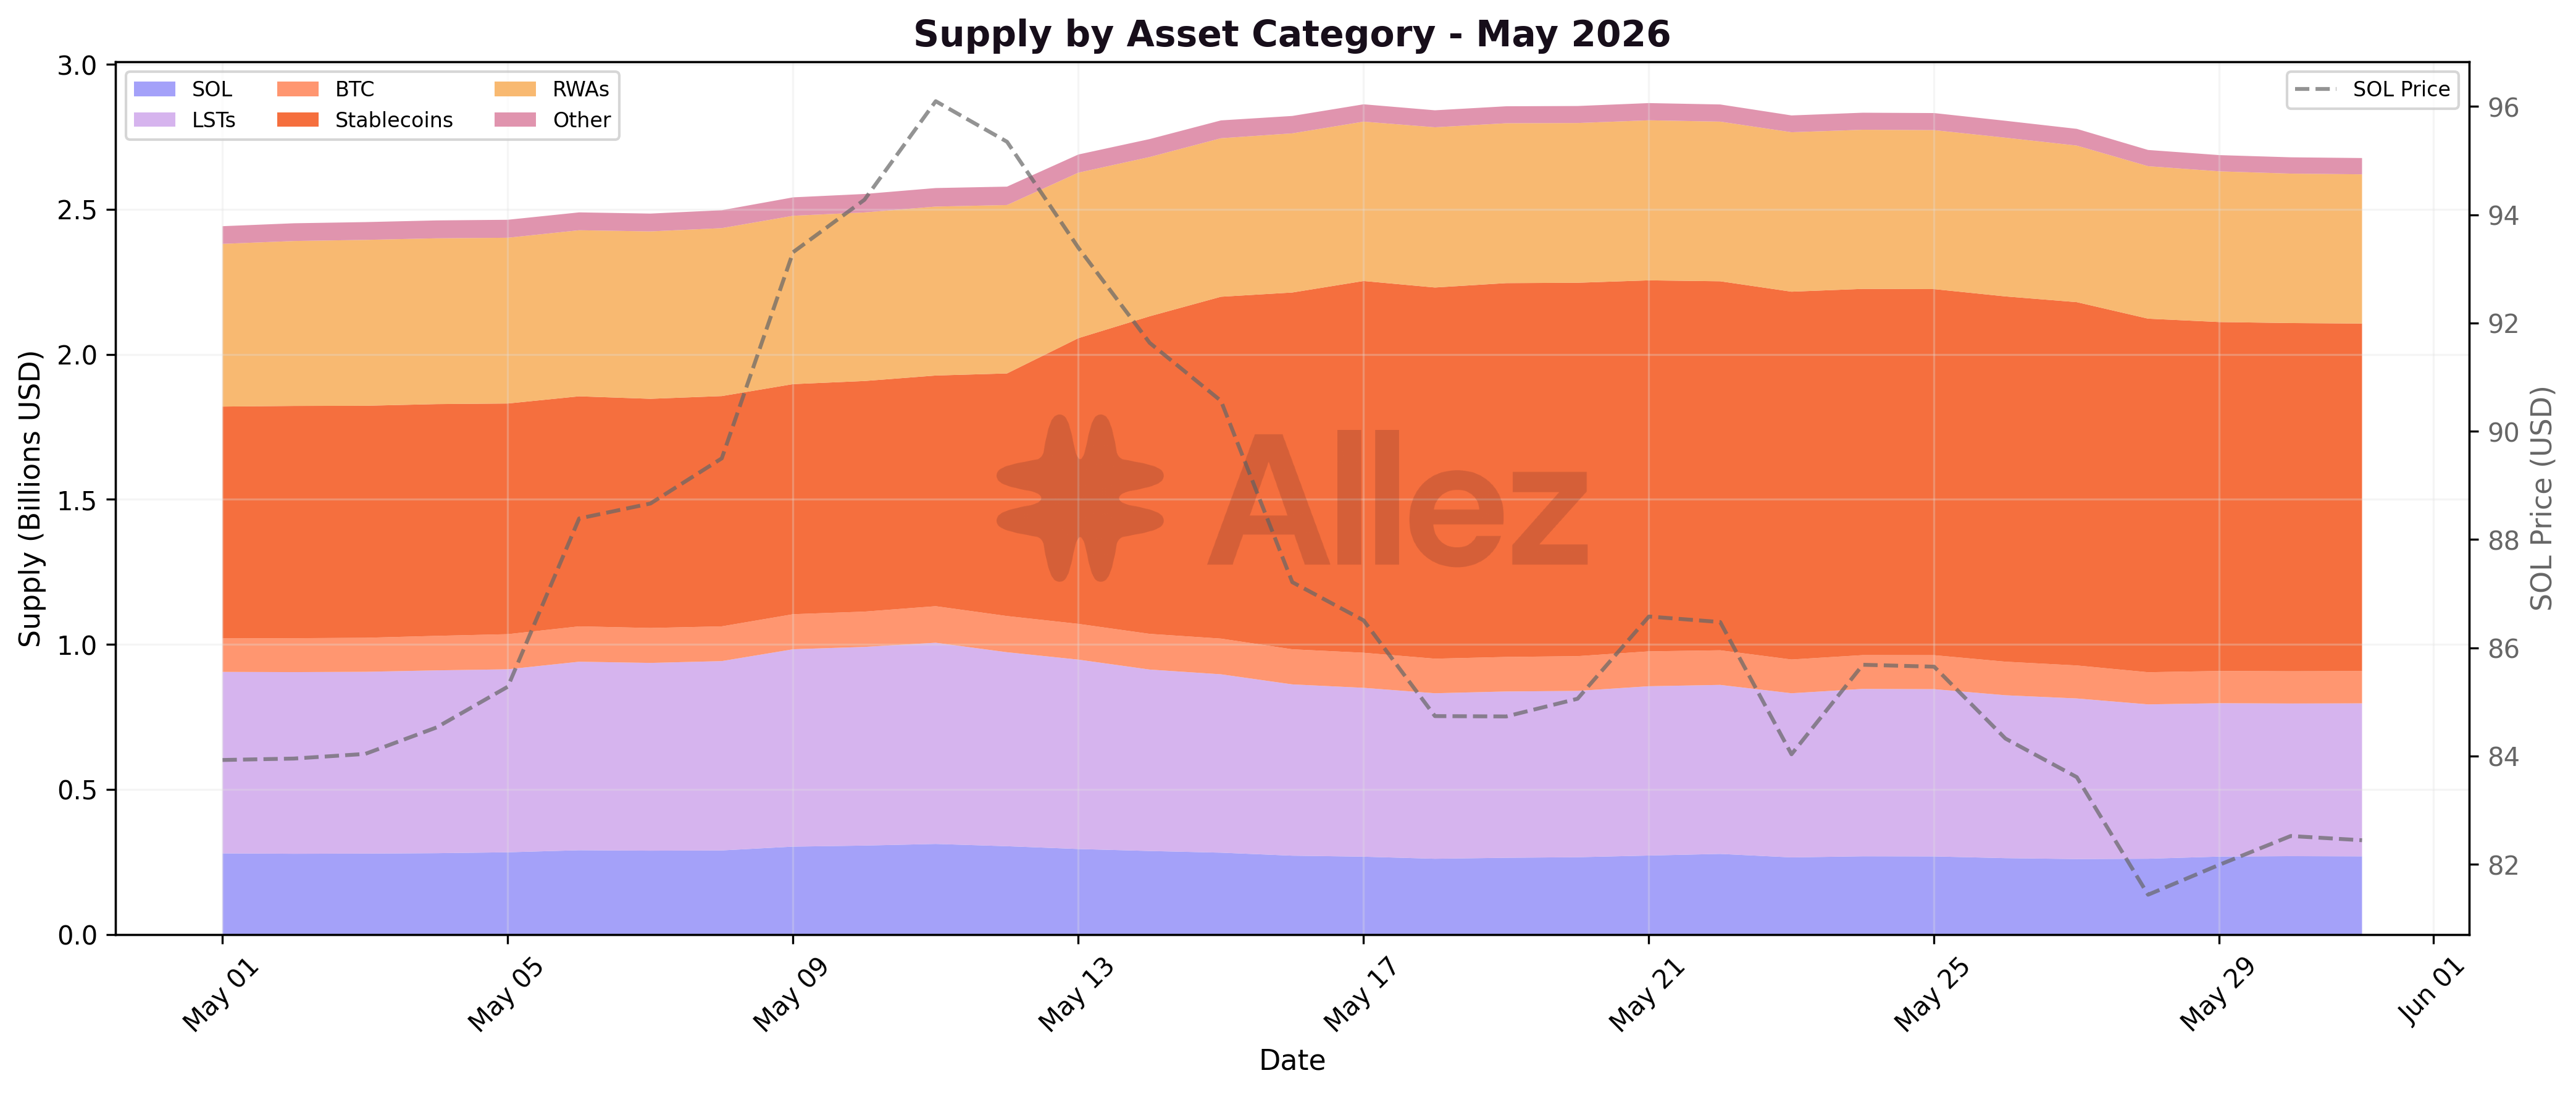
The daily series shows the stablecoin ramp up concentrated in the May 12-17 window, coinciding with the Ethena market launch and reinforced by SOL price consolidation.
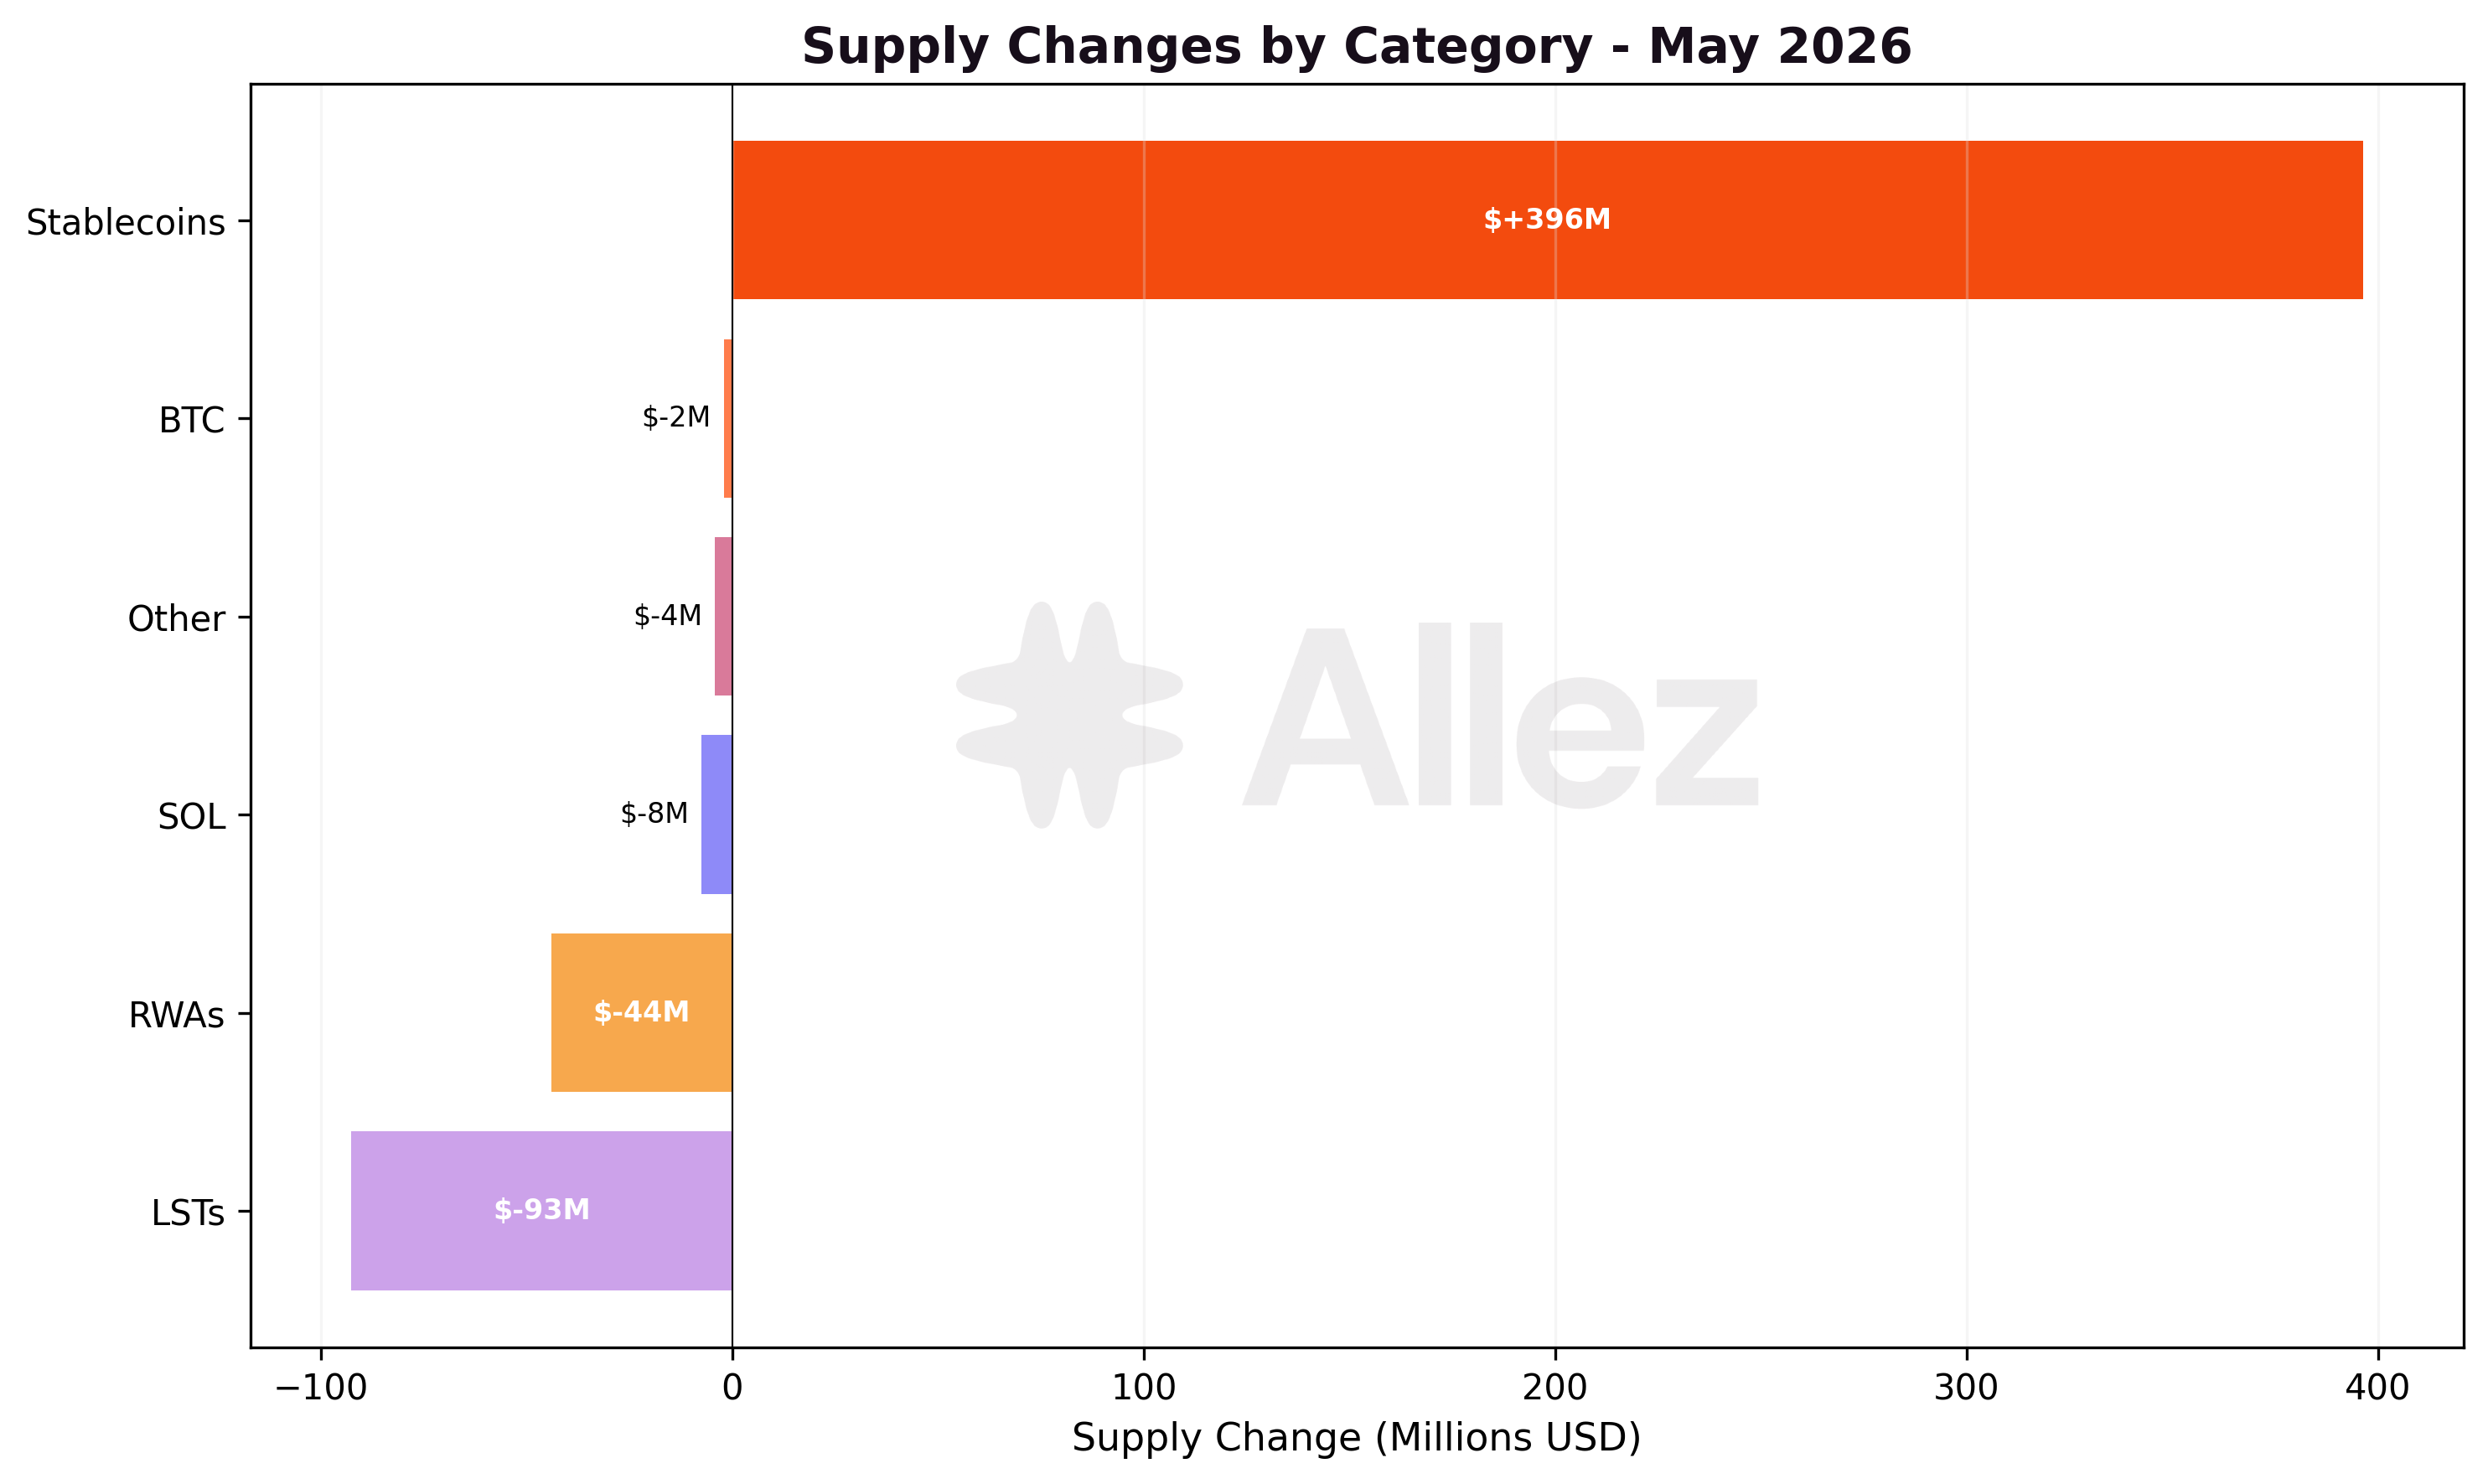
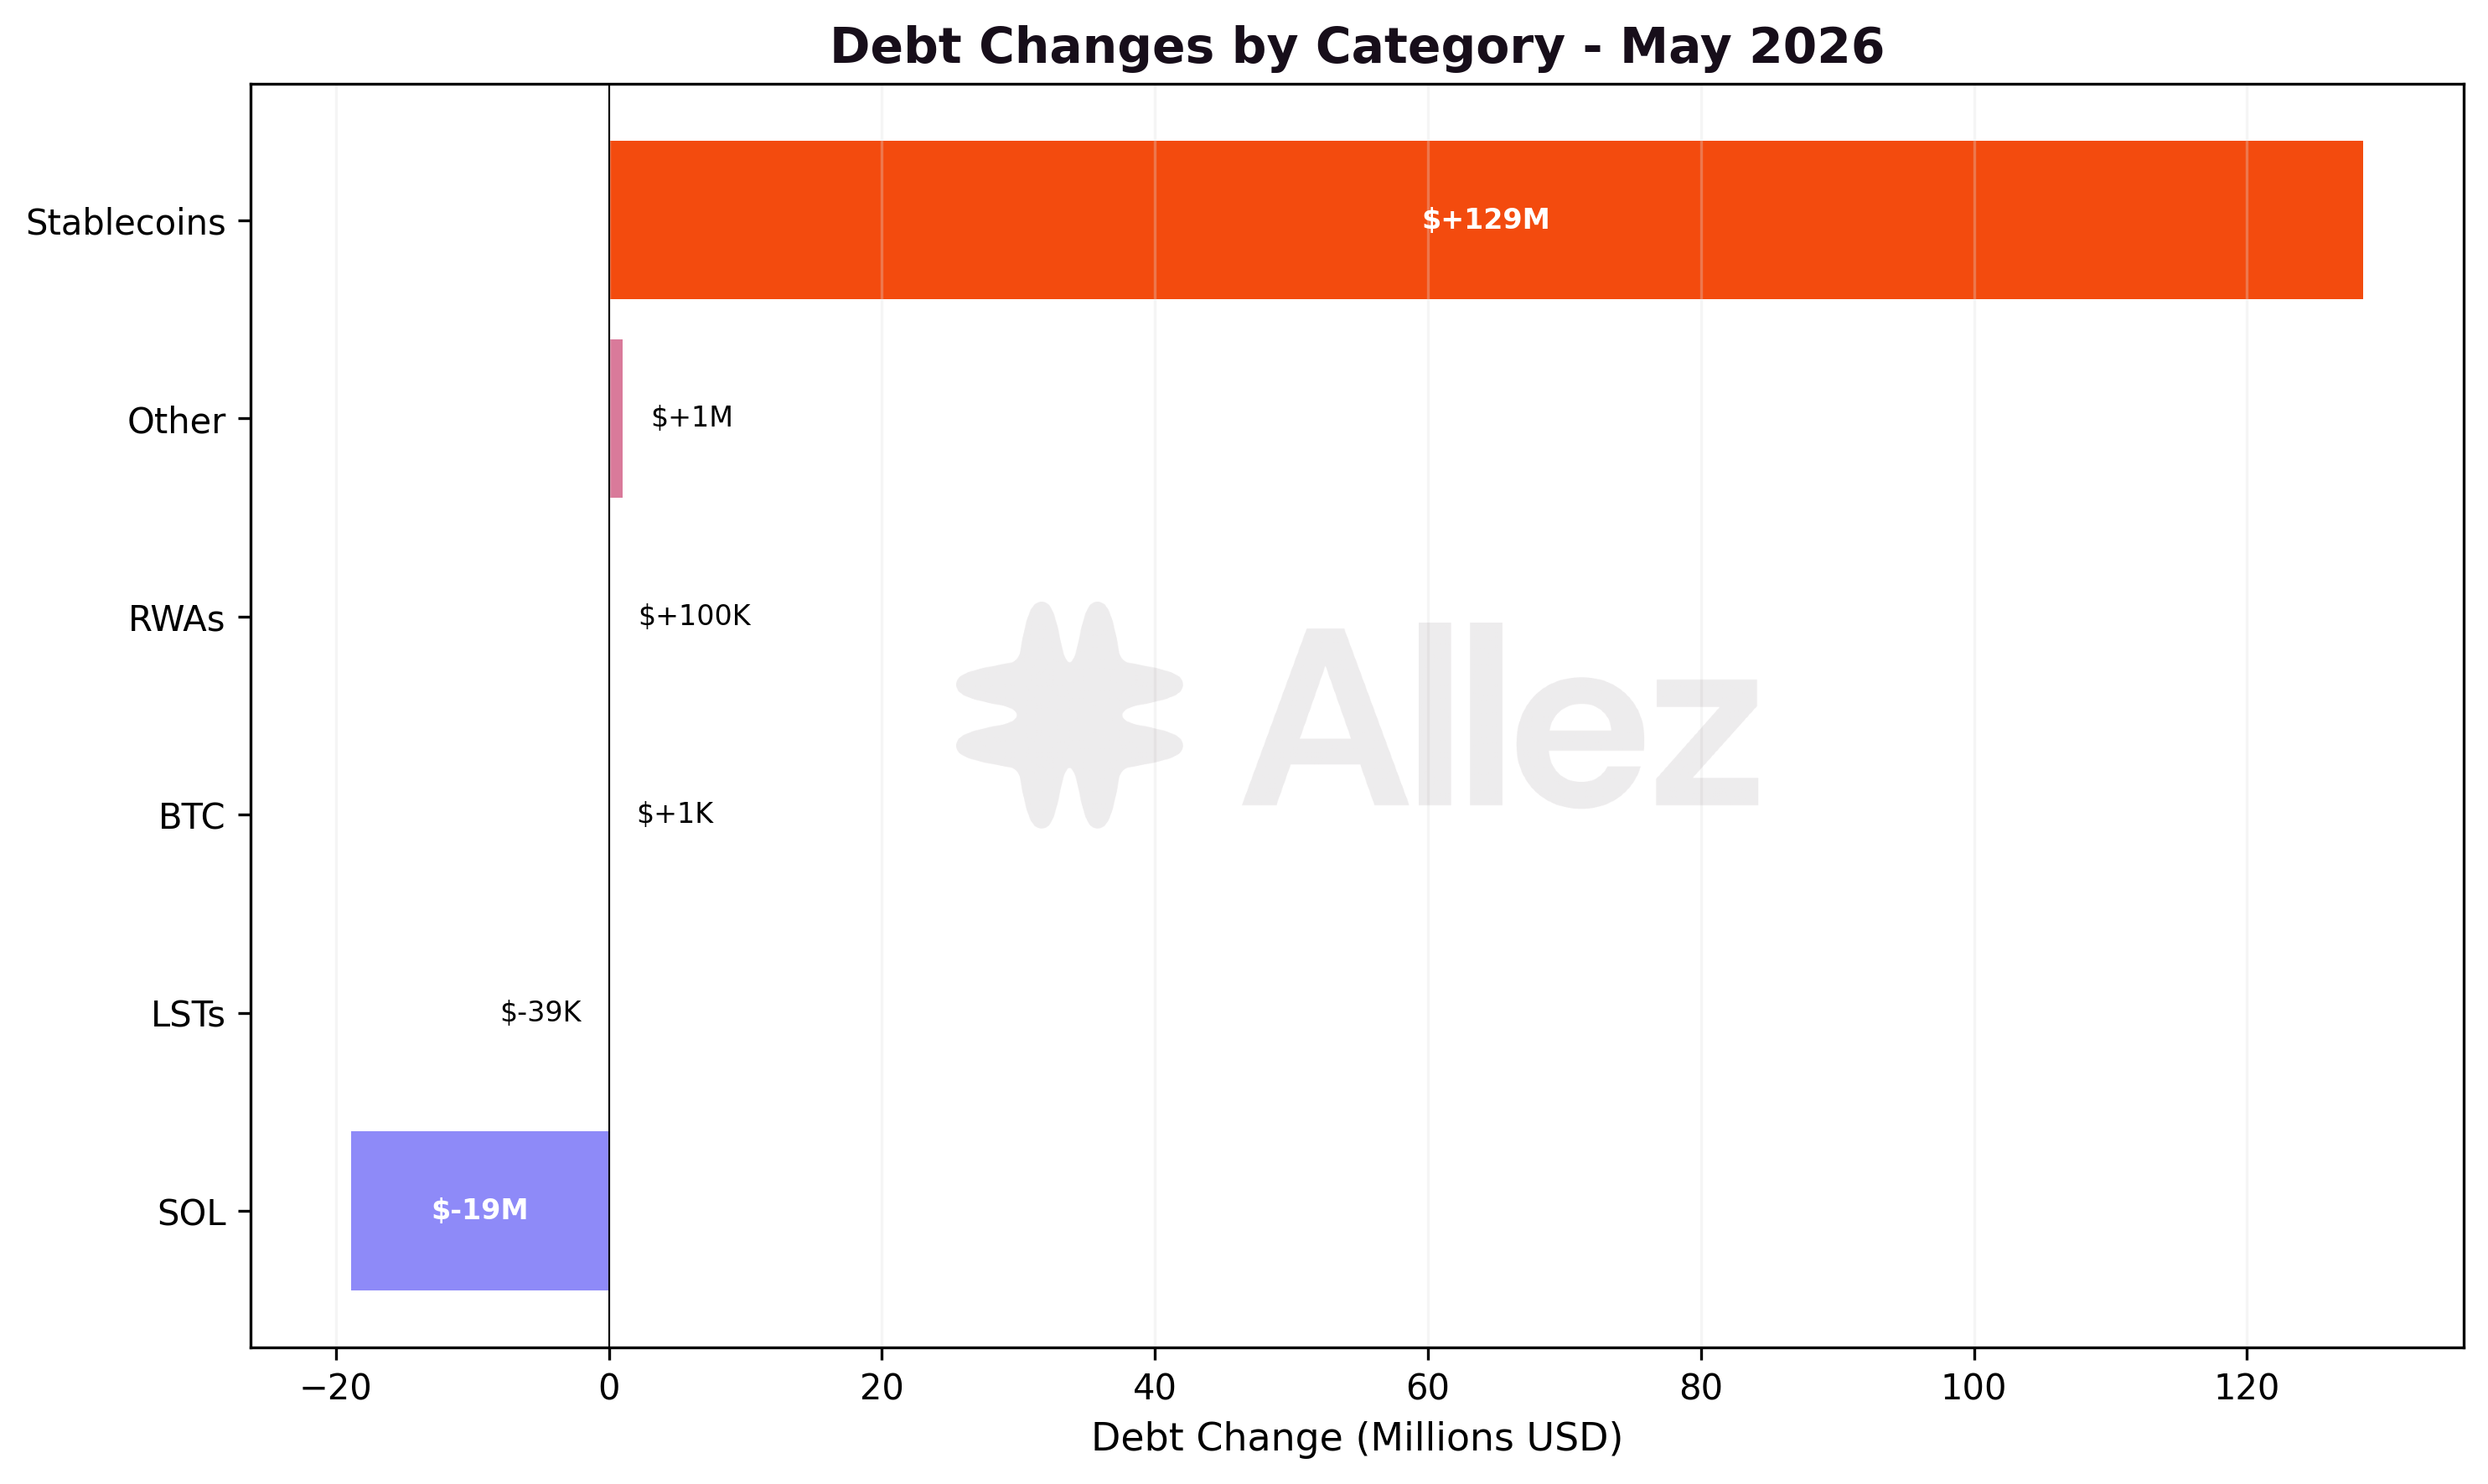
Stablecoin debt grew +17.9% to $845M, lifted by Ethena's market USDG borrows. SOL-denominated debt fell -7.5% to $232M as SOL/USDC borrowers reduced leverage. The LST supply contraction (-14.9%) is the largest category move outside stablecoins, spread across JupSOL, JitoSOL and mSOL withdrawals.
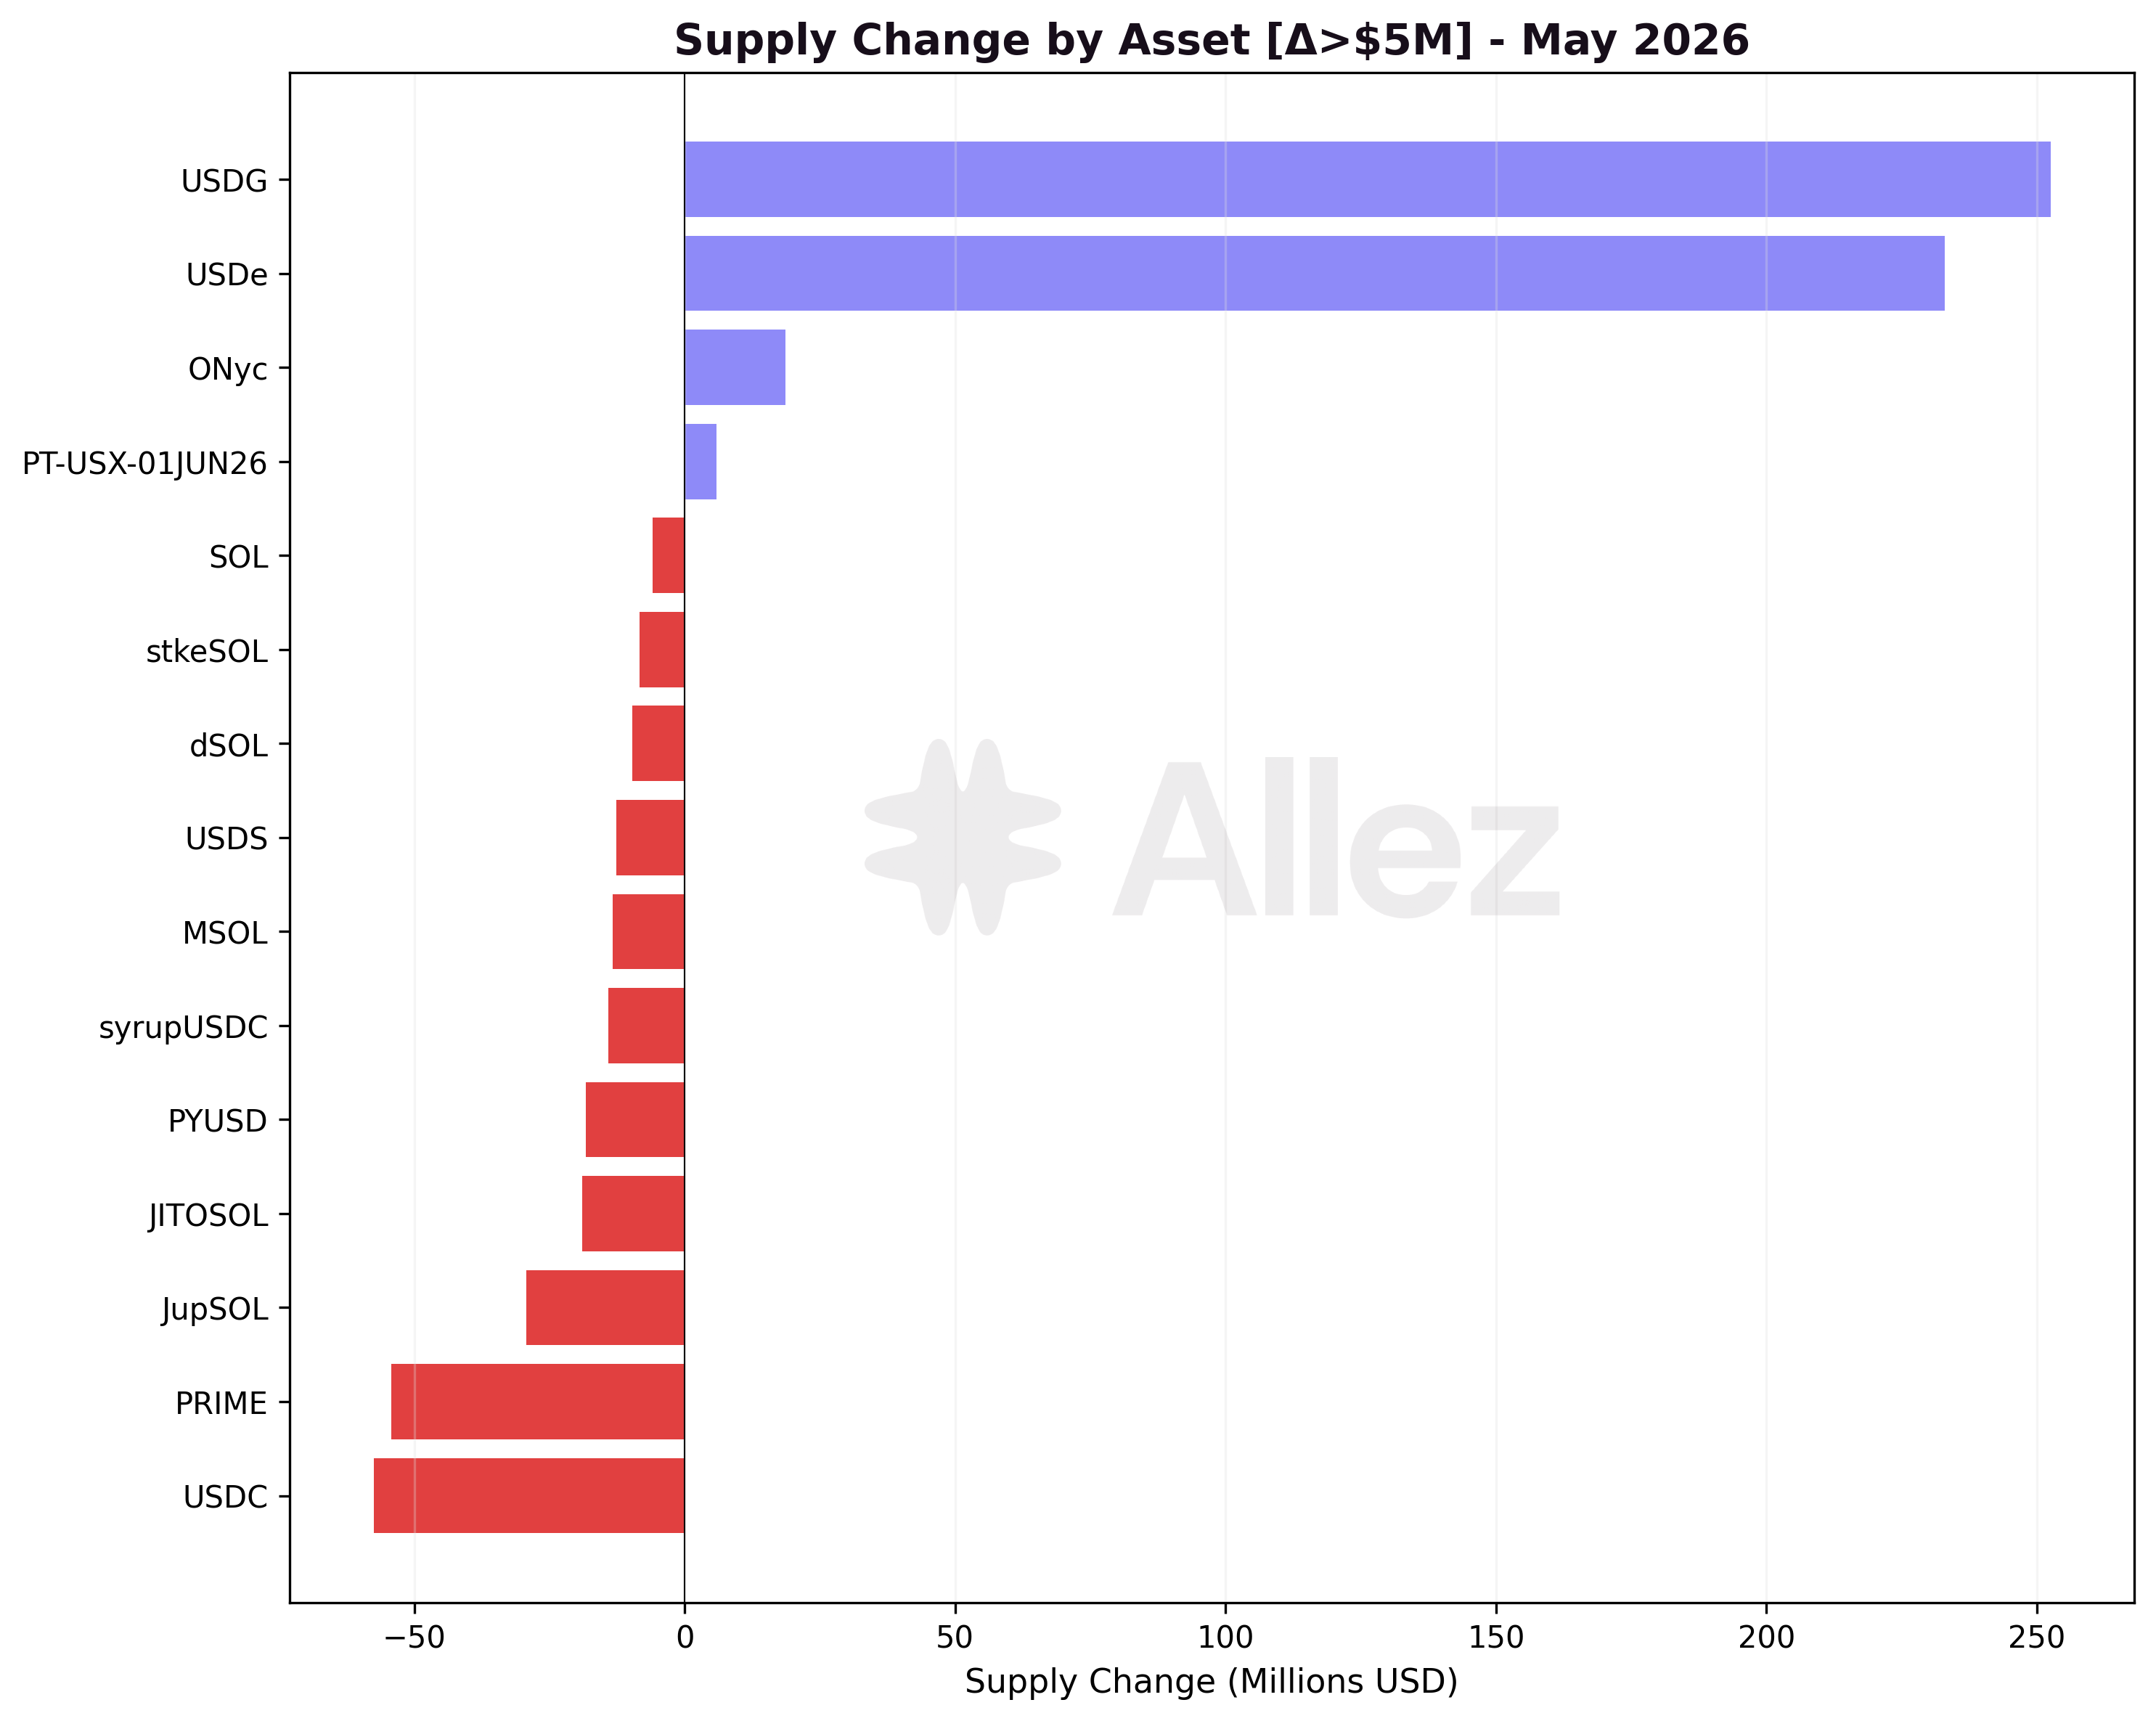
Major Inflows: USDG +$252.5M, USDe +$232.9M, ONyc +$18.6M, PT-USX-01JUN26 +$5.9M, cgntSOL +$3.2M.
Major Outflows: USDC -$57.5M, PRIME -$54.3M, JupSOL -$29.3M, JitoSOL -$18.9M, PYUSD -$18.3M.
The two largest inflows, USDG and USDe, are both the Ethena market: USDe is deposited as collateral and USDG is borrowed against it, then re-supplied through the Multiply product. USDC remained the largest single stablecoin reserve at $376M despite the -$57.5M outflow, ahead of USDG at $301M and USDe at $233M. PRIME's -$54.3M outflow drove the RWA category lower and reduced its stress-test footprint, discussed below.
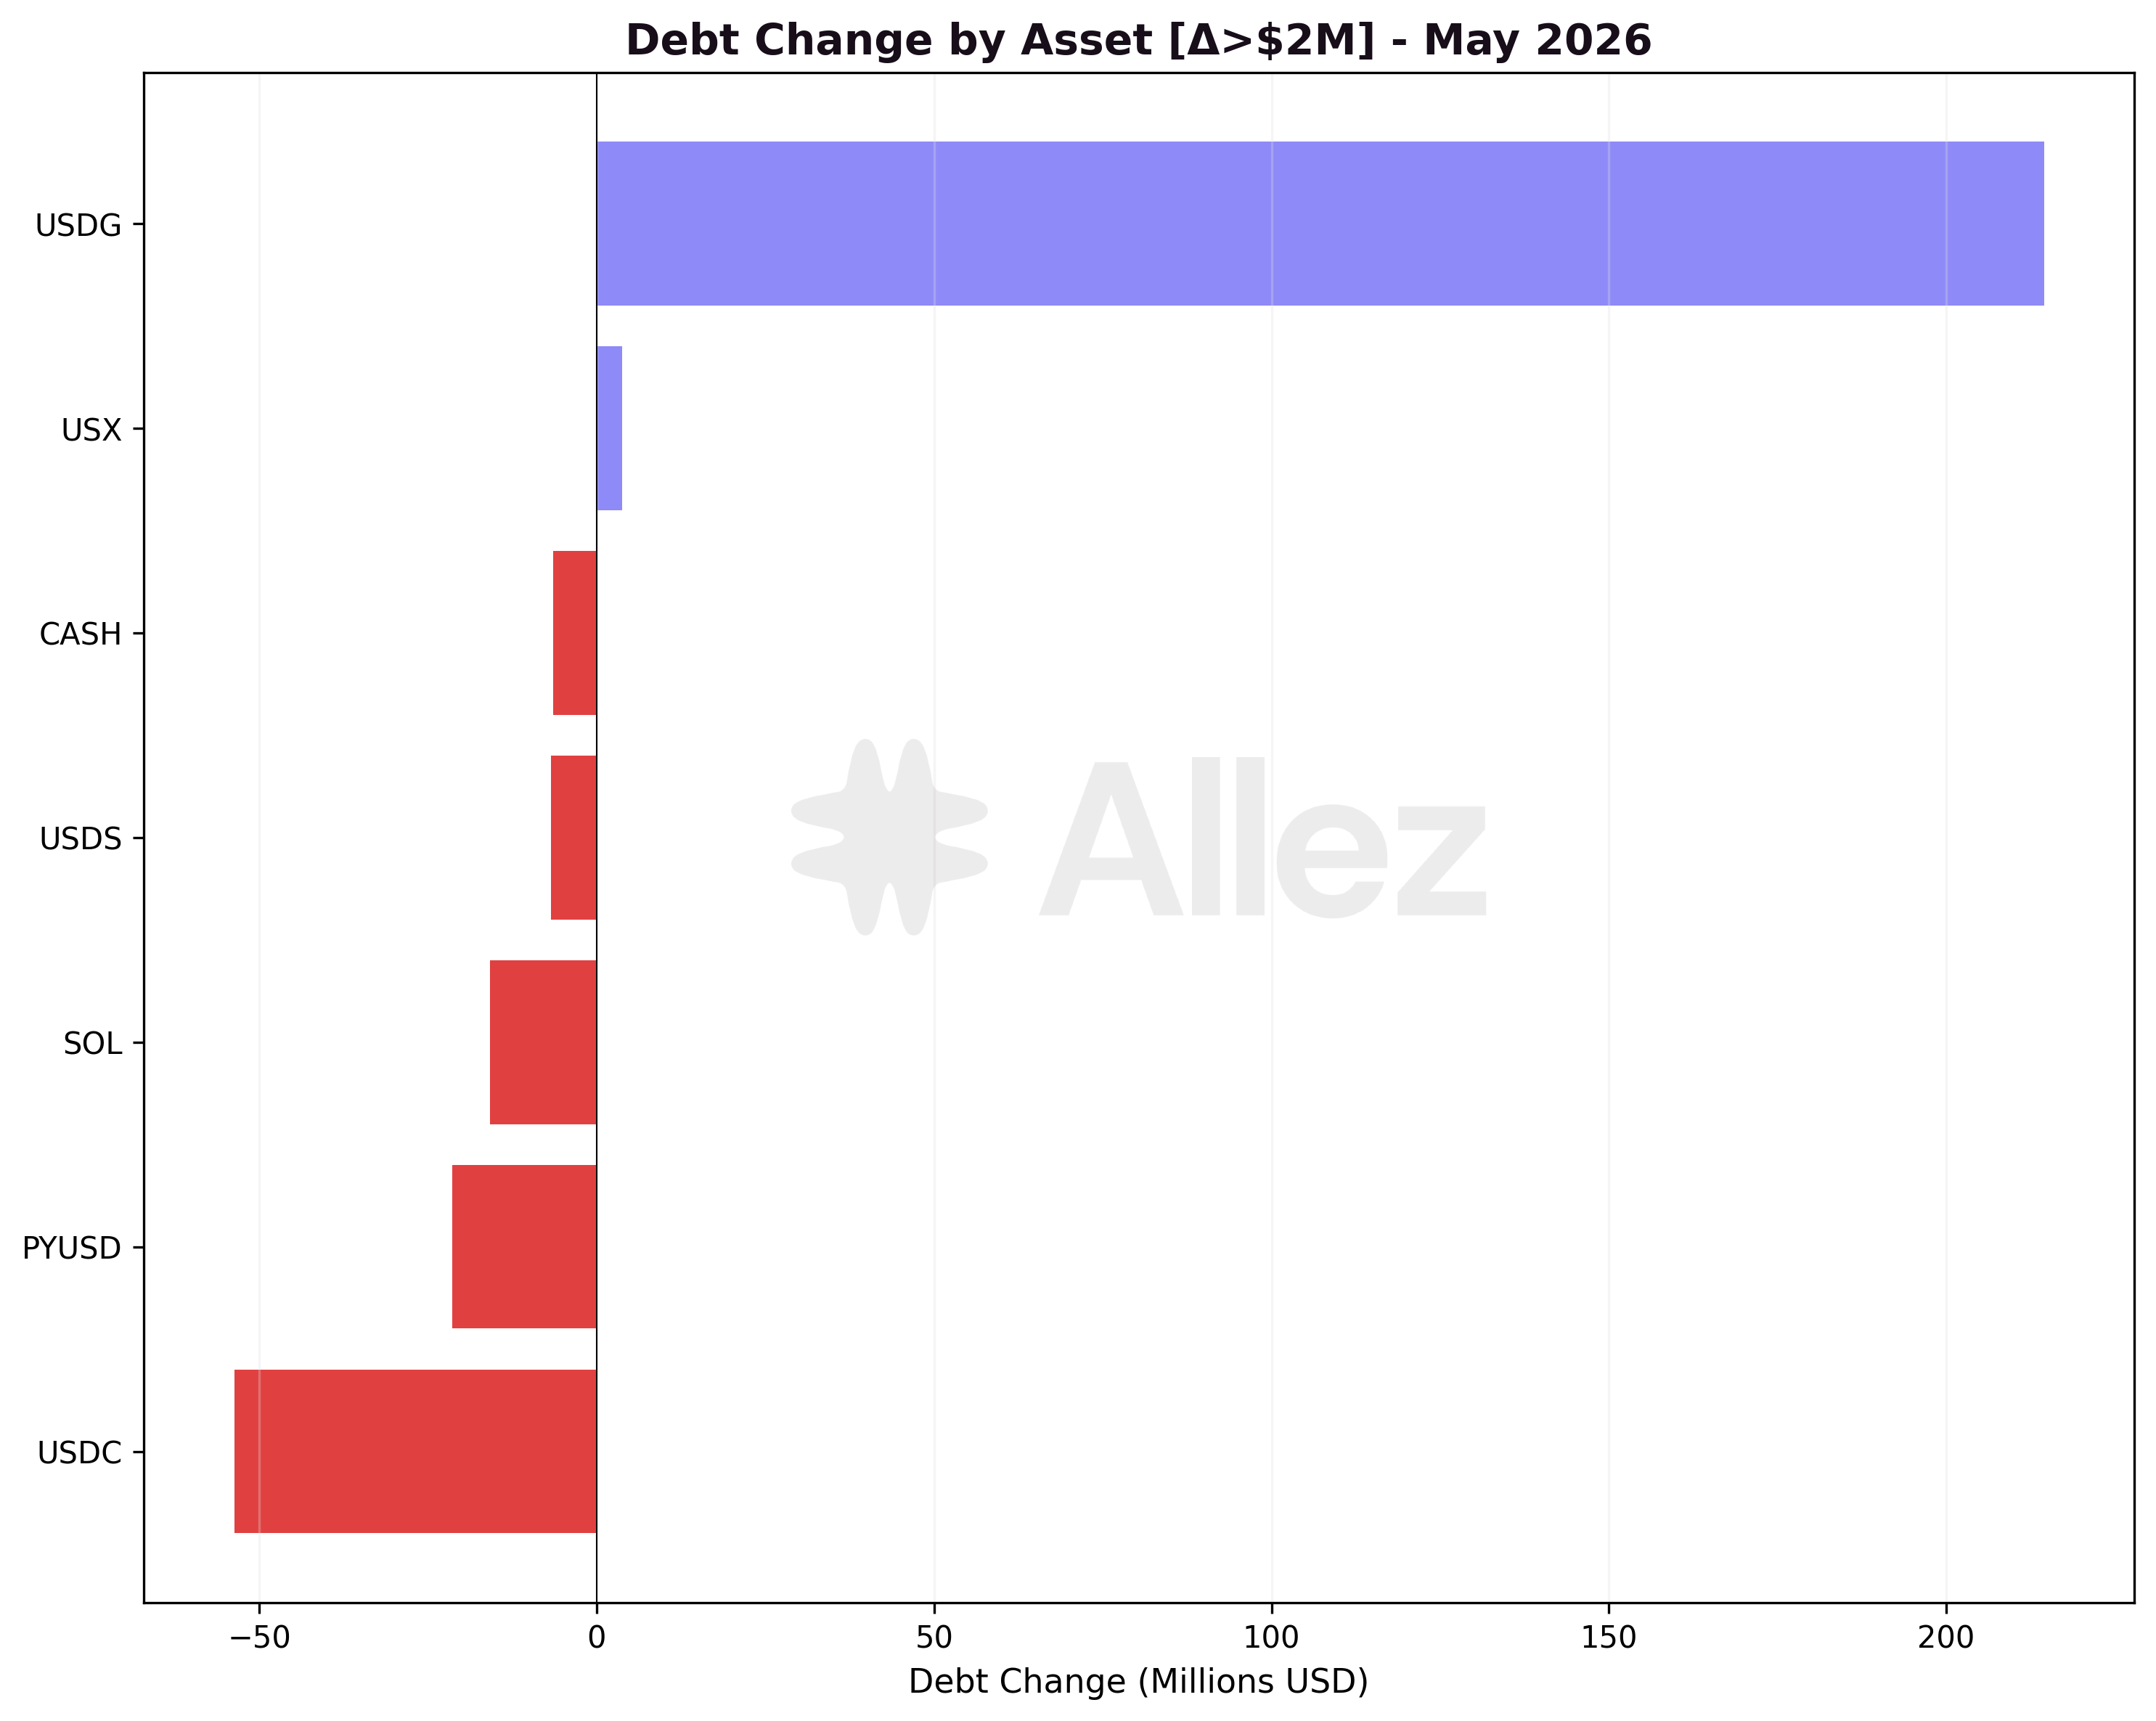
USDG borrowing grew +$214.5M, essentially all of it inside the Ethena market. USDC borrowing fell -$53.7M, concentrated in the Prime (-$41.5M) and Main (-$16.3M) markets, and PYUSD borrowing fell -$21.4M in the Main (-$18.3M) and Maple (-$11.2M) markets, as borrowers repaid stablecoin loans in the established markets.
3. Risk & Liquidations
Distance to Liquidation: Correlated vs Uncorrelated Positions
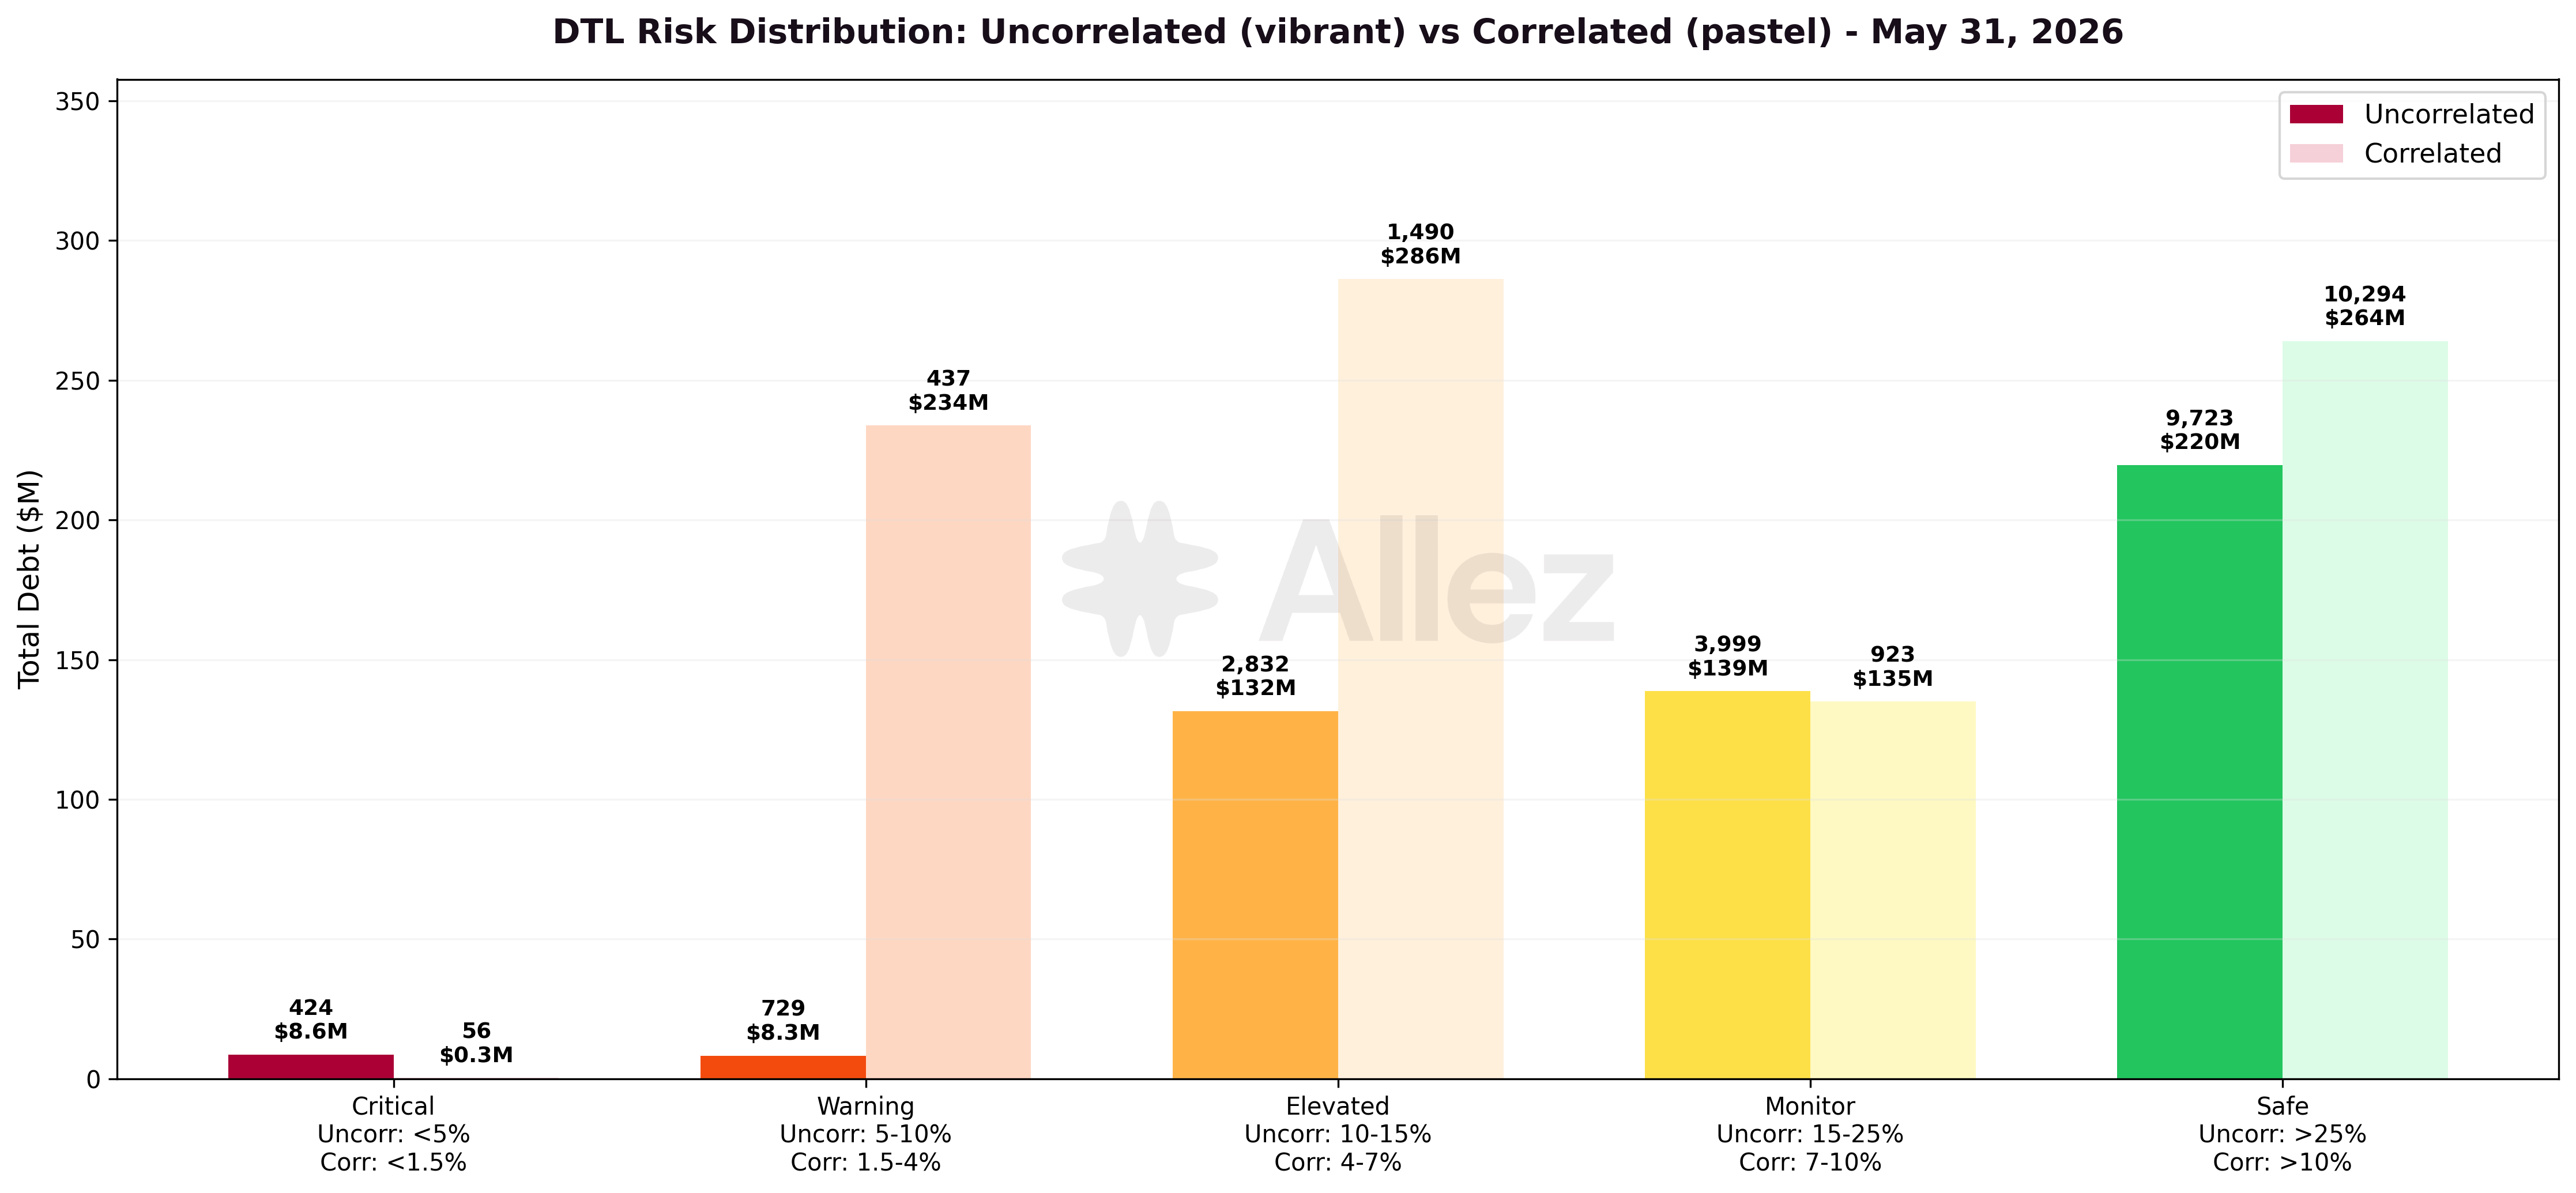
Uncorrelated positions (SOL/USDC, BTC/USDC, JLP/USDC):
| Risk Tier | DTL Range | Debt Volume | Apr Debt | MoM |
|---|---|---|---|---|
| Critical | <5% | $8.6M | $3.8M | +127% |
| Warning | 5-10% | $8.3M | $14.7M | -44% |
| Elevated | 10-15% | $131.6M | $11.5M | +1044% |
| Monitor | 15-25% | $138.7M | $279.6M | -50% |
| Safe | >25% | $219.7M | $382.5M | -43% |
Correlated positions (LST/SOL, RWA/stablecoin, stablecoin/stablecoin):
| Risk Tier | DTL Range | Debt Volume | Apr Debt | MoM |
|---|---|---|---|---|
| Critical | <1.5% | $0.3M | $0.2M | +35% |
| Warning | 1.5-4% | $233.9M | $94.8M | +147% |
| Elevated | 4-7% | $286.2M | $305.7M | -6% |
| Monitor | 7-10% | $135.0M | $116.0M | +16% |
| Safe | >10% | $264.1M | $263.3M | +0.3% |
The largest correlated-side change is the Warning tier (1.5-4% distance-to-liquidation), which grew +147% to $234M. This is the new Ethena leverage book: its 3% debt-weighted distance to liquidation is a mechanical consequence of the leverage cap, not live market proximity. USDe carries a 92% max LTV against a 94% liquidation threshold, so a position looped to the 12.5x maximum opens about 2% from its threshold.
On the uncorrelated side, the Elevated tier (10-15%) grew to $131.6M from $11.5M. The growth is distributed across 2,870 positions led by cbBTC ($55M) and dSOL ($53M) collateral, not concentrated in any single user, and reflects a redistribution out of the Monitor and Safe tiers (both down ~45-50%) as SOL- and BTC-collateralized longs sit at slightly tighter average distance-to-liquidation this month. Critical-tier uncorrelated debt more than doubled month-over-month to $8.6M (+127%).
Liquidation summary: May recorded 491 liquidation events, $0.51M of collateral seized, and $0.50M of debt repaid. April's 10,311-event headline was dominated by the one-off UXD compression cascade (9,628 events in a 48-hour window). Against April's 683 non-cascade events, May was similarly quiet.
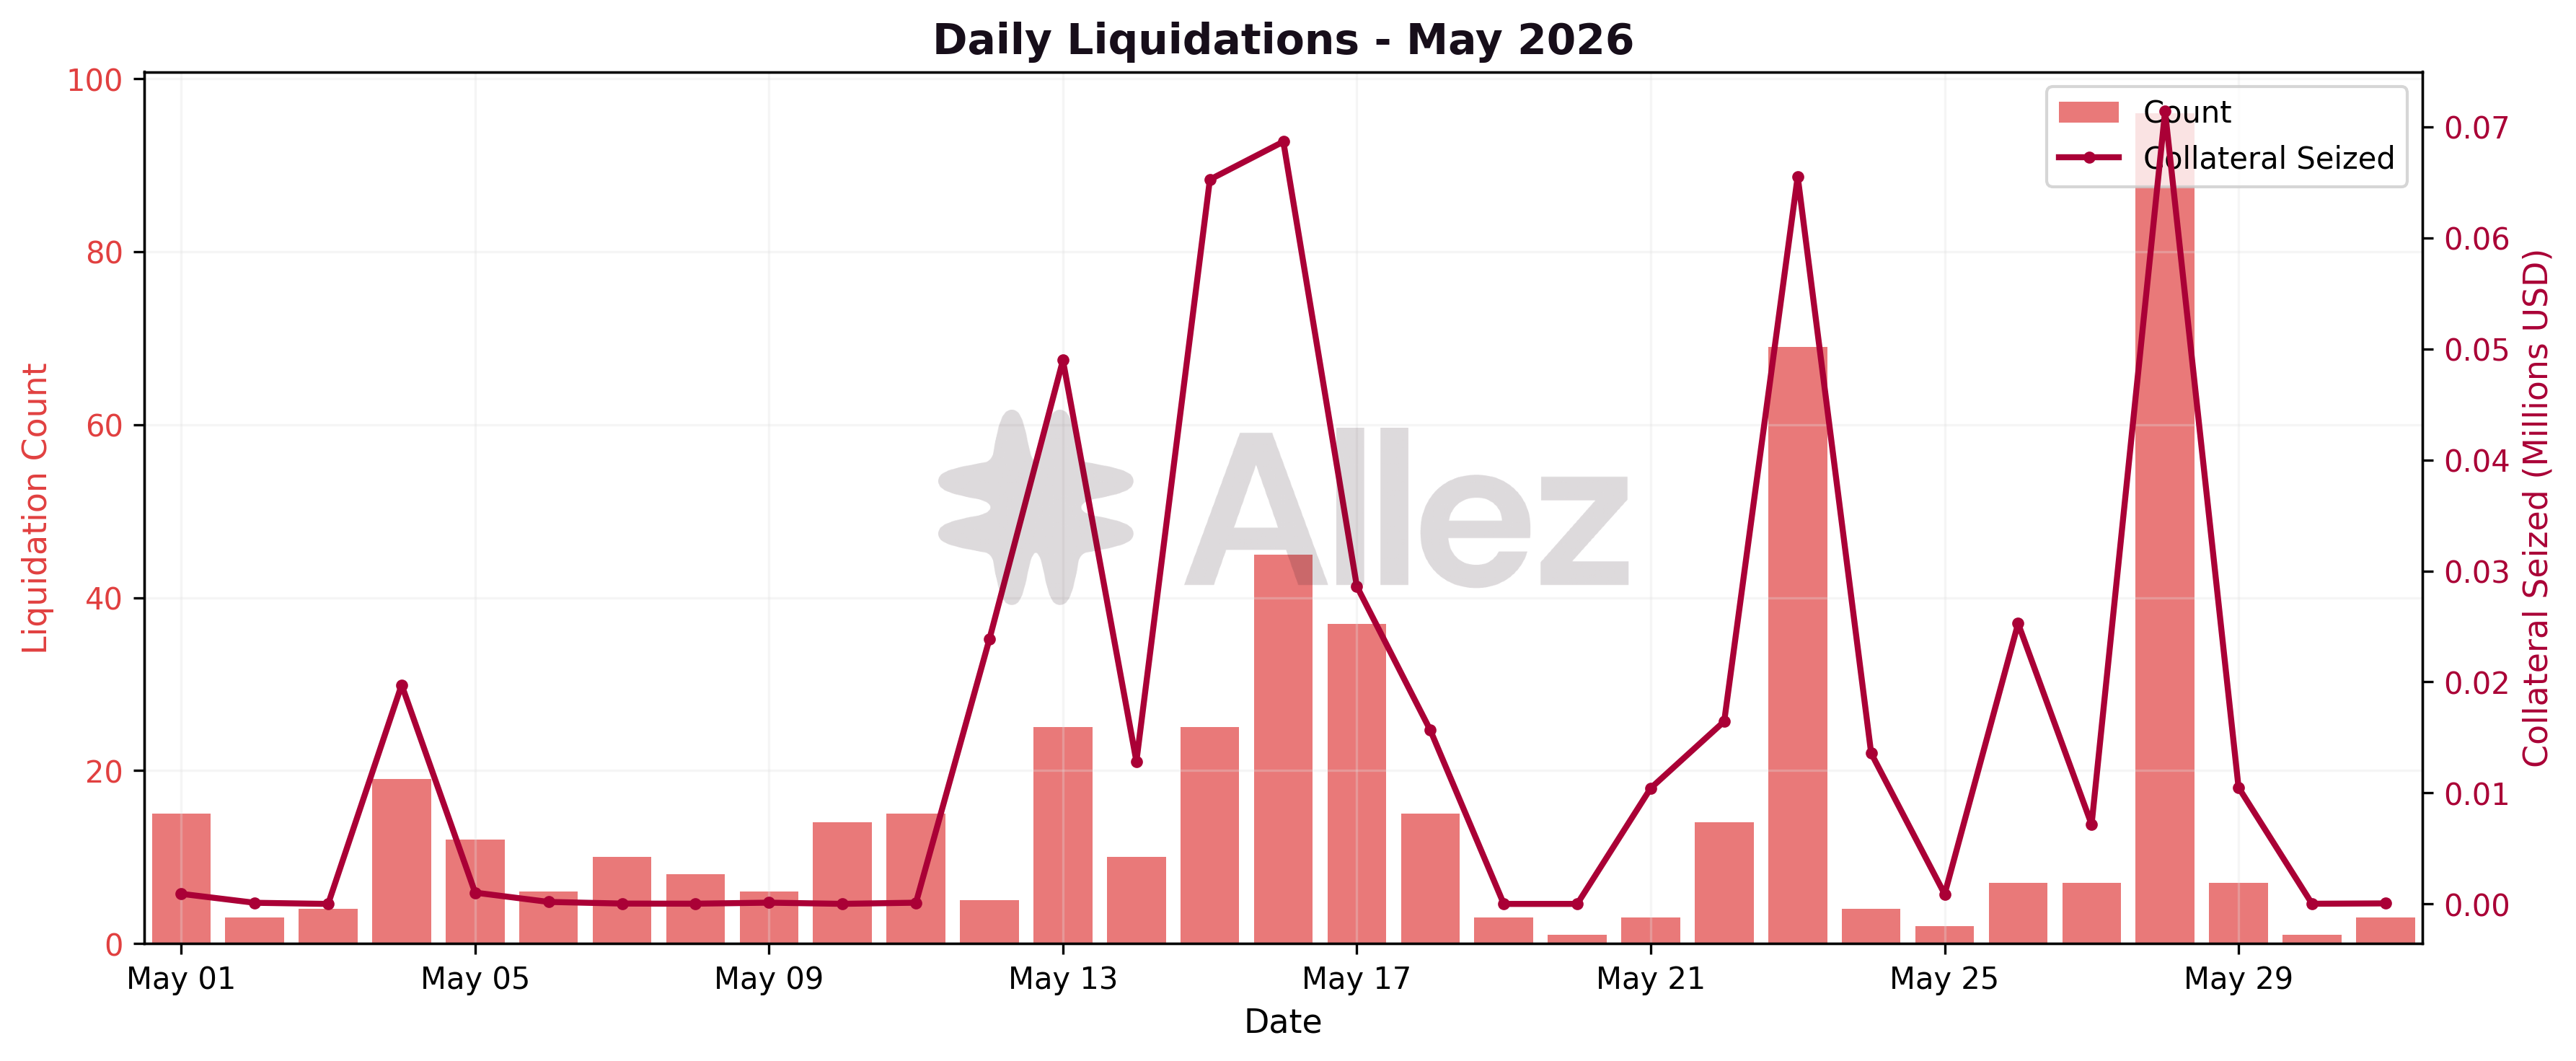
By collateral, SOL accounted for $353K of collateral seized (70% of the month's total), followed by cbBTC at $77K (15%), JLP at $28K (6%), USDC at $15K (3%) and xBTC at $14K (3%). The single largest day was May 28 at $71K. The distribution is consistent with routine deleveraging of SOL and BTC longs rather than any concentrated event.
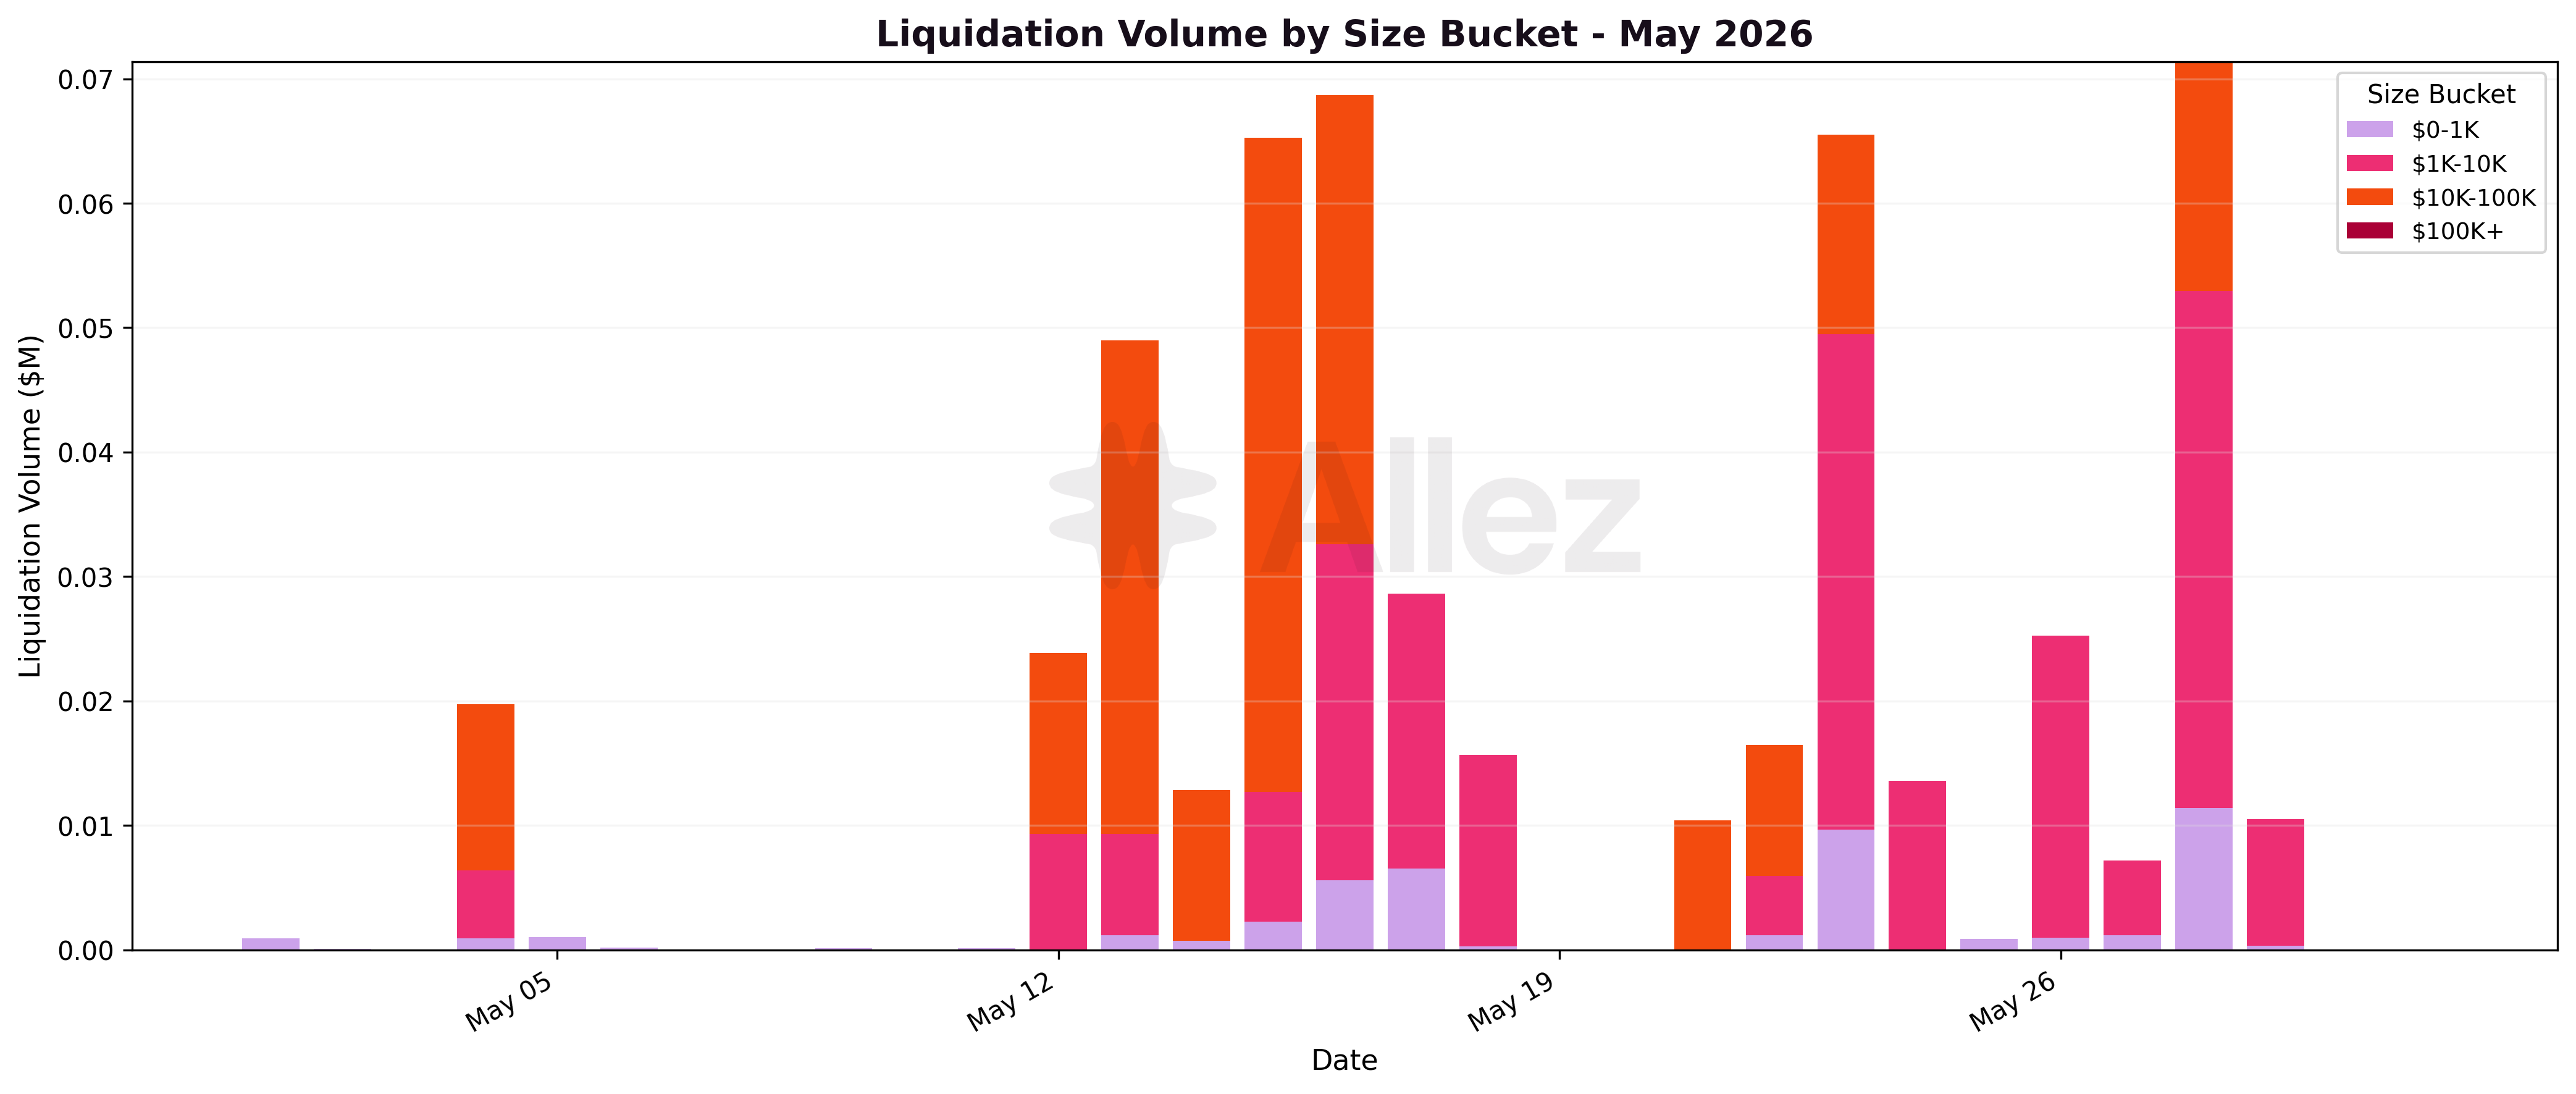
| Size Bucket | Volume | Events |
|---|---|---|
| $0-1K | $45.7K | 416 |
| $1K-10K | $237.9K | 58 |
| $10K-100K | $223.7K | 17 |
No liquidation exceeded $100K during the month. The $1K-10K and $10K-100K buckets carried 91% of the dollar volume across just 75 events, while the sub-$1K bucket accounted for 85% of events but only 9% of volume.
On May 22, a network-wide Pyth outage halted price production for several hours. Kamino absorbed it without adverse liquidations or bad debt, with the following day's liquidation activity ($65.5K of collateral seized on May 23) in line with ordinary days earlier in the month. As part of the remediation, Kamino upgraded its Scope oracle infrastructure for resilience.
Stress Testing:
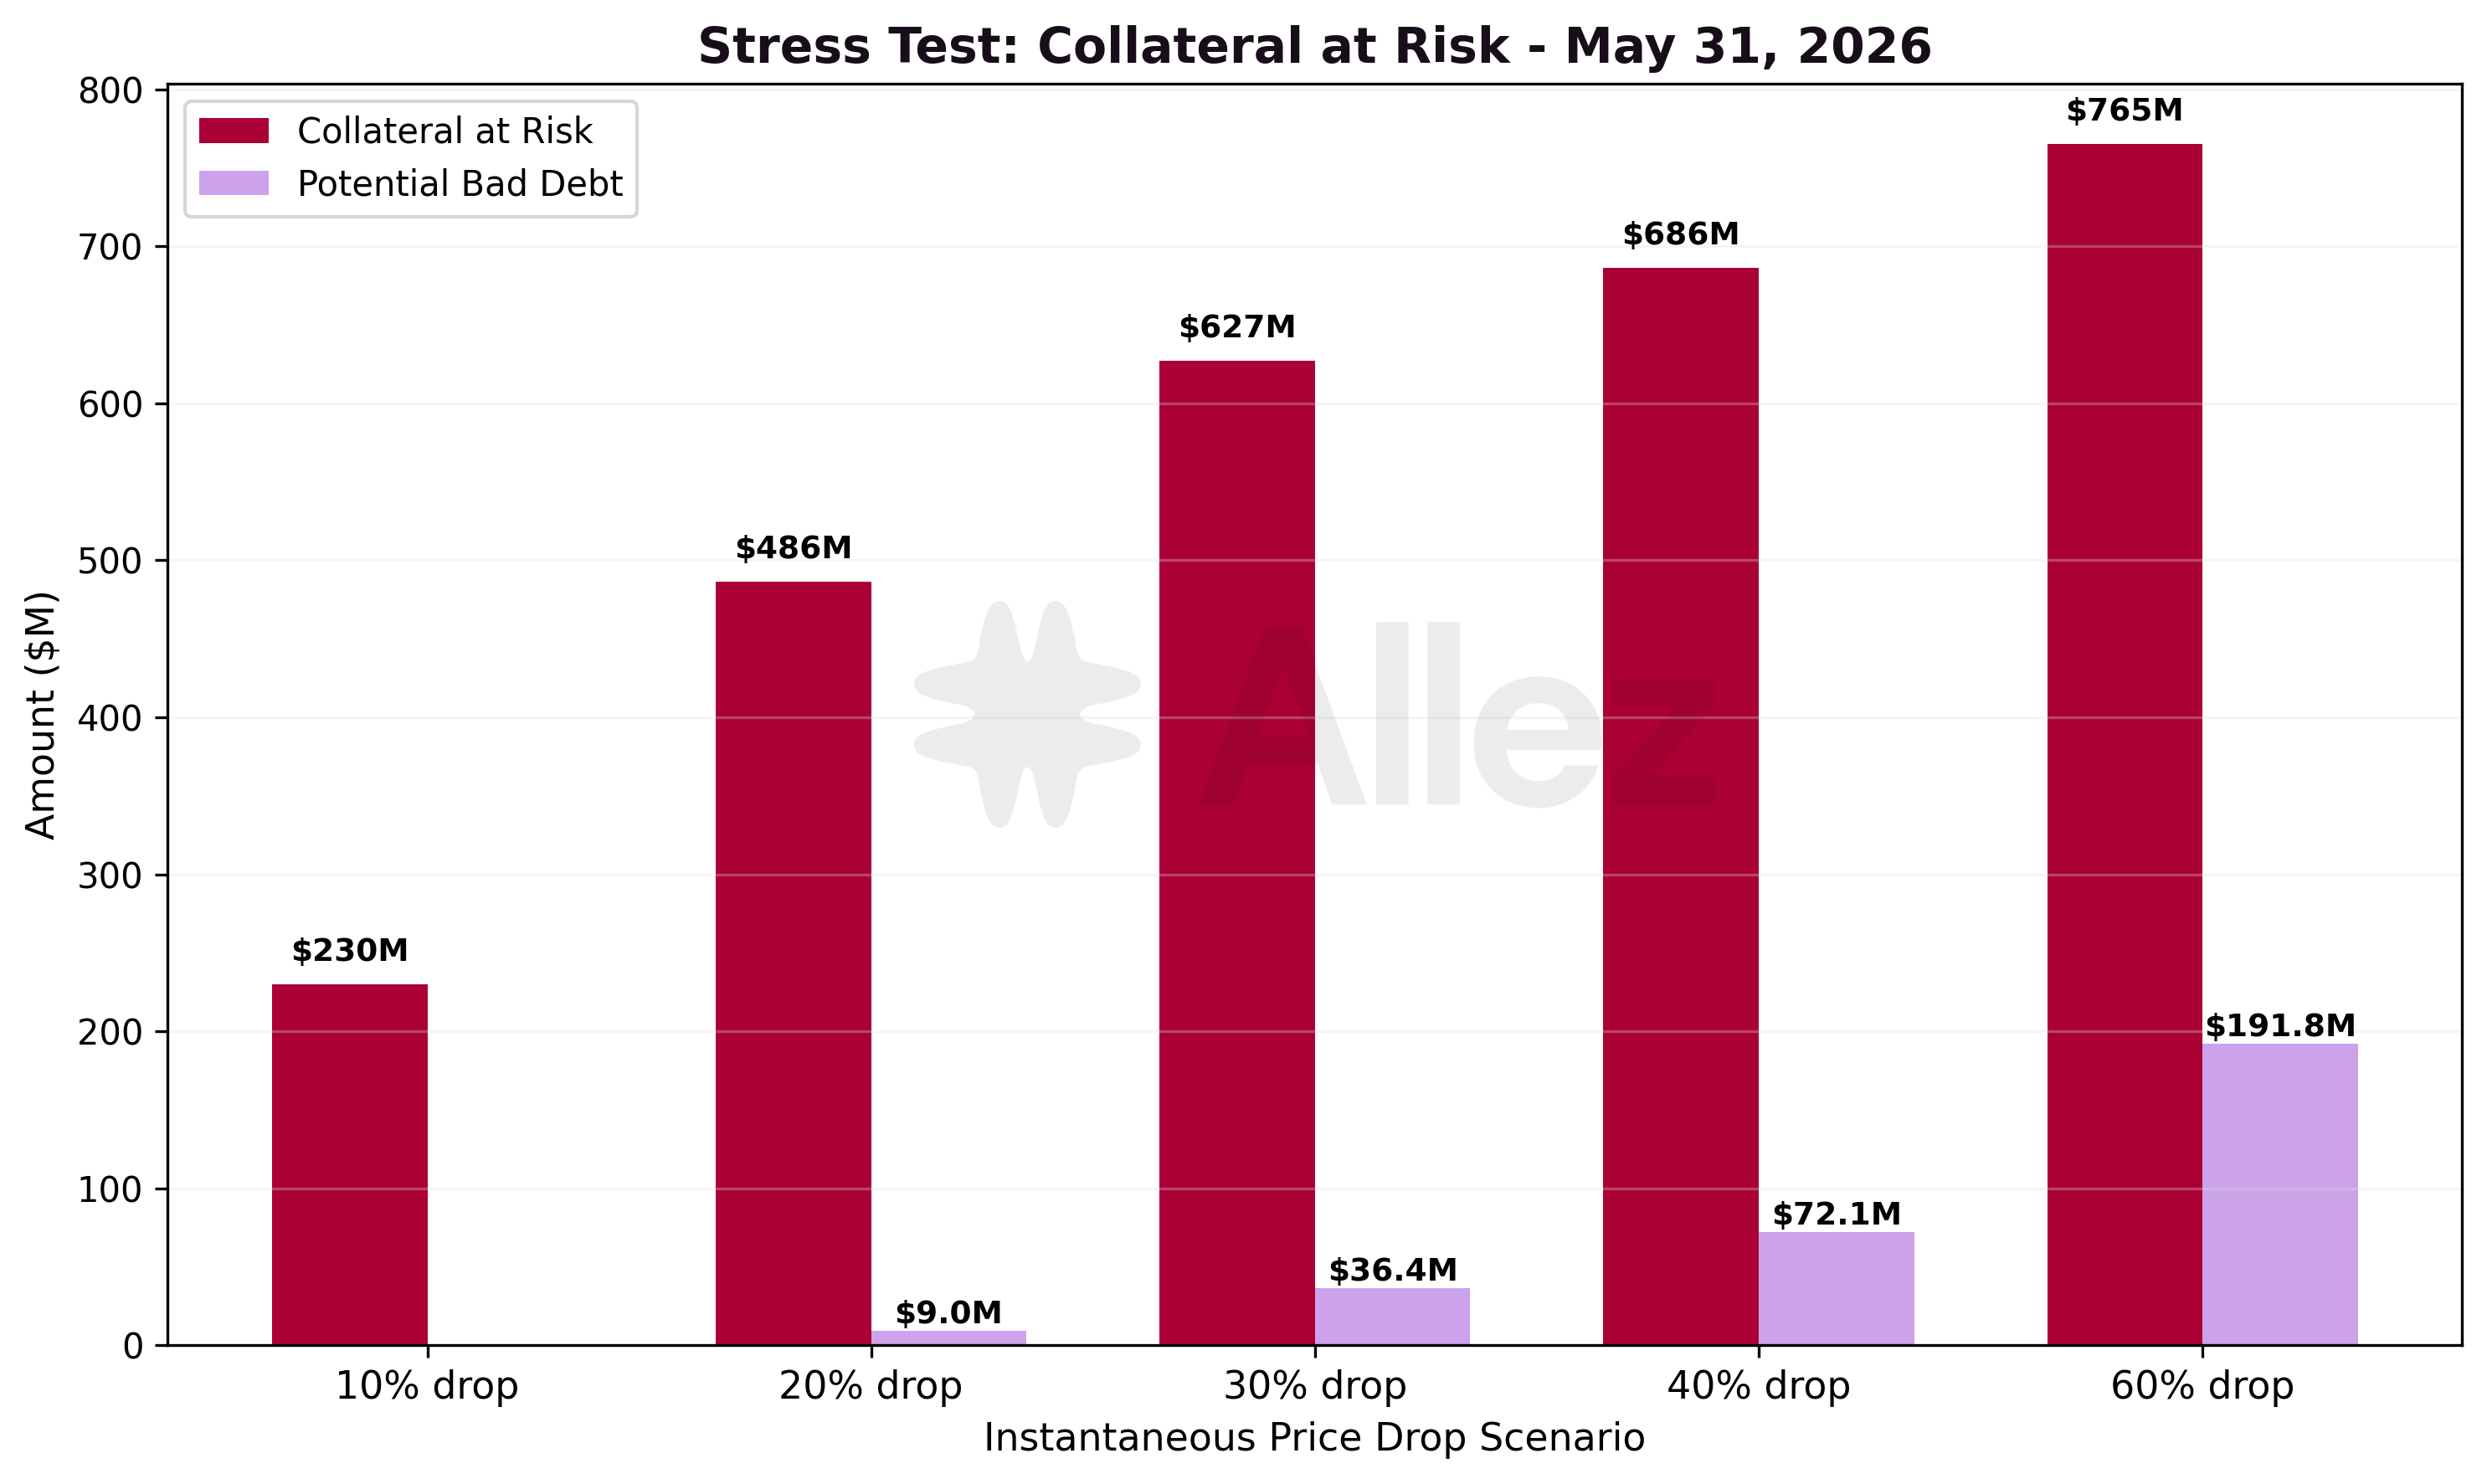
| Scenario | Collateral at Risk | Potential Bad Debt | Positions Liquidated | Apr Collateral | MoM |
|---|---|---|---|---|---|
| 10% drop | $229.9M | $0.0M | 732 | $275M | -16% |
| 20% drop | $486.4M | $9.0M | 6,740 | $412M | +18% |
| 30% drop | $627.0M | $36.4M | 9,663 | $680M | -8% |
| 40% drop | $686.1M | $72.1M | 11,942 | $762M | -10% |
| 60% drop | $765.4M | $191.8M | 13,731 | $894M | -14% |
Collateral at risk contracted month-over-month at the -10%, -30%, -40% and -60% scenarios even though total supply grew +10.1%. The reason is that May's growth is concentrated in dollar-pegged stablecoin collateral (USDe and USDG in the Ethena market), which is not shocked in a market price-drop scenario, while the RWA positions (chiefly PRIME) and the SOL and BTC longs that populate the mechanical at-risk pool contracted.
The exception is the -20% scenario, which rose +18% MoM. This step is driven primarily by dSOL and cbBTC collateralized positions whose first liquidation falls in the -12% to -18% band, consistent with the cbBTC and dSOL longs that also populate the uncorrelated Elevated tier discussed above. The shallow -10% scenario contracted the most (-16%) because the high-LTV PRIME positions that dominated April's shallow at-risk pool partly exited with the -15.6% contraction in the Prime market.
The RWA cliff persists but is smaller than in April, with PRIME-collateralized debt at LTV ≥80% down to $147.4M from $182M. The step is largely mechanical, though: PRIME and the other real-world assets (syrupUSDC, ONyc) are NAV-referenced rather than volatile tokens and would not fall in a market sell-off, so the market-driven collateral at risk is about a third of the headline, with near-zero theoretical bad debt until -40%.
Liquidation Cascade and On-Chain Exit Depth (SOL)
This analysis complements the threshold-based stress test above with a position-level partial-liquidation cascade for SOL, the protocol's largest price-sensitive collateral. Where the stress test measures collateral that crosses its liquidation threshold, the cascade measures the sell pressure that actually reaches the market as liquidators seize and sell collateral in partial waves, and compares it against the depth available to exit SOL into dollars on-chain.
The model steps the SOL price down in 0.25% increments and, at each level, liquidates each position in 10% close-factor waves until it returns below its liquidation threshold, carrying residual collateral and debt forward. The Main market holds 93% of the protocol's SOL collateral, and supply-only SOL is excluded because it generates no forced selling. Debt is allocated pro-rata to each position's SOL collateral share, and the 10% wave size matches the Main market's configured close factor (the per-liquidation debt-repay cap) and the 10.4% realized in SOL liquidations over the past year.
We project onchain liquidity to assess depth available to exit SOL into dollars across trade sizes. Selling SOL into USDC absorbs $11.5M at 2% price impact and $22.6M at 5%, with realizable output flattening near a $24M ceiling beyond which price impact escalates sharply. These depth figures are a point-in-time estimate.
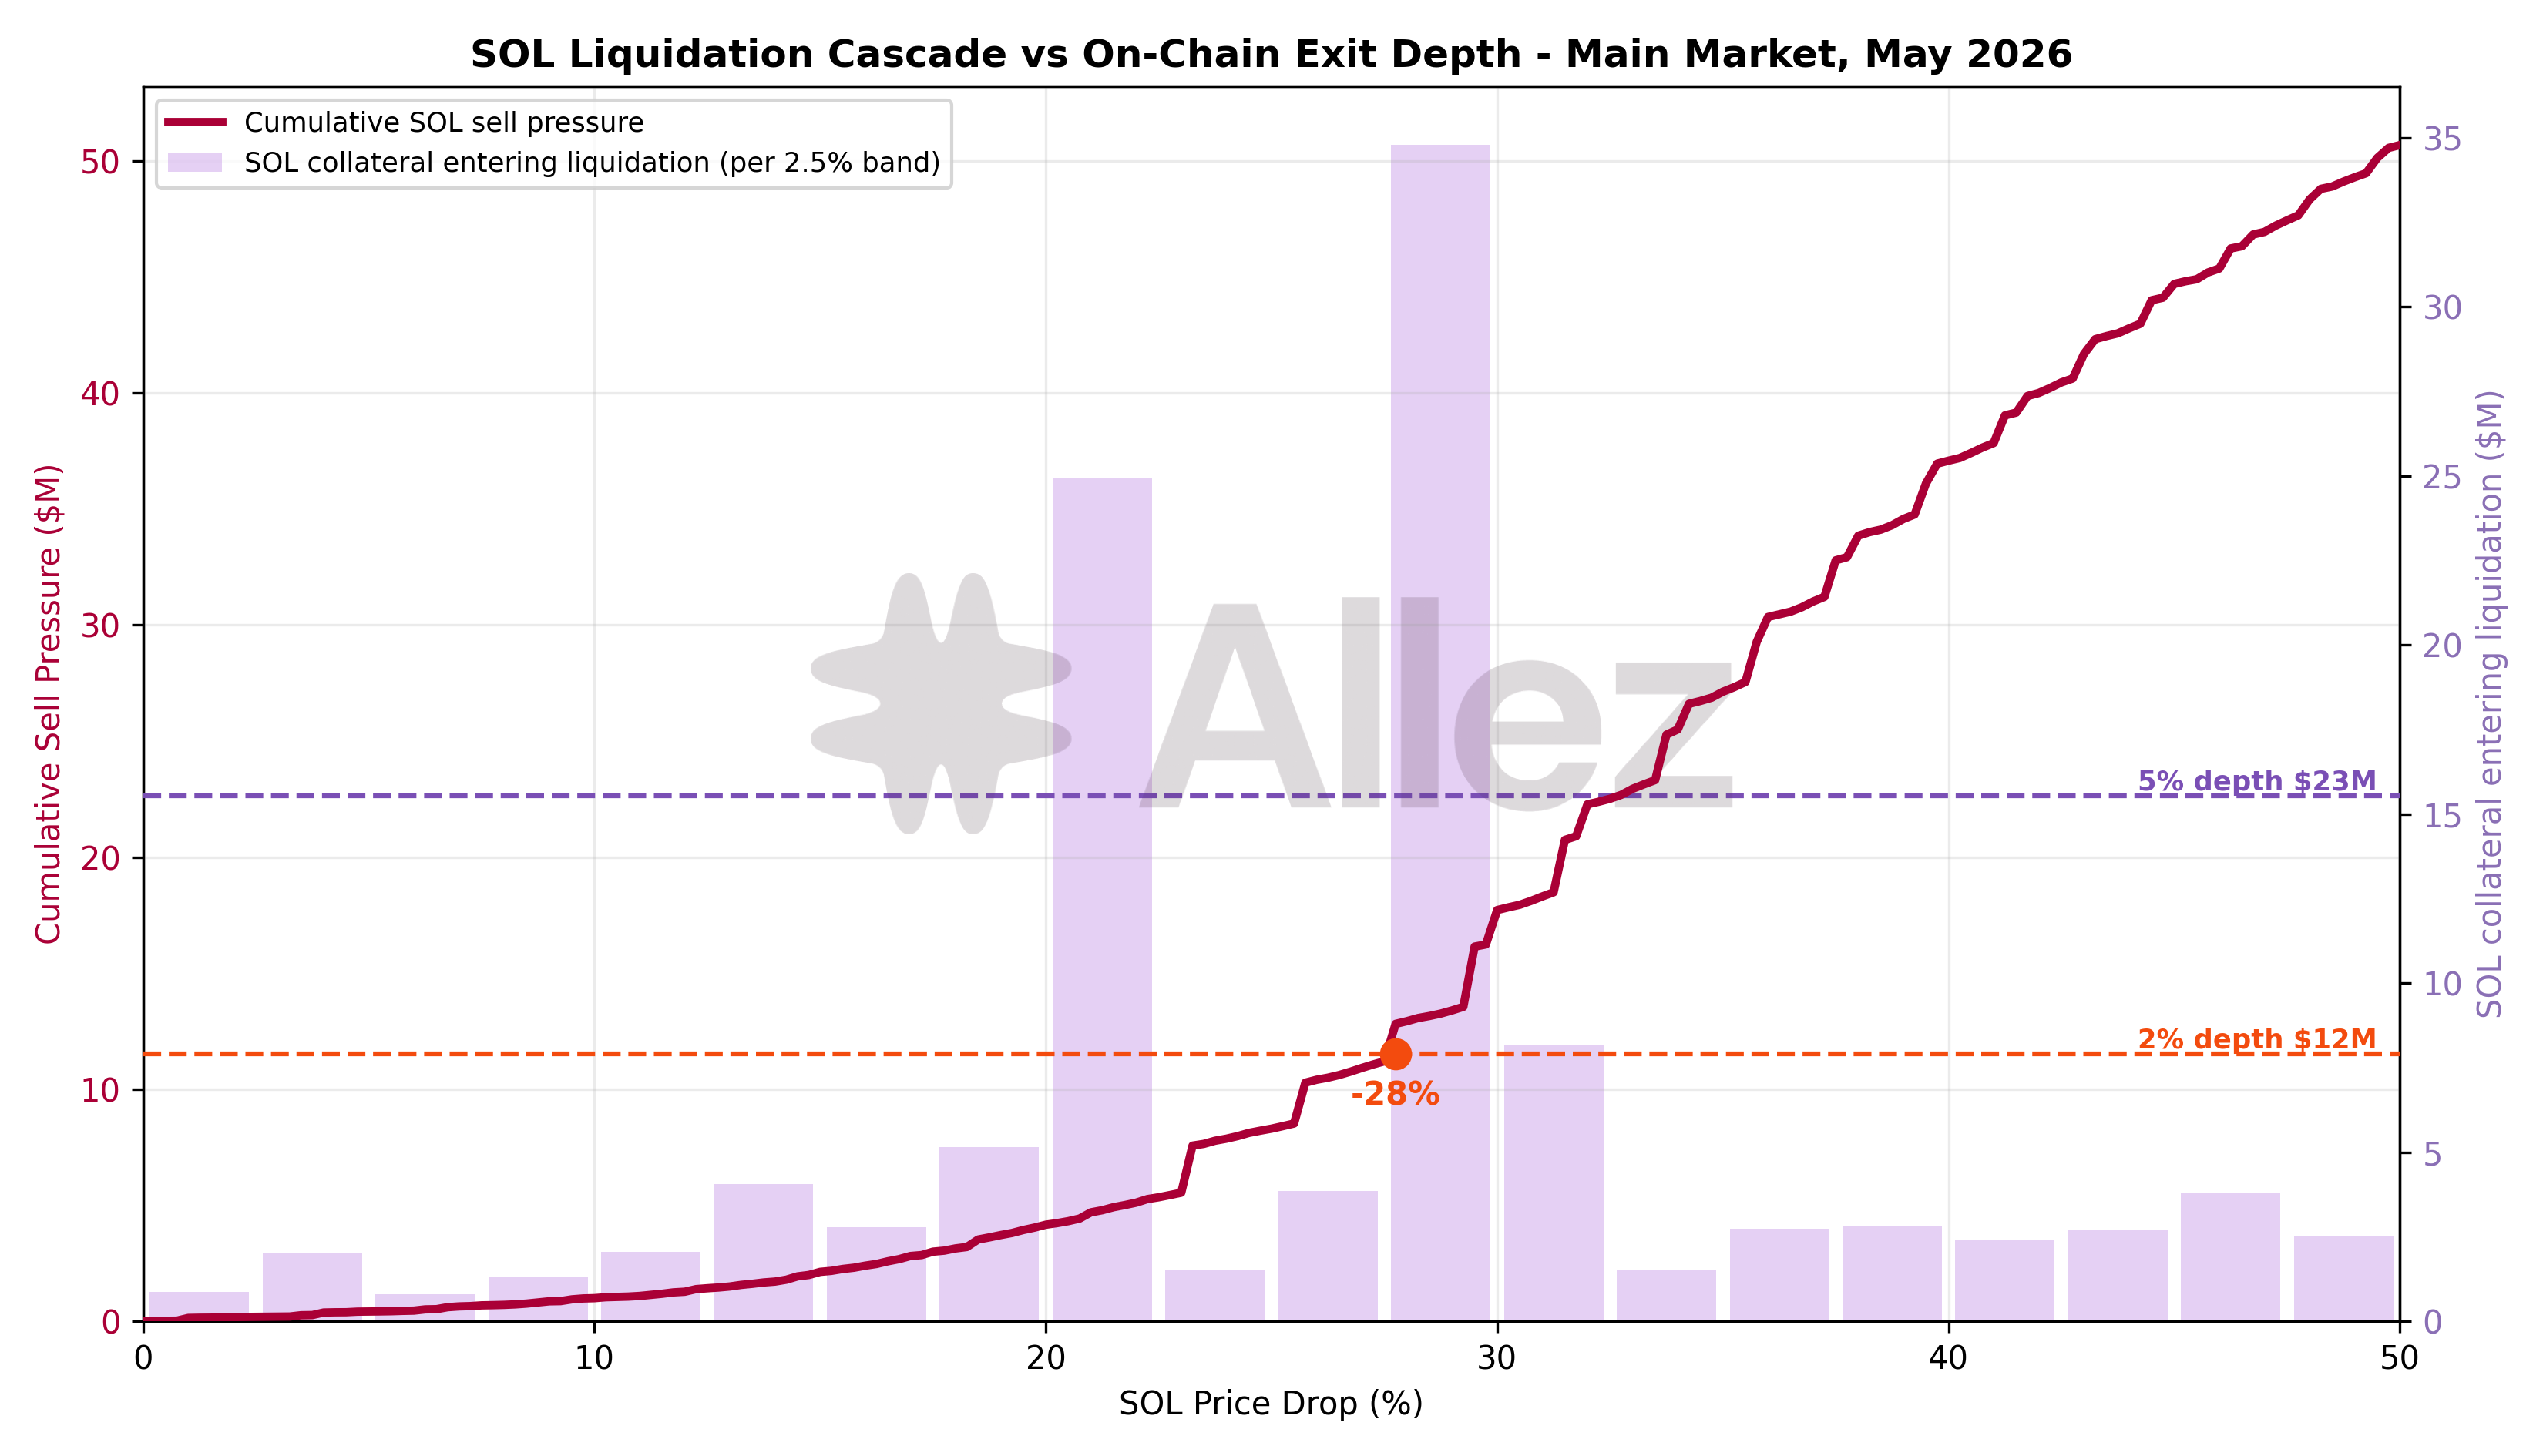
| SOL price drop | Cumulative SOL sell pressure | Price impact to clear | 2% depth coverage | 5% depth coverage |
|---|---|---|---|---|
| -10% | $1.0M | 0.04% | 11.6x | 22.7x |
| -20% | $4.2M | 0.21% | 2.8x | 5.4x |
| -30% | $17.7M | 2.63% | 0.7x | 1.3x |
| -40% | $37.1M | 39.7% | 0.3x | 0.6x |
| -50% | $50.7M | 52.6% | 0.2x | 0.4x |
At the realistic shock range, SOL liquidation sell pressure is negligible against on-chain depth: $1.0M at -10% and $4.2M at -20% clear at 0.04% and 0.21% price impact, covered comfortably by the 2% depth alone (12x at -10%, 3x at -20%). The cascade crosses the 2% depth around -28% and reaches $17.7M at -30%, clearing at 2.6% price impact. Only at -40% and beyond does sell pressure ($37.1M, then $50.7M) exceed the realizable exit ceiling, where price impact runs to 40-53%. The bars on the chart show where the SOL collateral sits by distance to liquidation, with the bulk clustered in the -20% to -30% band, which is what drives the cascade's acceleration through that range.
Two caveats bound the deep-scenario reading. The depth quoted is an atomic SOL-to-USDC exit at a single instant. A real cascade unfolds over many blocks, during which arbitrage and fresh liquidity refill the pools and liquidators can route into USDT and other pairs, so the realizable depth over a liquidation window is larger than any single-instant quote. A -40%-plus SOL move is also an extreme tail. The realistic conclusion is that SOL sell pressure is comfortably absorbed on-chain through the -25% to -30% range, and only a fast, deep drawdown would test exit depth.
Cross-asset exit-depth screen
Extending the SOL cascade across the other market-priced collateral: the breach point is the drawdown where liquidation sell pressure exceeds on-chain exit depth, so deeper is safer. The focus is uncorrelated positions only, since correlated loops don't liquidate in a market-wide drop. Liquid staking tokens have no direct dollar exit, so they route through SOL and draw on its depth. The tokenized real-world assets (PRIME, syrupUSDC, ONyc and others) are excluded: they don't fall in a broad market sell-off, and redemption paths vary, so a single DEX-depth figure may be misleading. Two further caveats apply: the breach points for the thinner pools are indicative rather than precise, and the screen is per-asset, so in a broad sell-off SOL and the liquid staking tokens would draw on the same liquidity at once, leaving aggregate headroom smaller than any single row suggests.
| Asset | Collateral | Uncorrelated debt | 2% depth breach | 5% depth breach |
|---|---|---|---|---|
| cbBTC | $76M | $40M | -11% | -11% |
| xBTC | $16M | $10M | -14% | -14% |
| dSOL | $83M | $45M | -16% | -26% |
| JLP | $45M | $28M | -26% | -32% |
| SOL | $203M | $81M | -28% | -34% |
| MSOL | $47M | $8M | -69% | -73% |
| JupSOL | $71M | $17M | -70% | never |
| JITOSOL | $20M | $7M | never | never |
| hSOL | $8M | $4M | never | never |
| stkeSOL | $2M | $1M | never | never |
Most collateral assets have ample headroom. The liquid staking tokens breach only in extreme drawdowns (MSOL -69%, JupSOL -70%) or never - their books are too small to overrun exit depth even when fully liquidated. SOL (-28%) and JLP (-26%) sit mid-range. The thinnest exits are the Bitcoin wrappers, cbBTC (-11%) and xBTC (-14%), shallow on Solana relative to their lending exposure, and dSOL (-16%), concentrated in a few large positions.
4. Per-Market Micro Analysis
Spotlight: the Ethena USDe/USDG market USDe, Ethena’s synthetic dollar, is a tokenized basis trade that pioneered the delta-neutral stablecoin model and now crypto’s six largest stablecoin. Its backing has evolved beyond that original trade. Only 12% now sits in the delta-neutral basis position, spot BTC and ETH hedged with short perpetual futures on centralized exchanges, custodied off-exchange through Ceffu and Copper. The other ~88% sits in stablecoins: liquid reserves of vanilla stablecoins (PYUSD, USDC, RLUSD and USDT), roughly 43% lent into DeFi across Aave, Morpho, Jupiter and Kamino itself, plus Ethena’s own T-bill-backed USDtb.
That mix trades dependency for stability. USDe scores well on peg stability, since most of the backing is now dollar-equivalent stablecoins or a delta-neutral hedged position. Resilience rests on two specific dependencies: the basis leg carries centralized-exchange counterparty and funding-rate risk, and the ~43% lent into DeFi sits with external lending counterparties. Its largest single reserve, USDtb, also adds a layered dependency: USDtb is backed by BlackRock’s BUIDL tokenized money-market fund, so that slice of USDe depends on a TradFi vehicle - and its redemption mechanics - not obvious from the USDe label.
That backing is precisely what the Kamino market’s peg protections are built around: a hardcoded 1:1 USDe/USDT oracle with a ±1% pause band, LTV and leverage caps calibrated so a temporary depeg cannot liquidate a user, and a LayerZero bridge for USDe secured by four independent verifiers (DVNs) that must all sign each transfer, above the three-verifier minimum we require of bridged collateral.
The Kamino market pairs USDe with USDG, the Global Dollar Network’s regulated stablecoin, in a one-click Multiply venue. Users deposit USDe, borrow USDG against it, and loop up to 12.5x to earn the spread between USDe’s ~4% native yield and the lower USDG borrow rate, with the yield auto-compounding into the collateral.
The market scaled fast. It passed $400M of supply and reached its $200M USDG borrow cap within a day of launch, then closed the month at $483.2M of supply and $211.7M of USDG debt at 43.8% utilization, the protocol’s second-largest market.
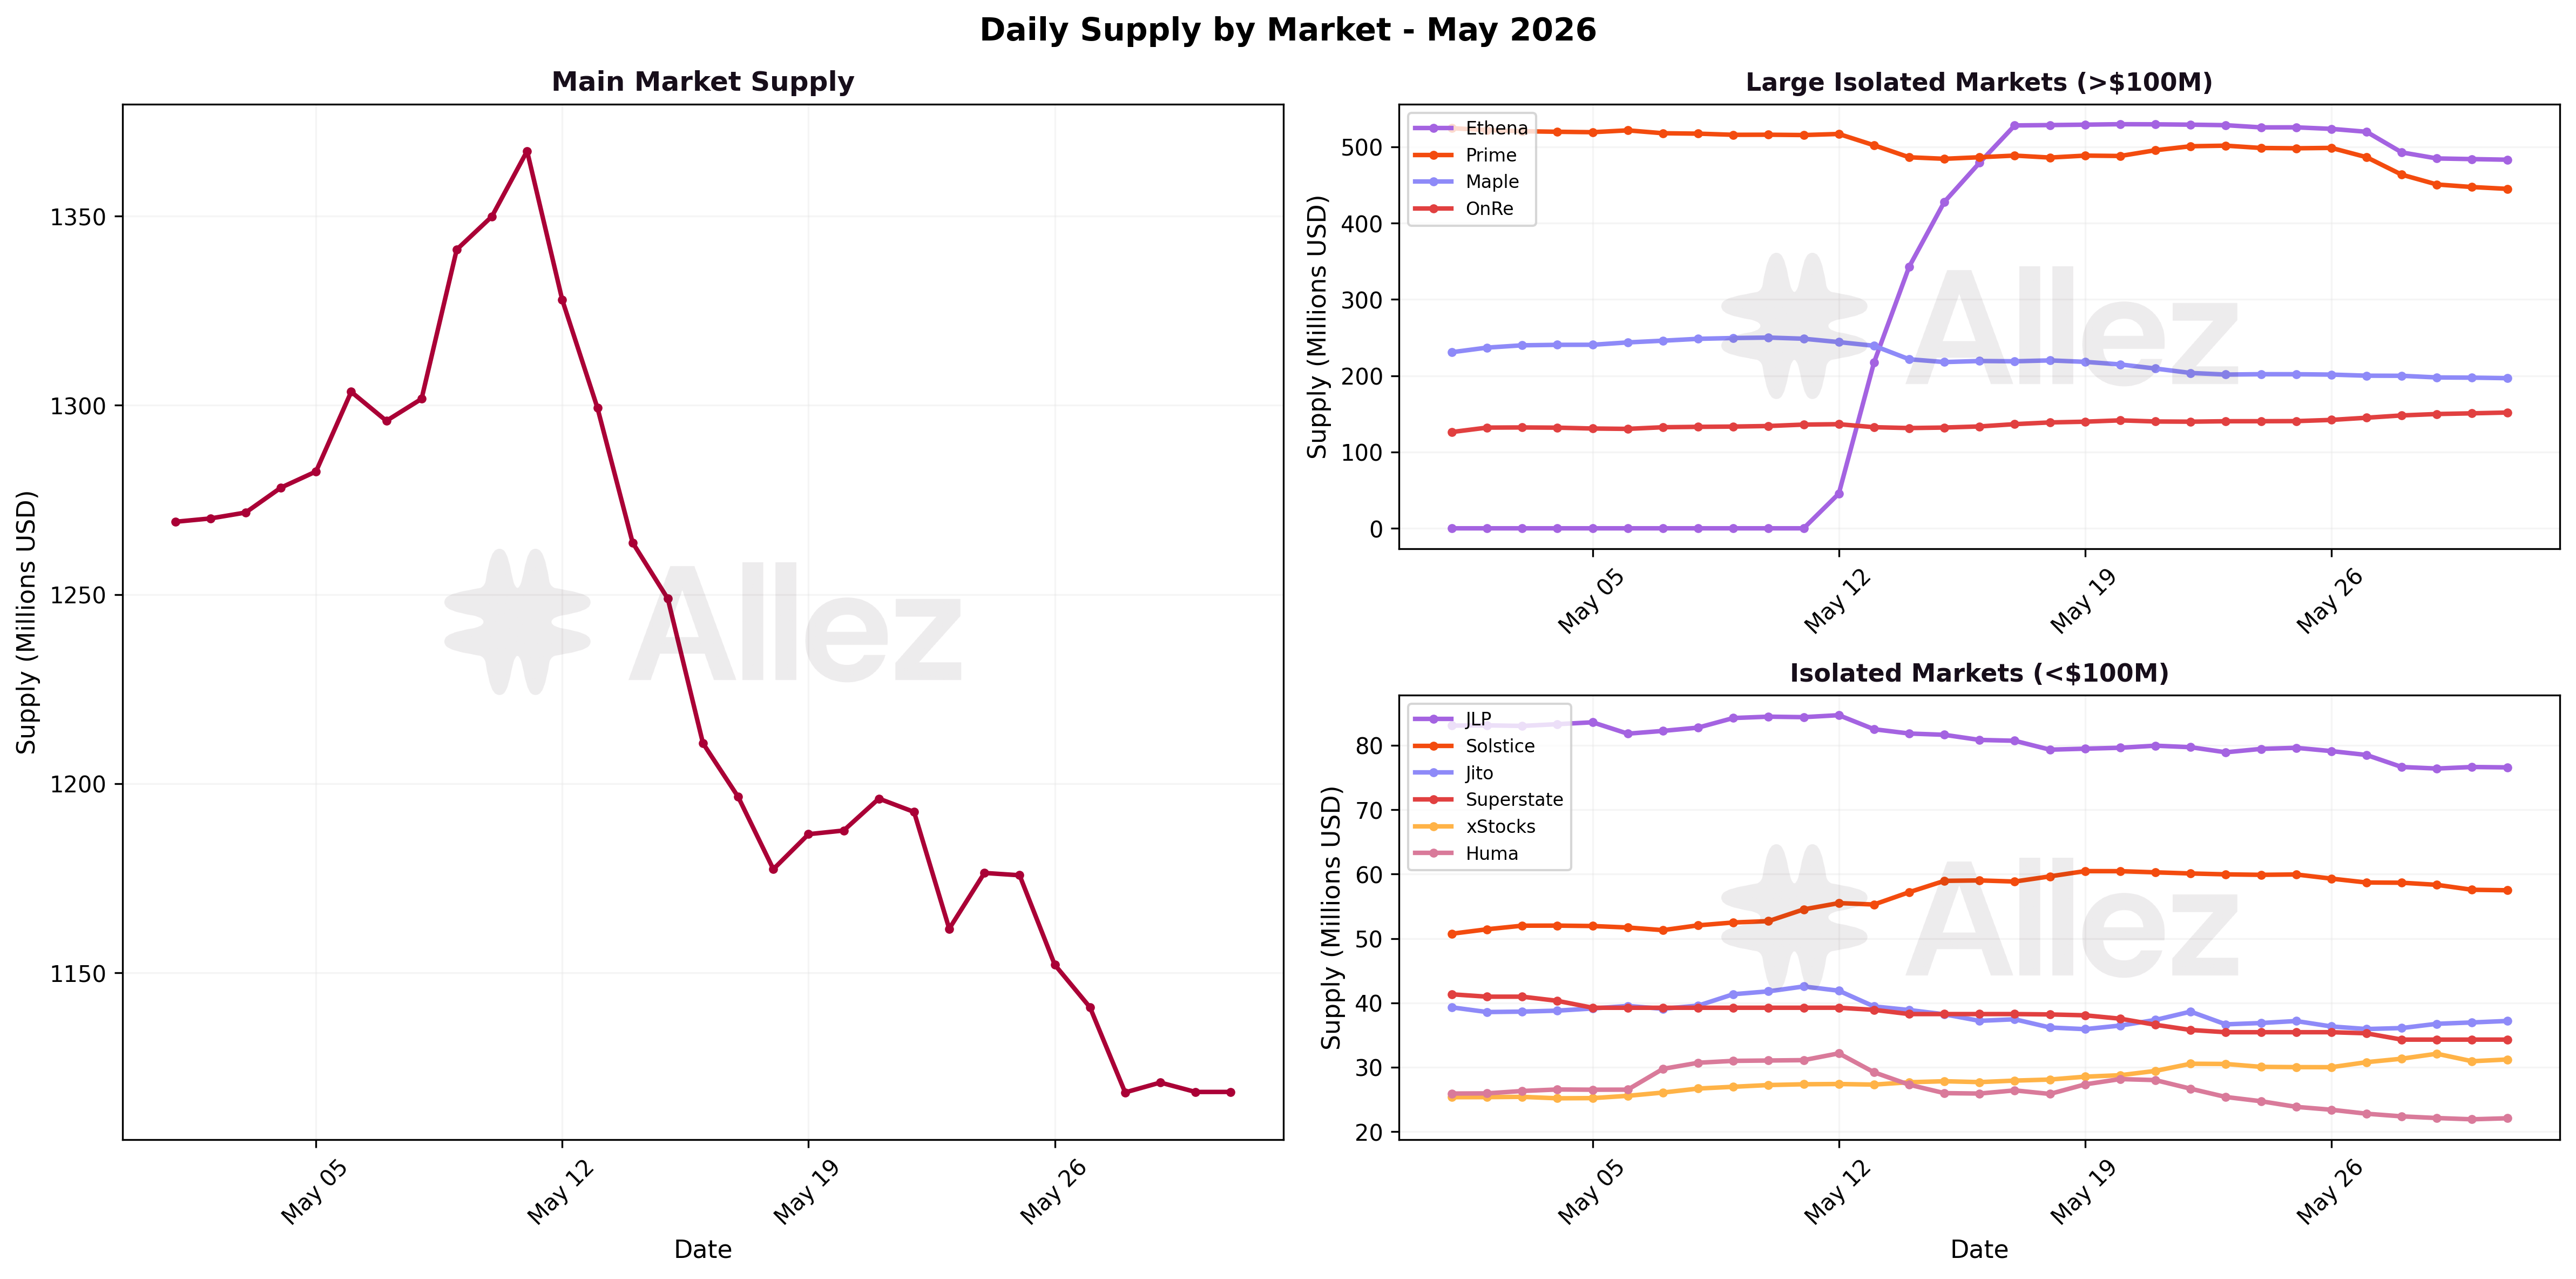
Several specialized markets also expanded significantly: OnRe added +24.3% to $152M, now a top-five market by supply, xStocks rose +24.2% to $31M alongside its new borrow-incentive campaign, and Solstice grew +13.7% to $58M. The established markets, by contrast, deleveraged as capital rotated to yield rather than volatility plays. Main eased -11.3% to $1,119M, its daily series peaking near $1,365M on May 11 before drifting lower as the new market scaled, while Prime (-15.6% to $445M) and Maple (-15.0% to $197M) reflected the PRIME and stablecoin outflows noted above, and Superstate (-17.5%) and Huma (-14.7%) eased.
Market snapshot (supply > $20M):
| Market | Supply | Supply MoM | Debt | Debt MoM | Util |
|---|---|---|---|---|---|
| Main | $1,118.6M | -11.3% | $457.4M | -10.3% | 40.9% |
| Ethena | $483.2M | new | $211.7M | new | 43.8% |
| Prime | $444.9M | -15.6% | $184.7M | -18.8% | 41.5% |
| Maple | $196.8M | -15.0% | $80.9M | -13.0% | 41.1% |
| OnRe | $151.8M | +24.3% | $49.1M | +23.4% | 32.3% |
| JLP | $76.6M | -6.9% | $27.6M | -5.4% | 36.0% |
| Solstice | $57.5M | +13.7% | $22.5M | +20.6% | 39.1% |
| Jito | $37.2M | -5.0% | $16.4M | -8.4% | 44.1% |
| Superstate | $34.3M | -17.5% | $12.4M | -20.9% | 36.0% |
| xStocks | $31.2M | +24.2% | $6.8M | +36.8% | 21.7% |
| Huma | $22.1M | -14.7% | $7.3M | -17.7% | 32.9% |
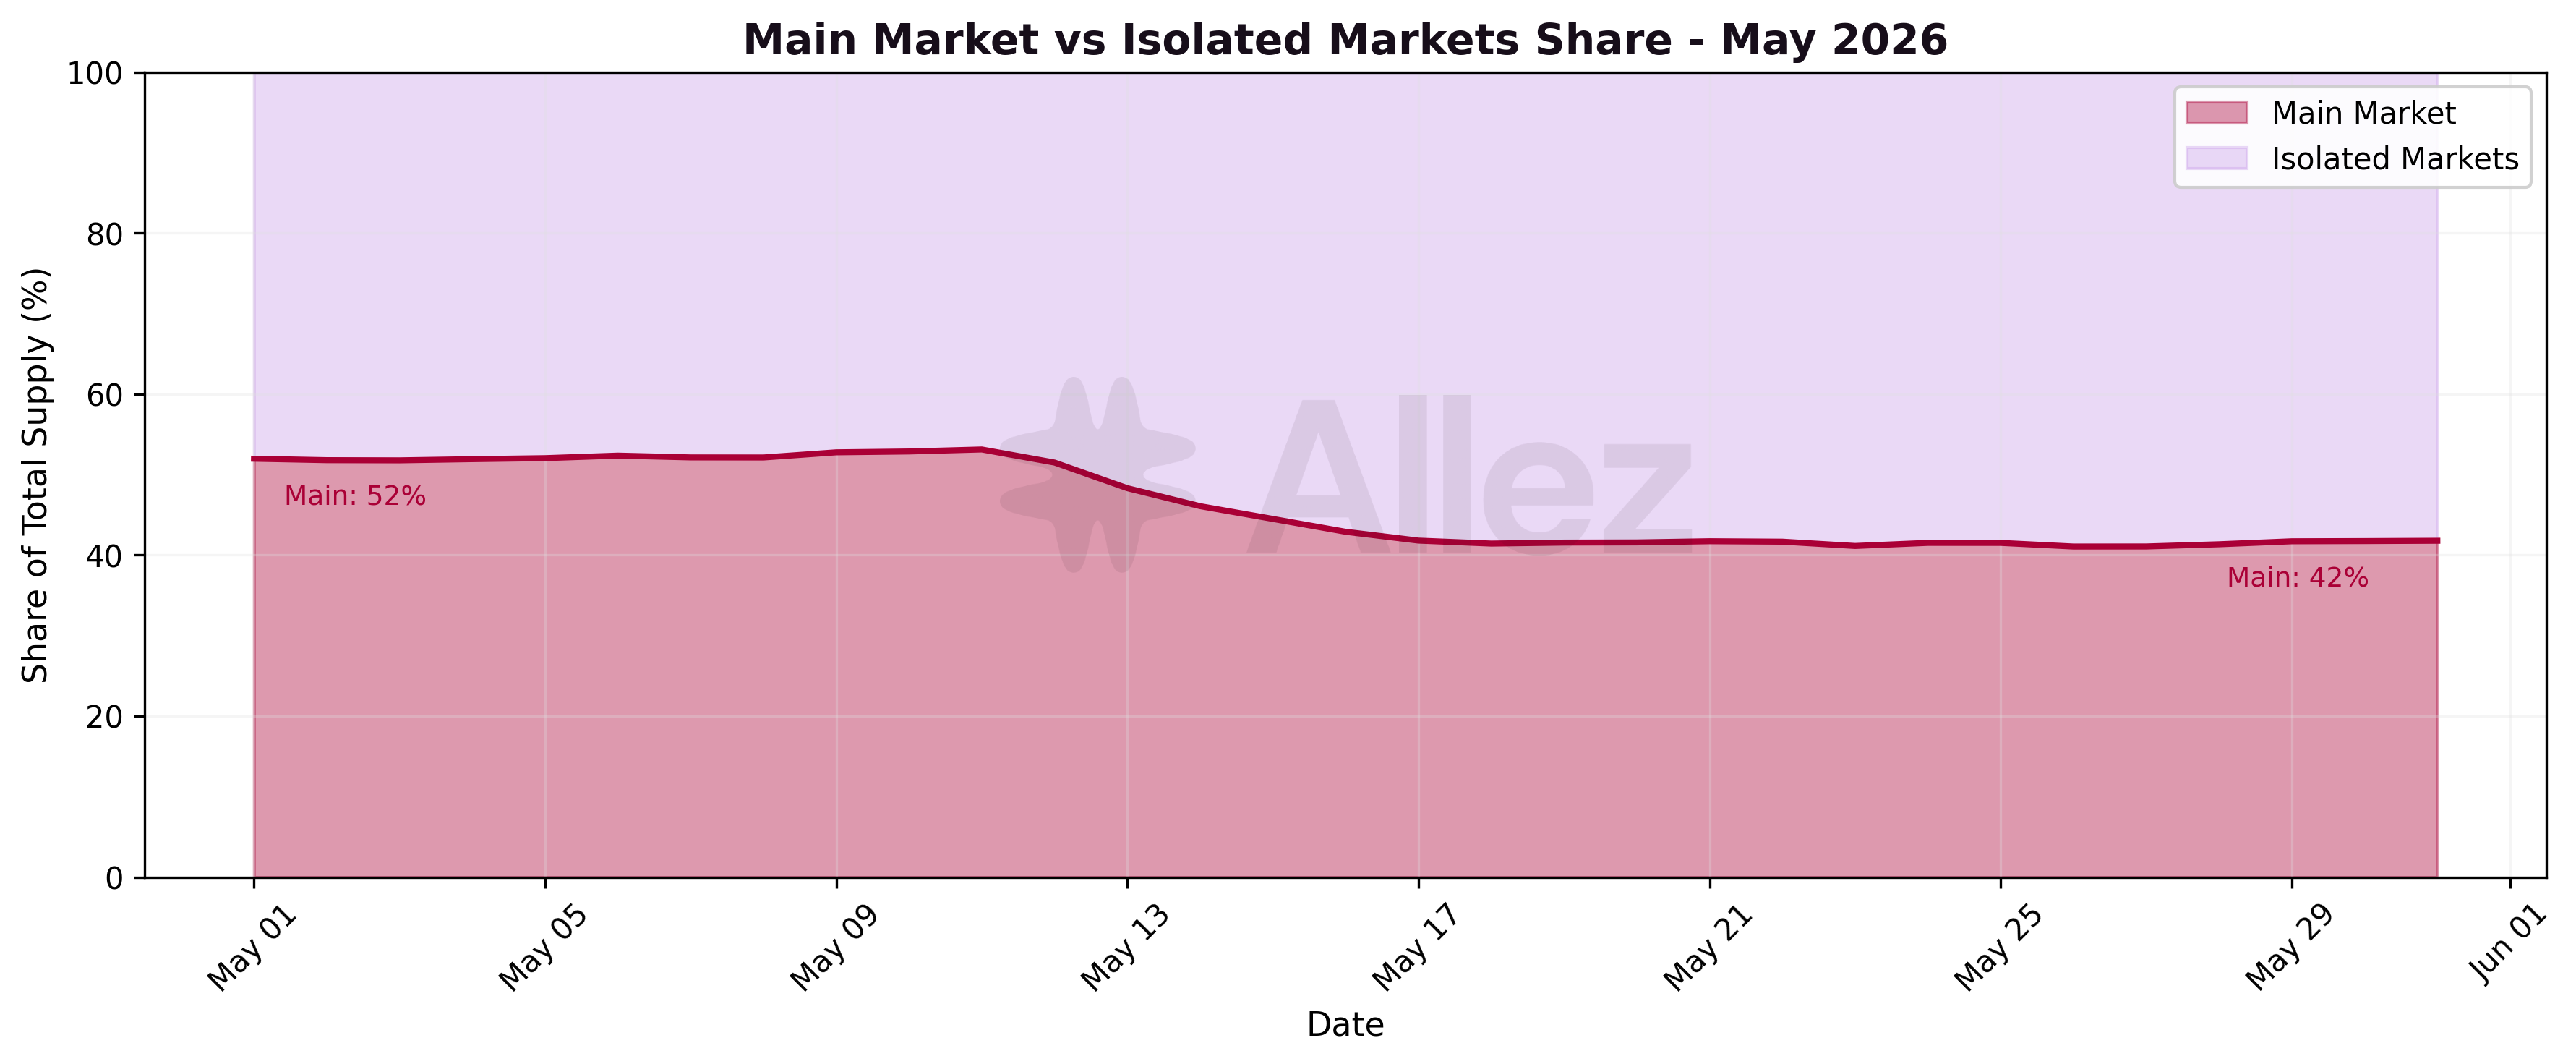
The Main market's share of protocol supply fell as the Ethena market scaled, from 52% at the start of May to 42% at month-end, its lowest share in recent months. This is a composition effect of the new launch rather than an absolute collapse in Main, which contracted a more modest -11.3%.
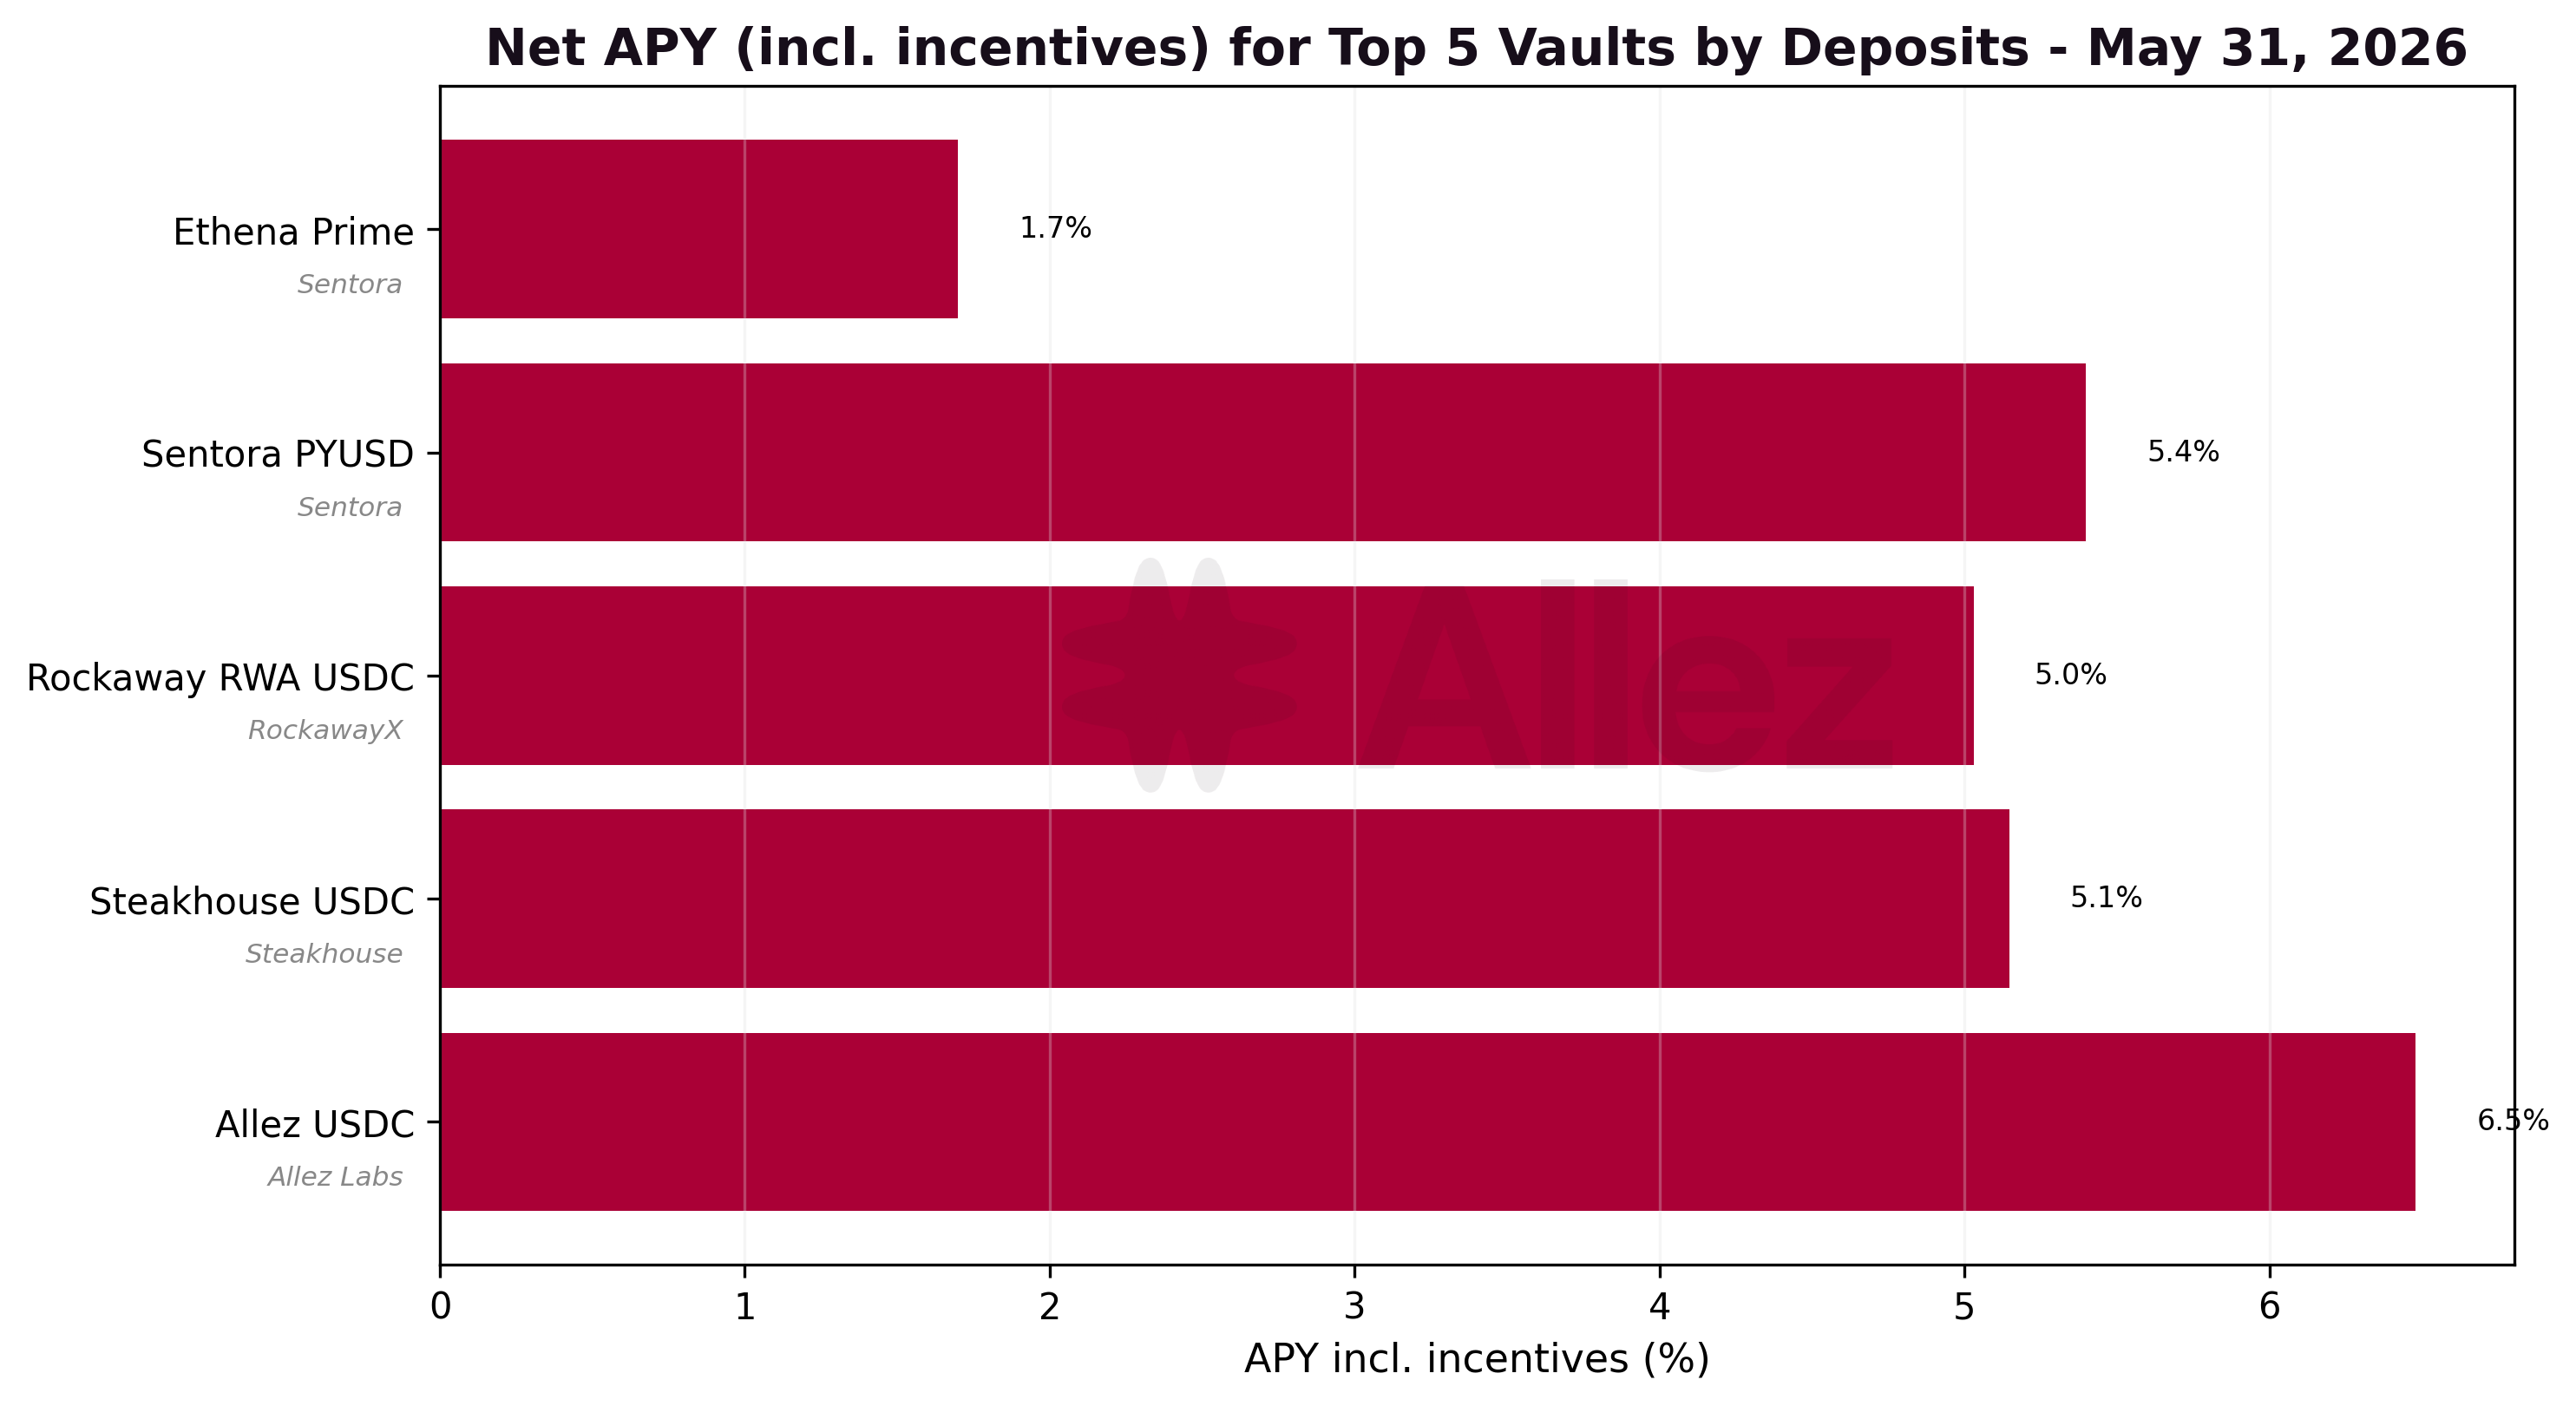
5. Kamino Lending Vaults
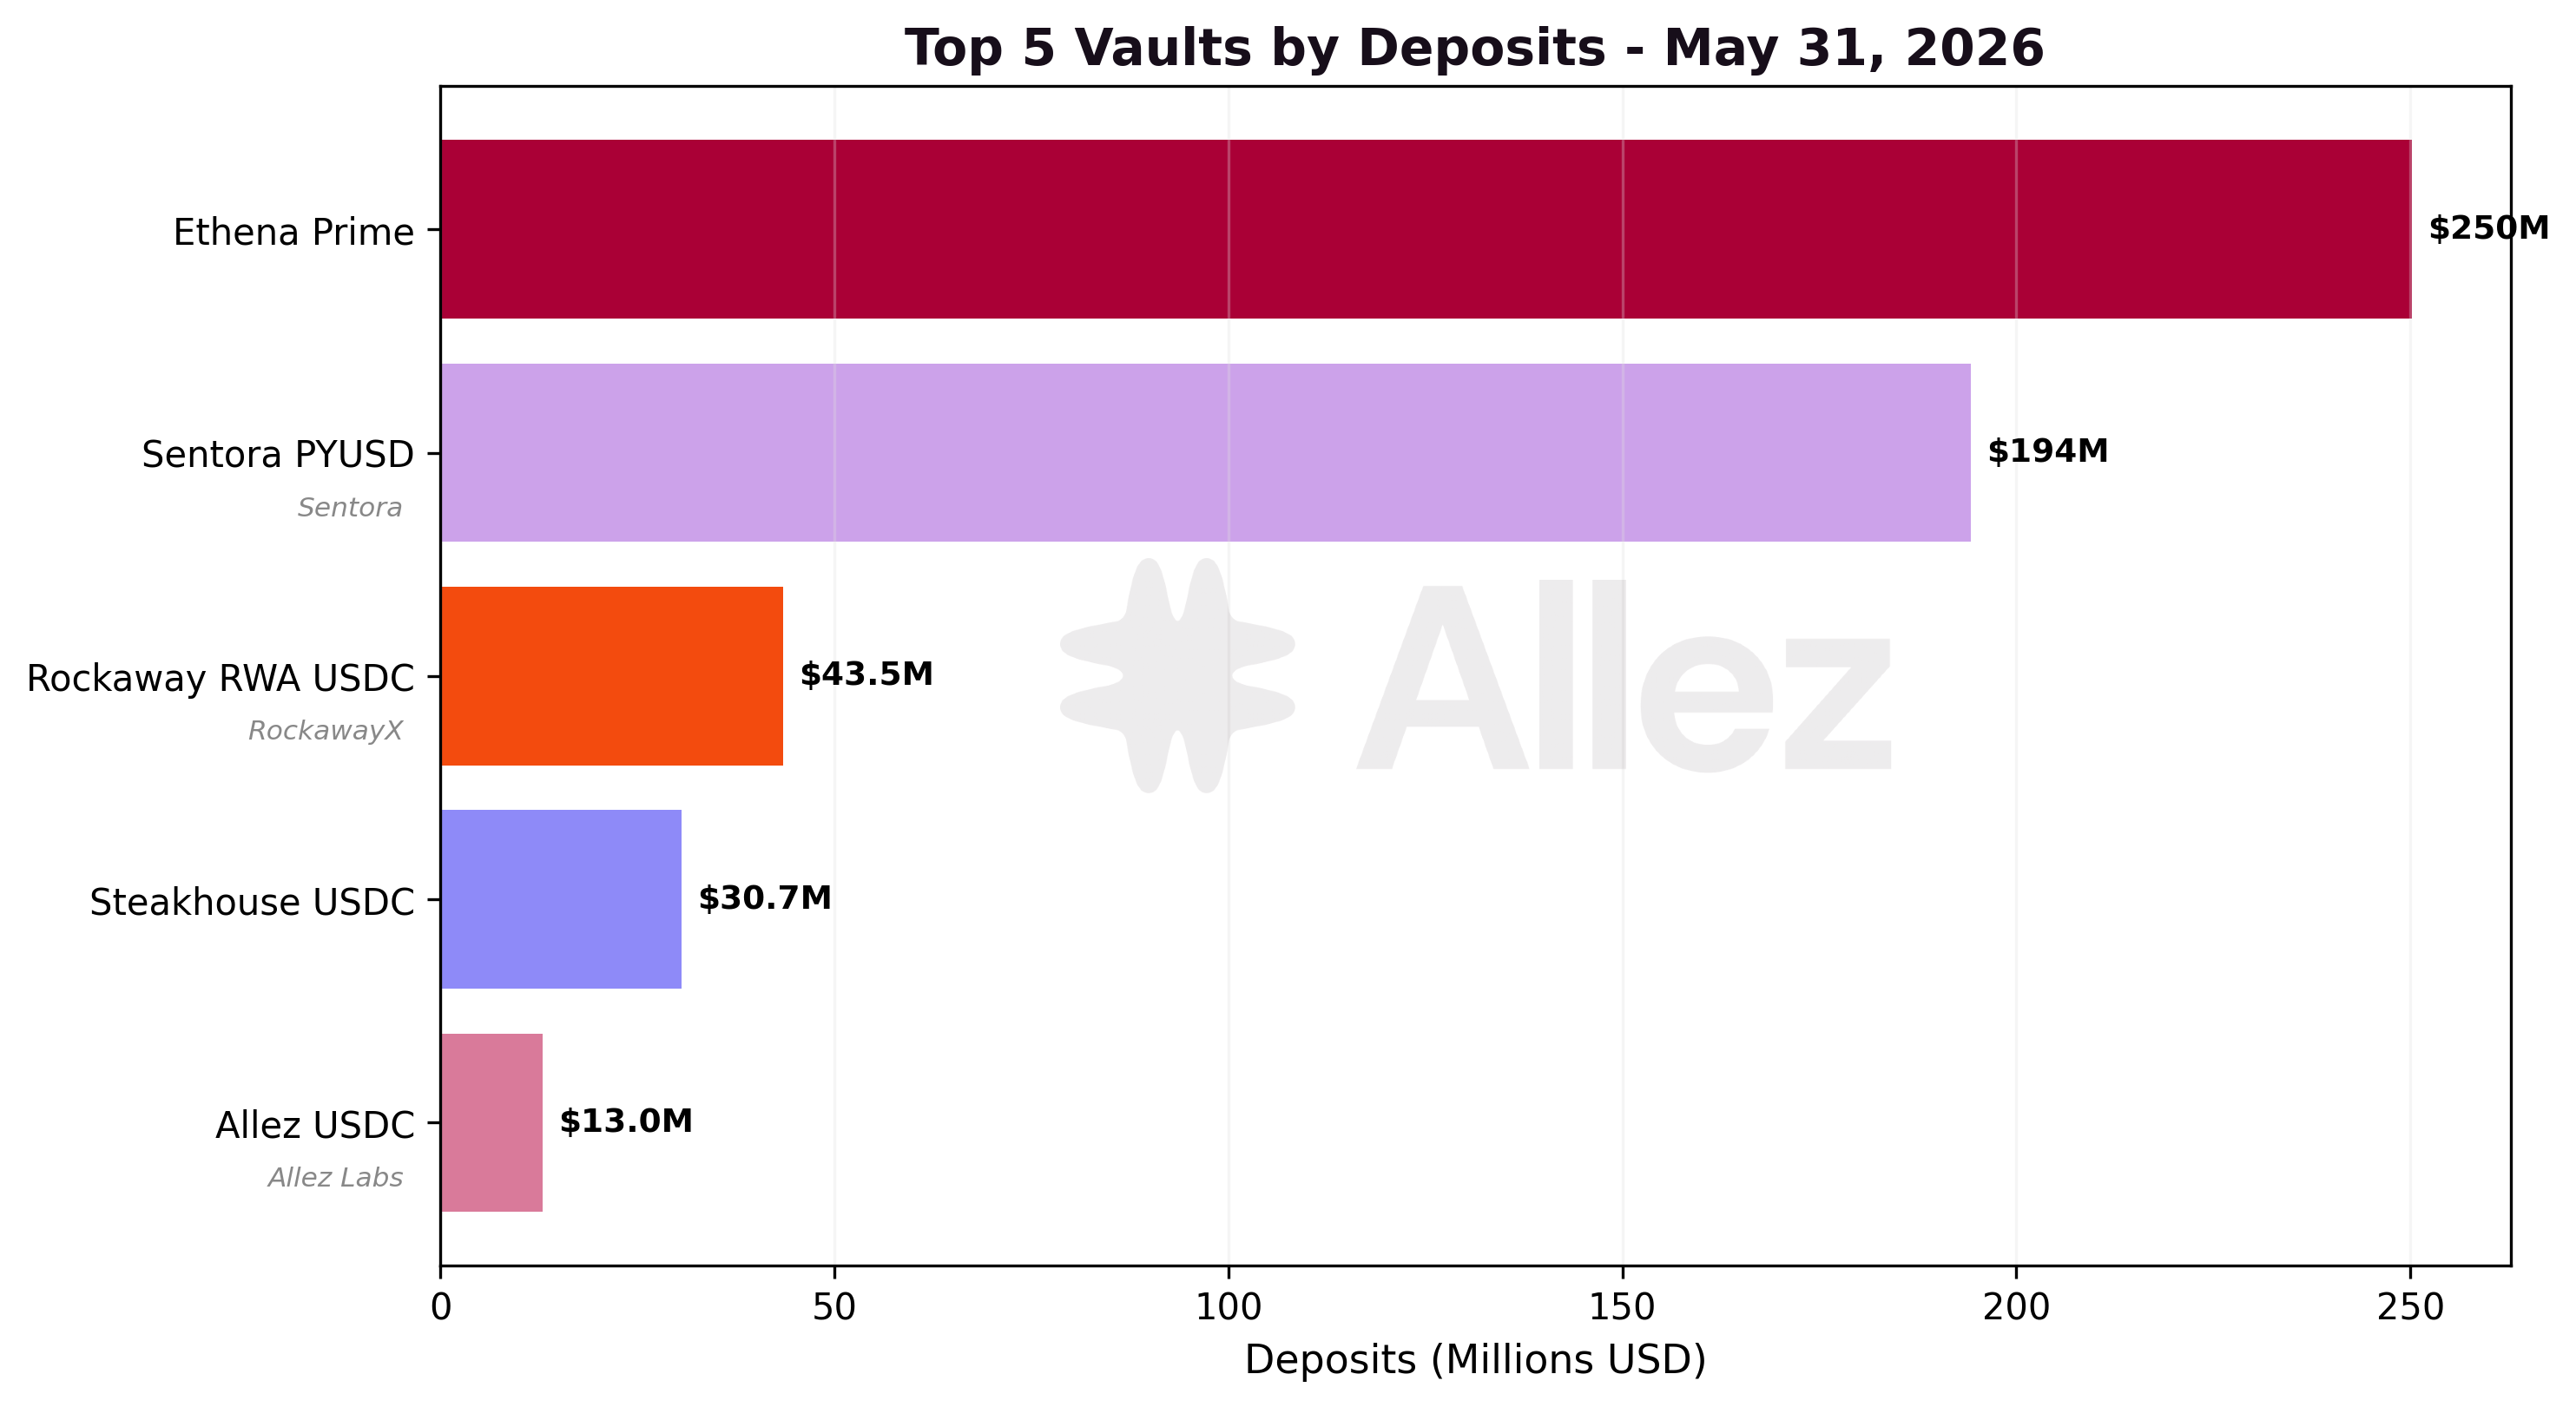
| Vault | Token | Deposits | MoM | Net APY |
|---|---|---|---|---|
| Ethena Prime | USDG | $250.2M | new | 1.7% |
| Sentora PYUSD | PYUSD | $194.2M | -7.7% | 5.4% |
| Rockaway RWA USDC | USDC | $43.5M | +30.1% | 5.0% |
| Steakhouse USDC | USDC | $30.7M | +27.4% | 5.1% |
| Allez USDC | USDC | $13.0M | -2.1% | 6.5% |
| CASH Earn | CASH | $11.1M | -21.3% | 4.4% |
| Allez SOL | SOL | $6.2M | +9.5% | 4.7% |
Total vault deposits reached $587M, with the entire month-over-month increase attributable to the Ethena Prime vault ($250M of USDG). That vault routes its deposits into the market's USDG reserve. Excluding it, vault deposits were flat MoM, with the USDC curator vaults (Rockaway RWA, Steakhouse) growing and Sentora PYUSD easing -7.7%.
6. Transaction Volume & User Behavior
Transaction volume totalled $3.75B across 202,790 transactions, down -32% MoM and continuing a multi-month decline. The drop is broad-based across markets rather than concentrated, and is consistent with lower turnover in a low-volatility month.
| Type | Volume | Share | MoM |
|---|---|---|---|
| Withdraw | $1.33B | 35% | -38% |
| Deposit | $1.32B | 35% | -31% |
| Borrow | $0.60B | 16% | -3% |
| Repay | $0.49B | 13% | -38% |
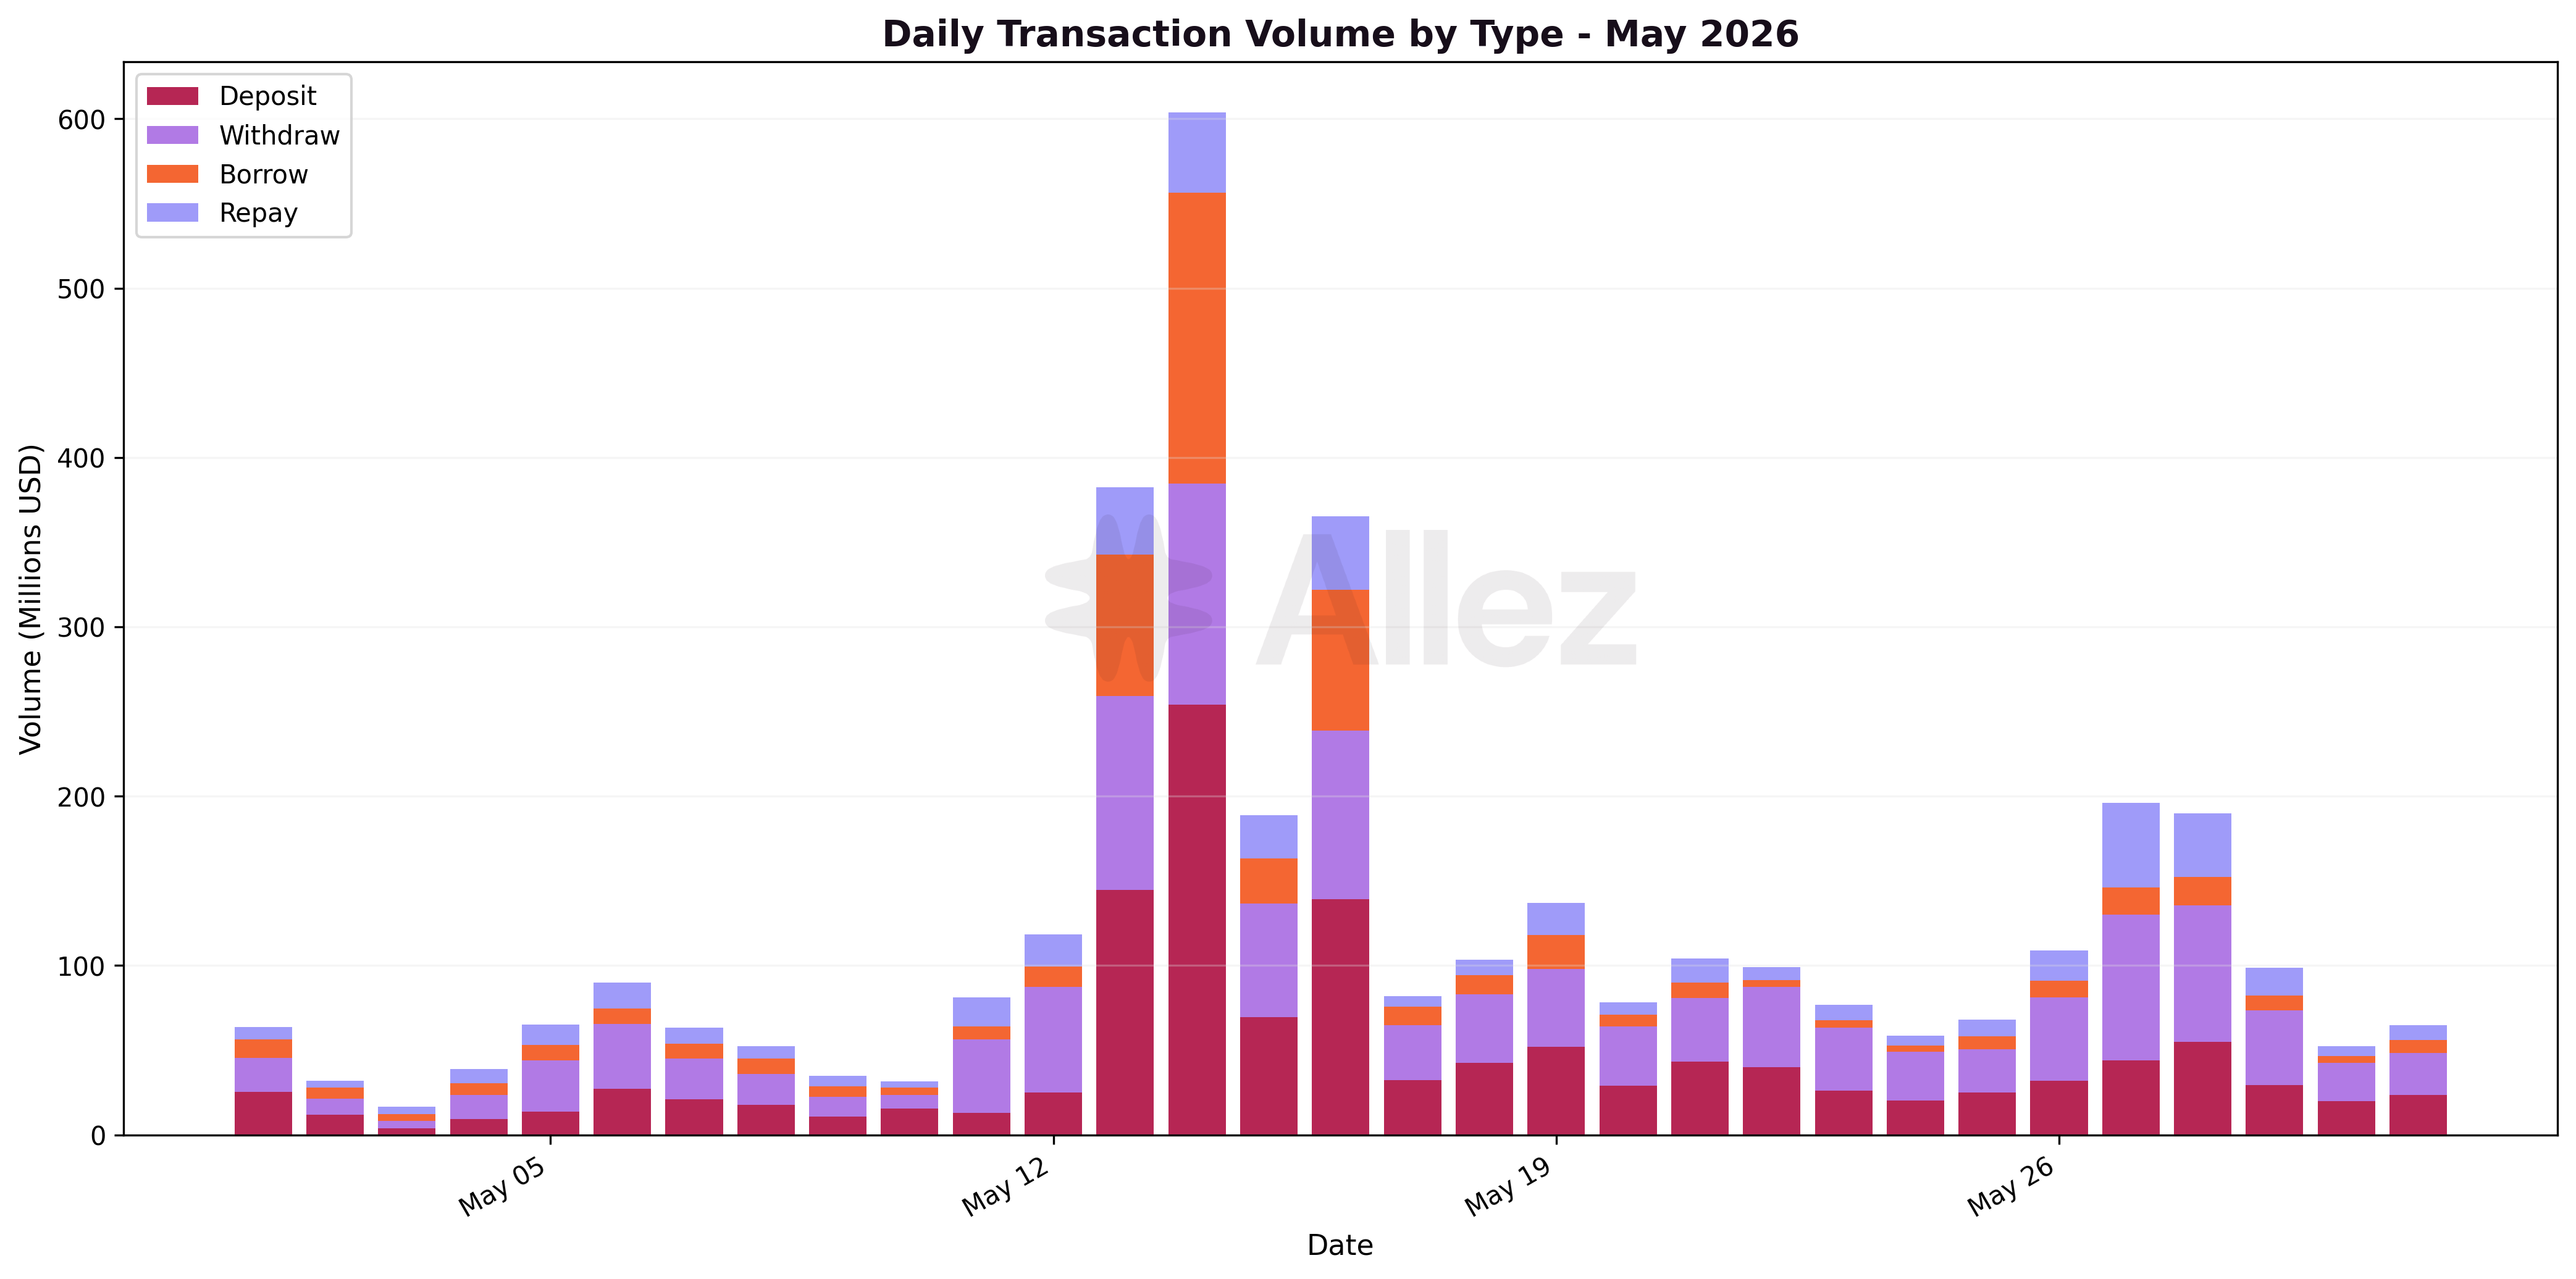
Deposit and withdrawal volume were nearly balanced ($1.32B vs $1.33B), consistent with rotation between markets rather than net capital entering or leaving the protocol on the supply side. All four types fell month-over-month, withdrawals and repays the most (-38% each), while borrows held nearly flat (-3%) as the Ethena market's new USDG borrowing offset the decline in the established markets.
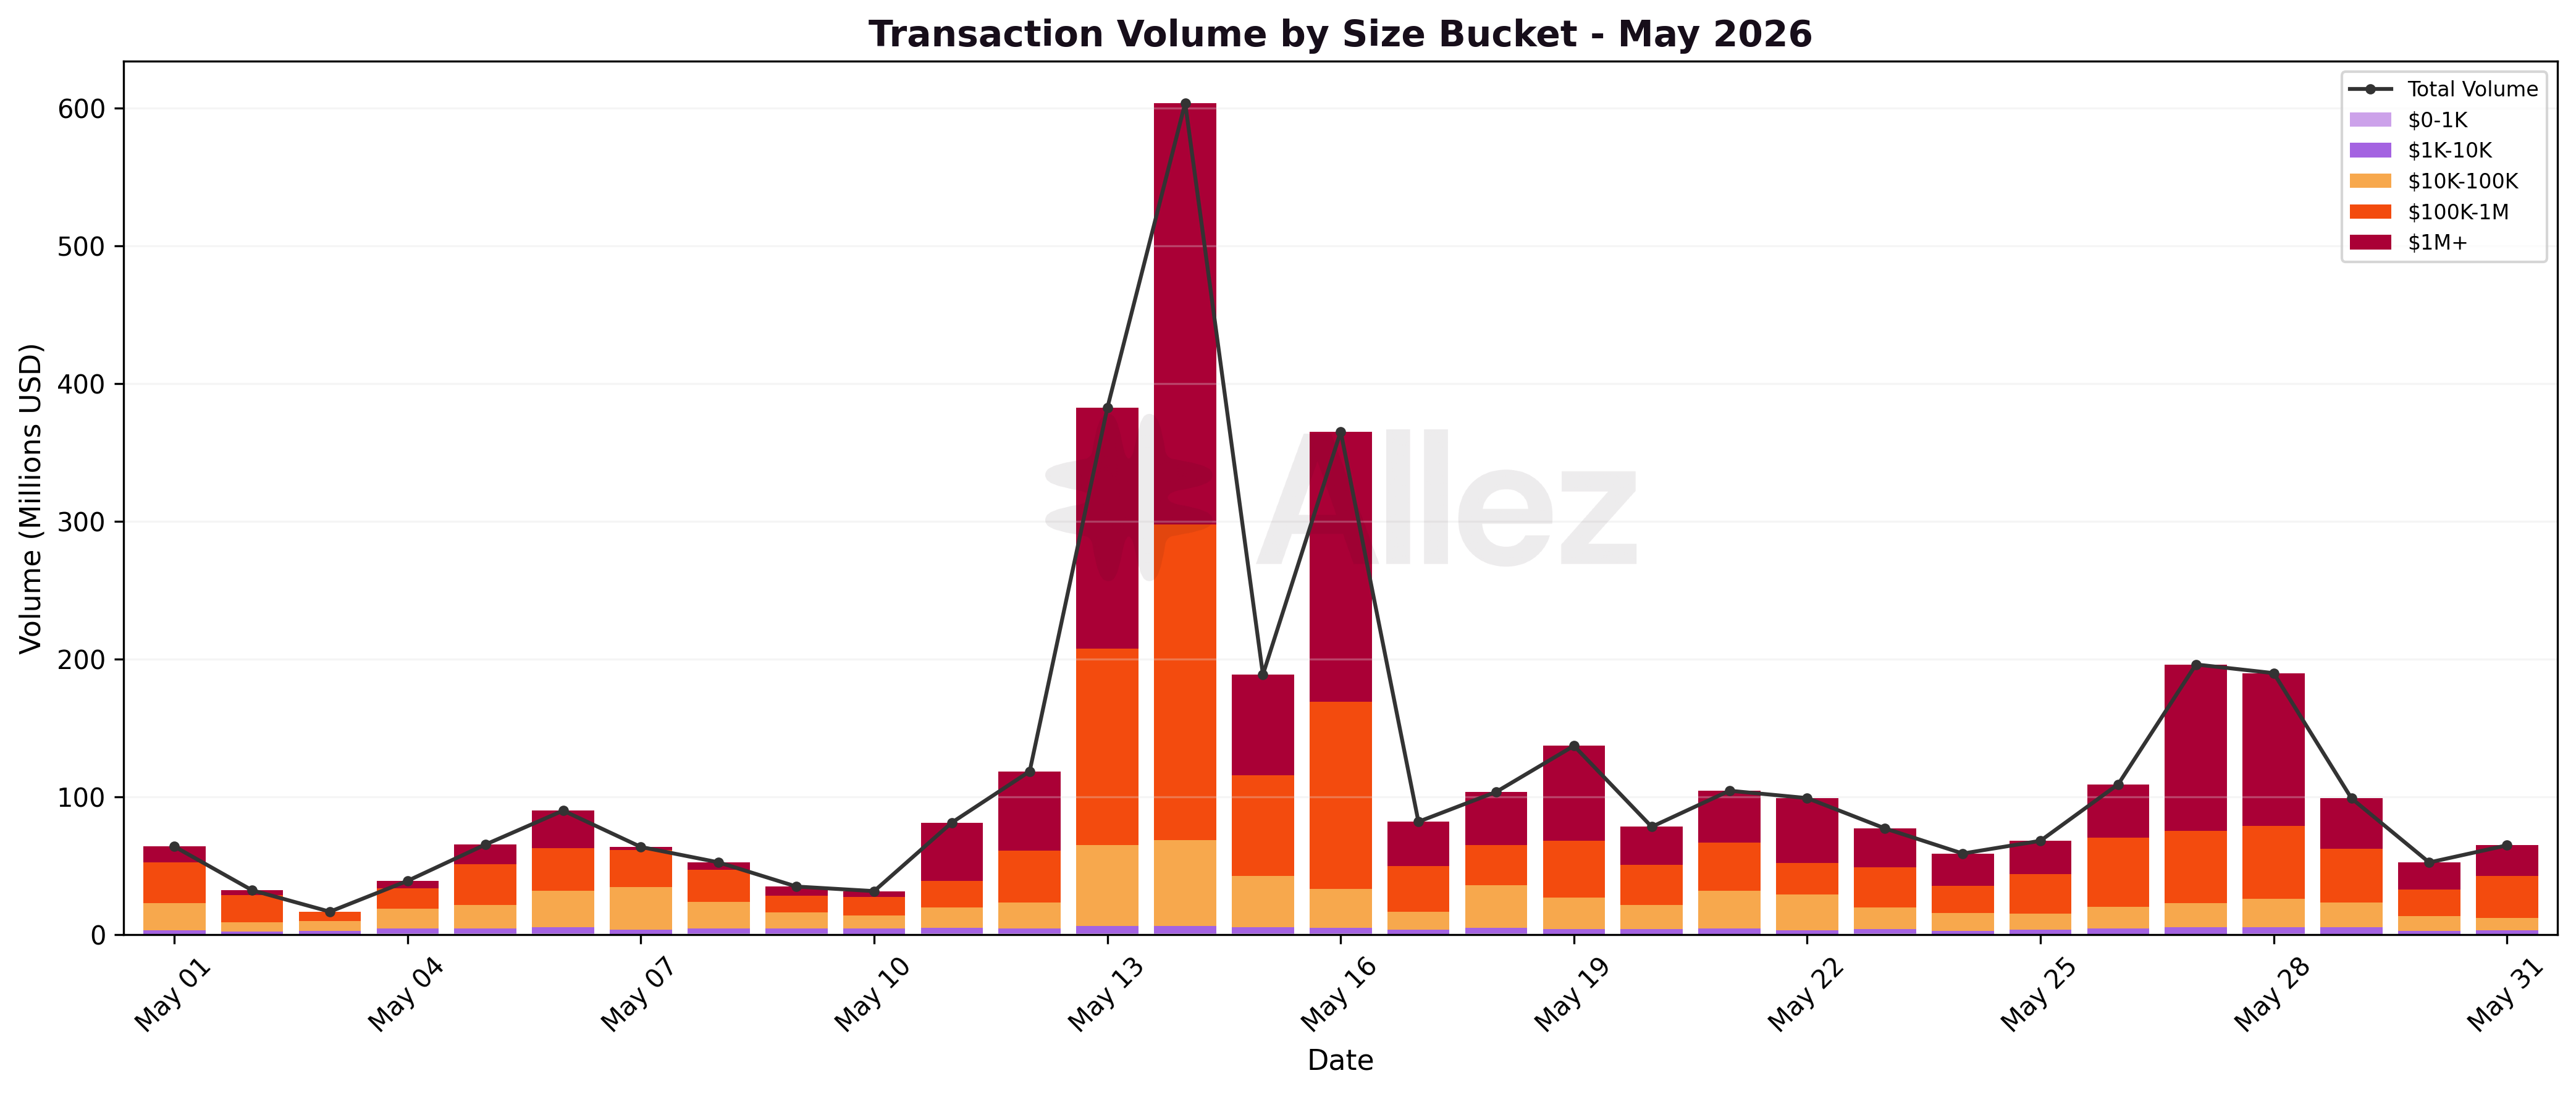
| Size Bucket | Volume | Share | Transactions |
|---|---|---|---|
| $1M+ | $1.61B | 43% | 573 |
| $100K-1M | $1.36B | 36% | 4,252 |
| $10K-100K | $0.65B | 17% | 18,641 |
| $1K-10K | $0.11B | 3% | 27,759 |
| $0-1K | $0.02B | 1% | 151,565 |
Large transactions ($100K+) carried 79% of the dollar volume, consistent with the Ethena market's large looping positions and curator-vault rebalancing dominating activity, while retail-sized flows (<$10K) accounted for about 4% of volume.
7. Conclusions & Forward Look
May was dominated by the launch of the Ethena USDe/USDG market, which scaled to $483M in under three weeks and drove the +10.1% supply growth. The risk profile held through the expansion: liquidations stayed minimal, no single event exceeded $100K, and SOL traded in a narrow band. Ethena’s new leverage book is a key structural addition with positions close to liquidation by design, though our historical data shows correlated delta-neutral trades carry very low liquidation risk.
The growth was multi-dimensional: specialized markets such as OnRe and xStocks expanded independently of Ethena, while the established books deleveraged in an orderly rotation toward stablecoins. Because that incoming capital is price-insensitive, the stress-test profile improved even as supply grew.
Outlook
June carries two questions. First, whether Ethena's growth proves durable and whether the tight looping economics hold. Second, whether the rotation toward stable havens settles, or extends the trend of recent months.
Appendix: Asset Category Classification
| Category | Top Assets | Month-End Supply | Supply MoM |
|---|---|---|---|
| Stablecoins | USDC, USDG, USDe, PYUSD | $1,198.4M | +49.4% |
| LSTs | JitoSOL, JupSOL, mSOL, dSOL, INF | $527.7M | -14.9% |
| RWAs | PRIME, syrupUSDC, ONyc, xStocks, eUSX | $514.6M | -7.9% |
| SOL | SOL | $269.1M | -2.7% |
| BTC | cbBTC, xBTC, WBTC | $111.3M | -1.8% |
| Other | ETH, JLP, governance/meme tokens | $56.1M | -7.1% |
Classification notes:
-
LSTs: liquid staking tokens. Any token ending in "sol" (except SOL itself) plus INF.
-
RWAs: tokenized real-world assets accessing DeFi liquidity, including PRIME, syrupUSDC (a Maple credit market token, classified as RWA despite the USDC suffix), ONyc, tokenized stocks (xStocks) and PT-* tokens.
-
Stablecoins: USDC, USDG, USDe, PYUSD, USDT, CASH, USX, USDS and other dollar- and euro-pegged tokens. USDe (Ethena's synthetic dollar) is classified here.
-
BTC: cbBTC, xBTC, WBTC and other wrapped Bitcoin.
-
Other: ETH, JLP, and governance/meme tokens.
Note: Per-asset figures reflect token quantity changes valued at month-end prices, isolating user deposit/withdrawal behavior.
This report represents independent risk analysis by Allez Labs for the Kamino Finance community.
Prepared by: Allez Labs Risk Team
Report Date: June 5, 2026
Next Report: June 2026 Monthly Report published in July 2026