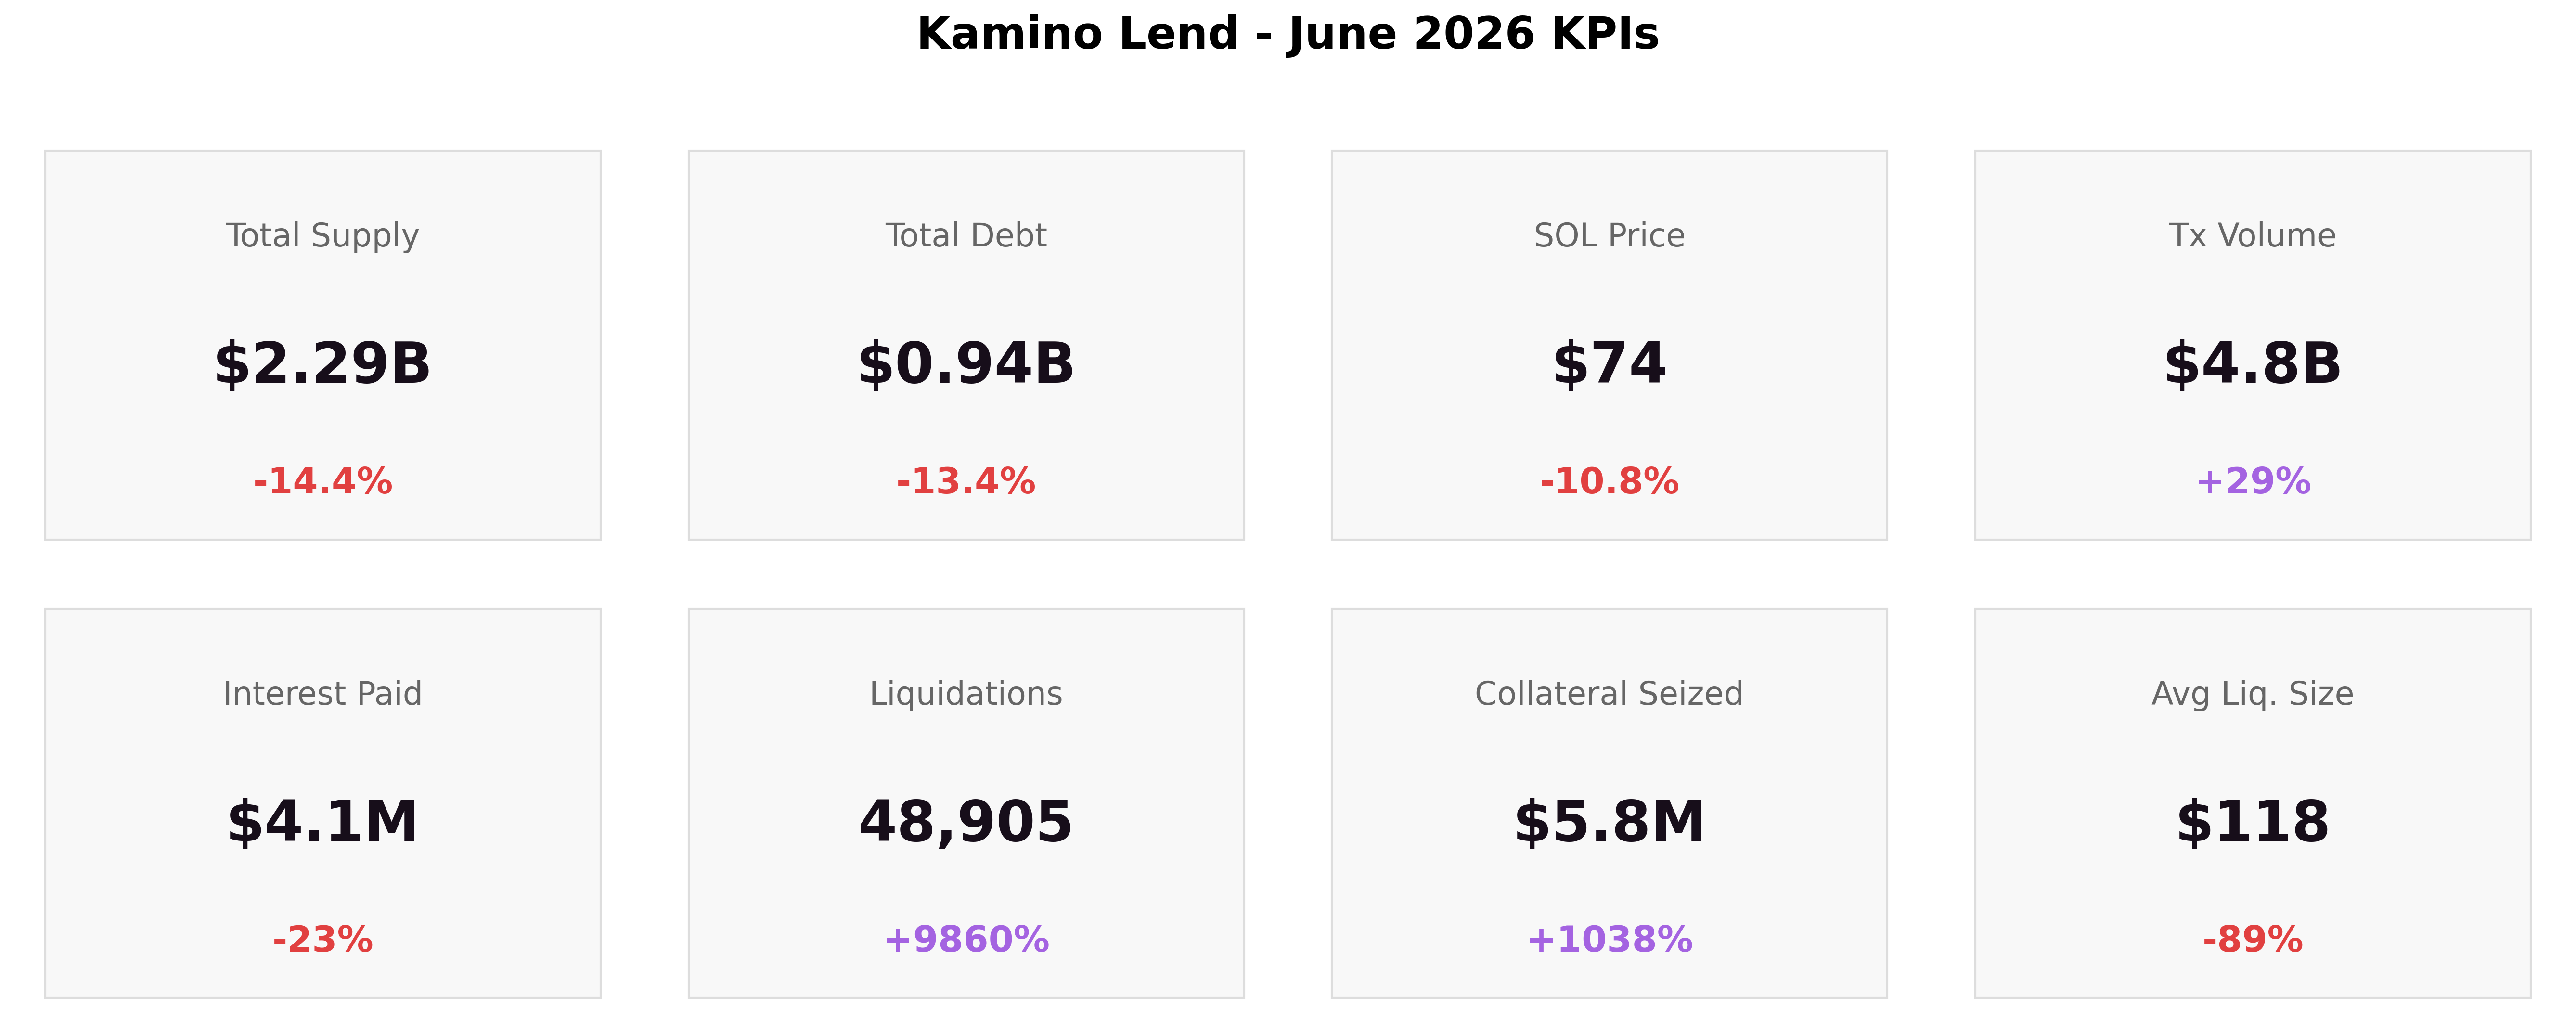
June was a broad contraction month driven by a falling SOL price, with the book deleveraging in an orderly way. Total supply fell -14.4% to $2.29B and total debt -13.4% to $0.94B as SOL fell through early June before rebounding off its lows into month-end, still below its May level. Every asset category shrank on the supply side. The headline liquidation count overstates the severity: almost all came from a single SOL-led cascade in early June, partial liquidations that trimmed leveraged positions back toward health rather than closing them out, easing once SOL stabilised. The main capital shift was a rotation in the Ethena market, which switched its borrowed stablecoin from USDG to PayPal USD (PYUSD). Transaction volume rose +28% even as balances fell, led by withdrawals and repayments. Through the month, borrowing capacity tightened where demand sits: the main looping reserves ended June near their utilization caps. Additional stablecoin lenders are needed for some markets to continue expanding.
1. Market Context & SOL Price
June reversed May's expansion. Balances contracted across every category and most markets as SOL fell through the first week, and although prices rebounded off their lows into month-end without regaining their May level, supply and debt did not follow. The month's liquidation count is dominated by an early June cascade of tiny bot-split events triggered by the SOL drawdown.
-
Total Supply: $2.29B (-14.4%)
-
Total Debt: $0.94B (-13.4%)
-
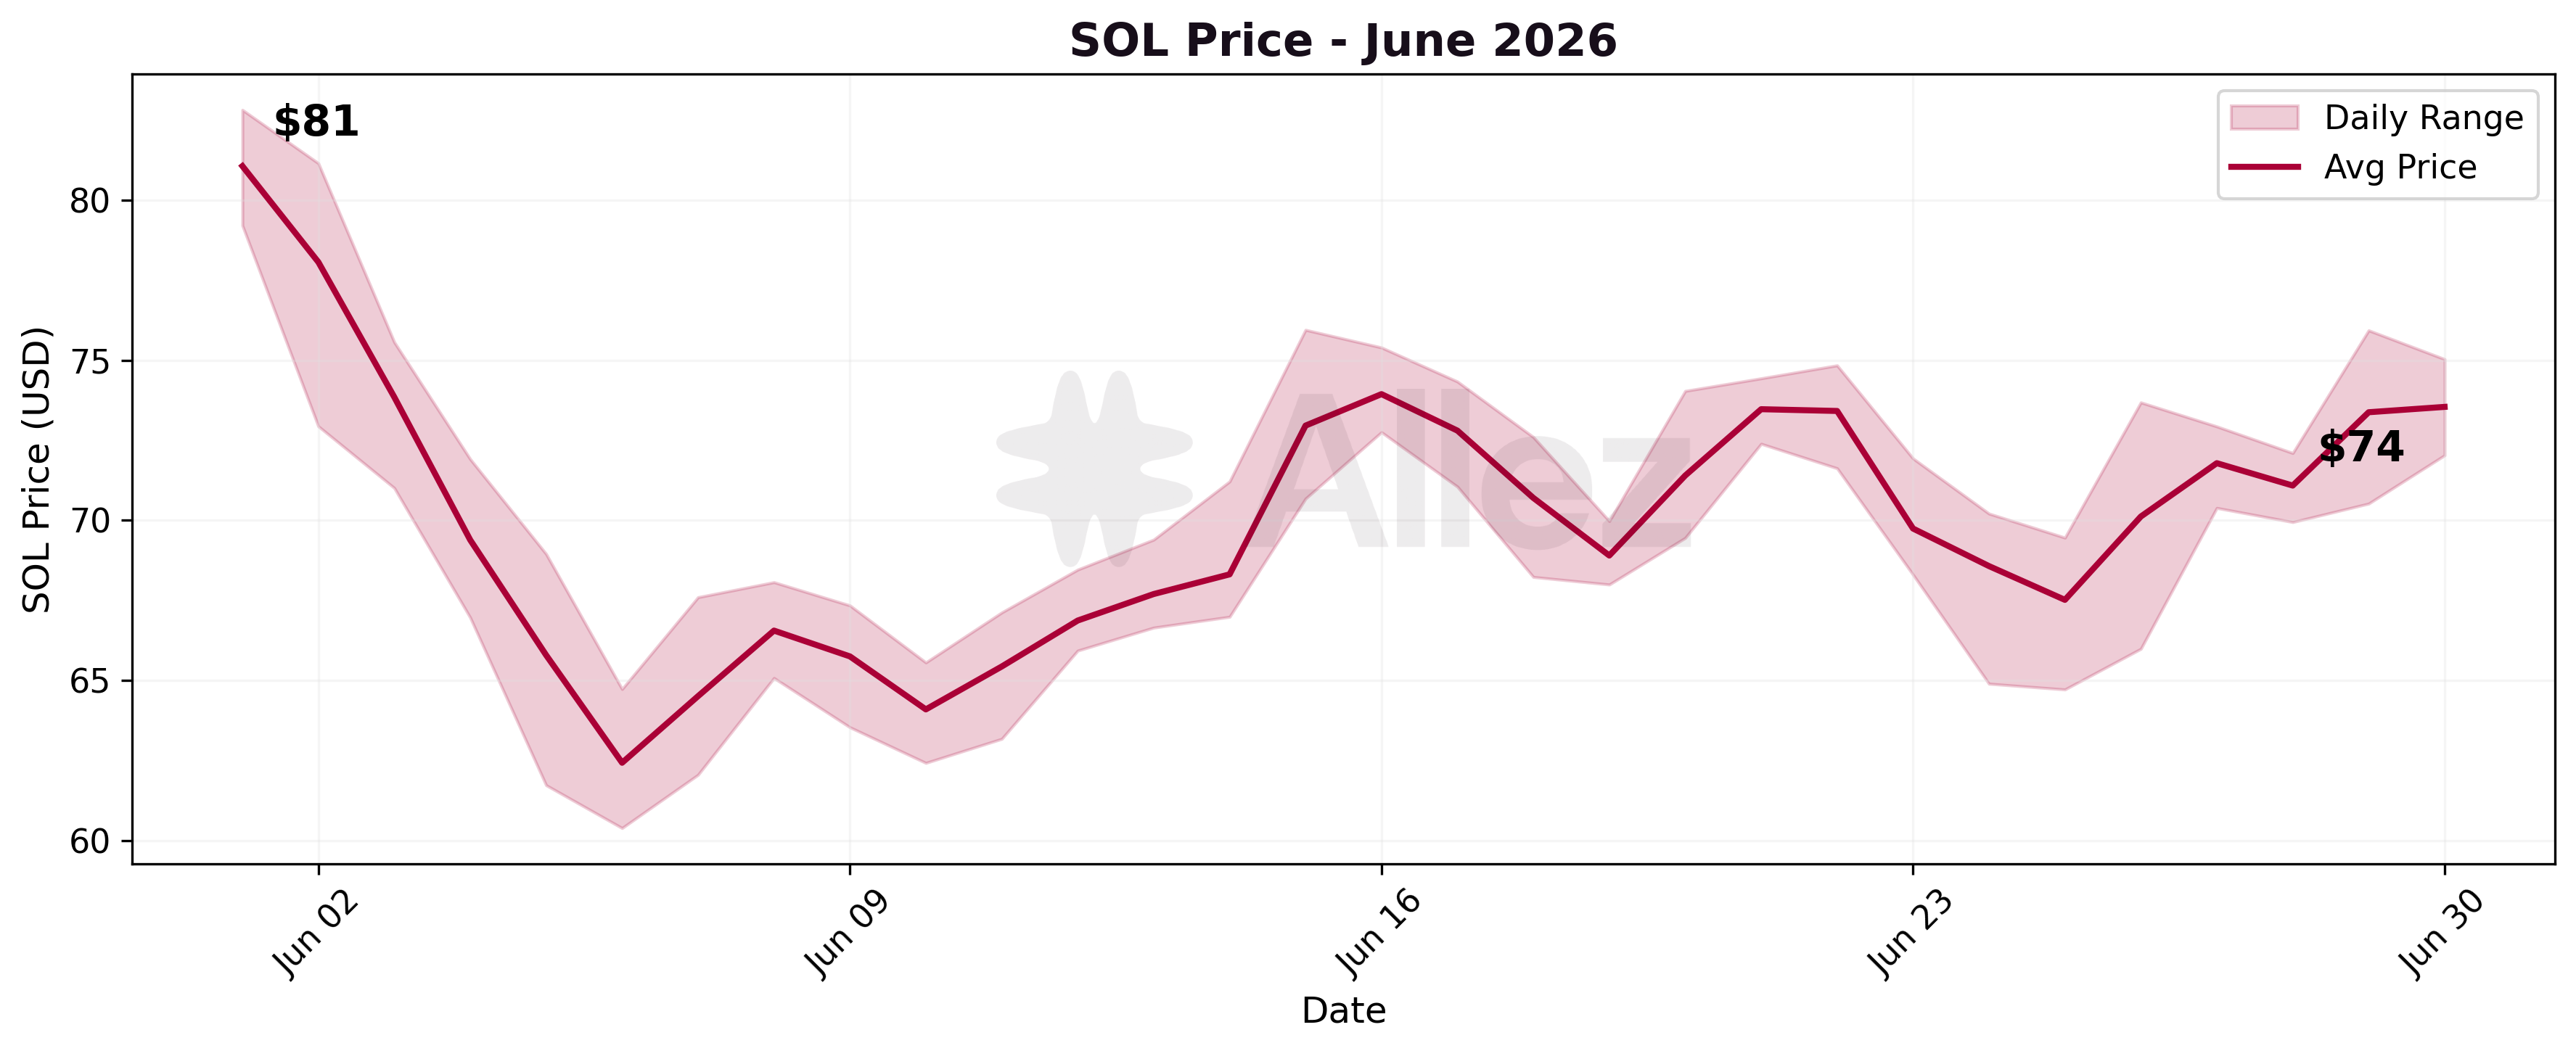
SOL Price: $73.54 (-10.8% MoM)
-
Transaction Volume: $4.82B (+28%)
-
Interest Paid: $4.11M (-23% MoM)
-
Liquidations: 48,905 (+9,860%)
-
Collateral Seized: $5.77M (+1,038%)
-
Avg Liquidation Size: $118 (-89%)
SOL opened the month at $81.06 and closed at $73.54, with intraday prices between $60.40 and $82.81. That is a -9.3% move intra-month and -10.8% against May's $82.45 close. On a daily-average basis SOL bottomed near $62.5 on June 5 (intraday low $60.40), the same day the liquidation cascade peaked.
Transaction volume of $4.82B rose +28% from May's $3.75B, even as balances fell. The increase is on the deleveraging side of the book, with withdrawals exceeding deposits and repayments exceeding new borrowing, detailed in Section 6.
Interest paid of $4.11M is -23% below May's $5.36M, consistent with lower average daily debt as the book deleveraged.
Kamino Ecosystem Updates:
-
Debt Swaps launched (June 22). Borrow positions, including multi-debt markets and Kamino Multiply, can now migrate between debt assets in a single atomic transaction using flash loans, without manual unwinding (Kamino, June 22). It gives borrowers a lower-friction path to migrate between debt assets, relevant to the USDG-to-PYUSD shift underway this month, though it postdates most of that flow.
-
Ethena market moved from USDG to PYUSD borrowing (June 2). Kamino updated the USDG borrow-rate curve (kink at 95% utilization, 2.5% target and 5.25% maximum), enabled PYUSD borrowing against USDe, blocked new USDG borrows, and encouraged existing positions to swap into PYUSD (Kamino, June 2). This followed the late-May USDG borrow-rate increase aimed at easing elevated USDG utilization (Kamino, May 29). The change drove the month's largest asset-level flows, covered in Section 2 and Section 4.
-
OnRe market ONyc LTV raised to 66% (June 17). ONyc loan-to-value increased from 60% to 66%, enabling up to 2.9x leverage on ONyc looping, and PT-ONyc went live at roughly 12% fixed yield maturing September 10 (Kamino, June 17).
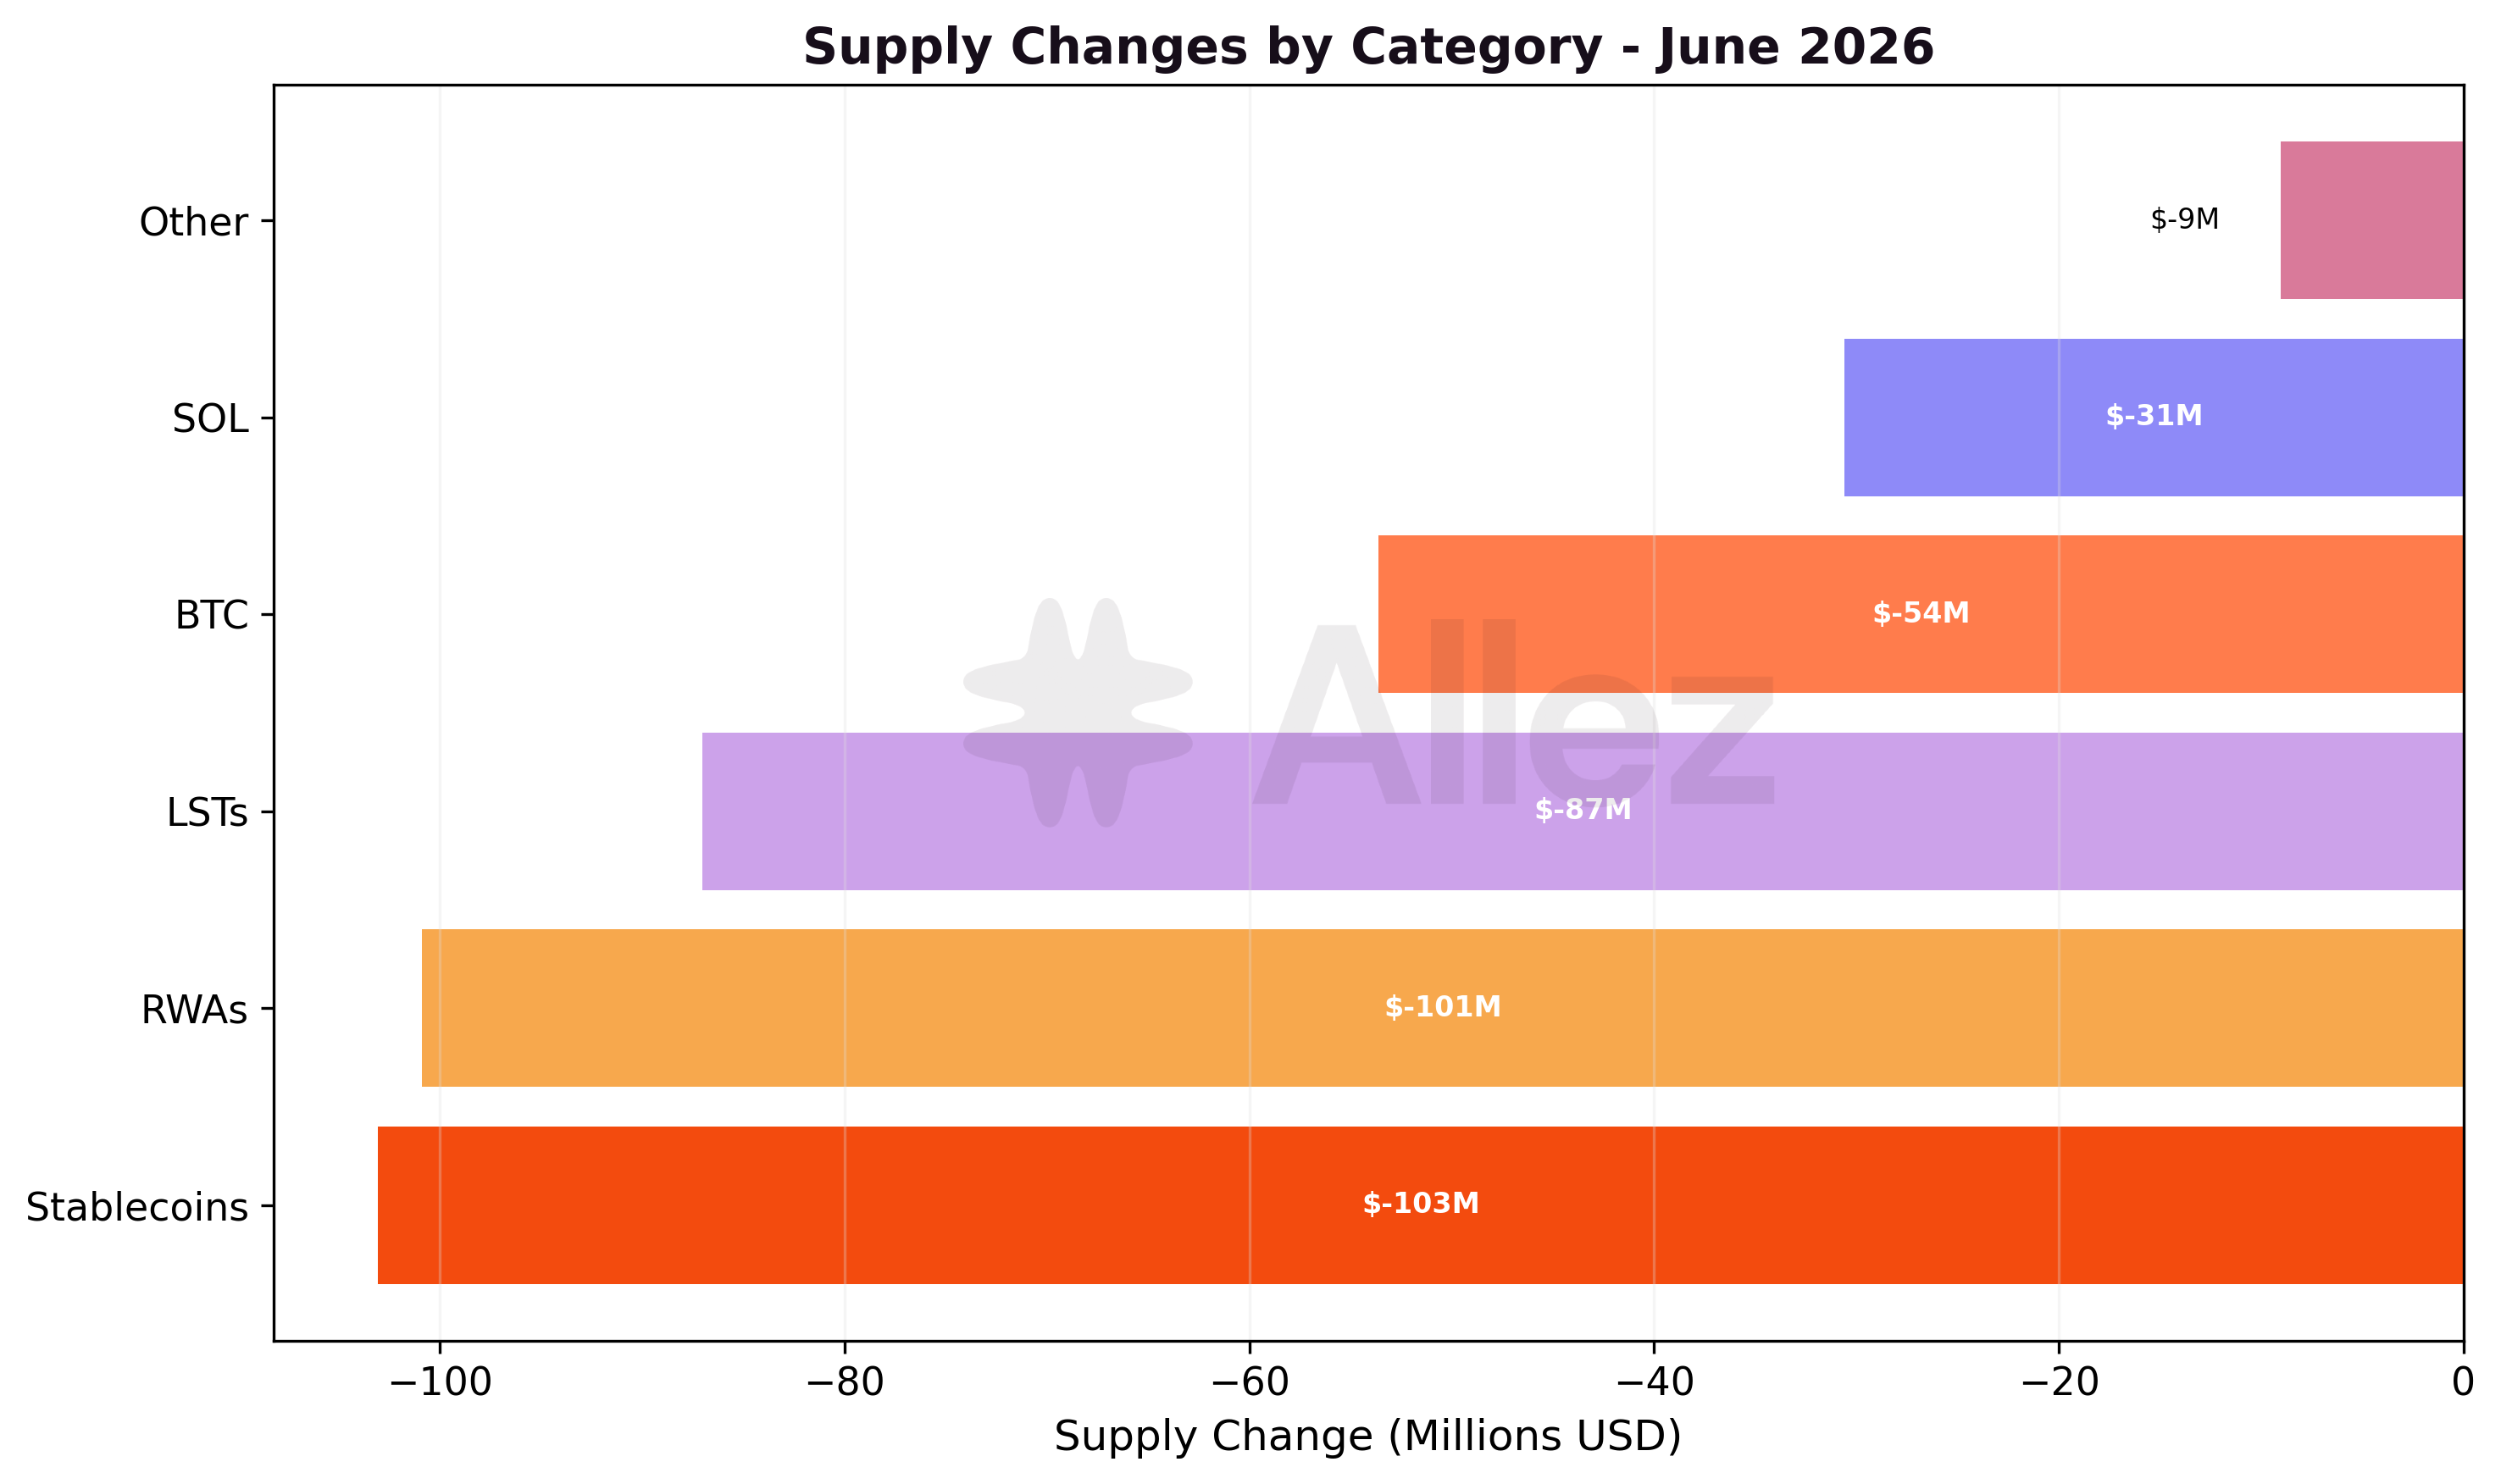
2. Macro View: Liquidity by Category
| Category | Supply | Share | Supply MoM | Debt | Debt MoM |
|---|---|---|---|---|---|
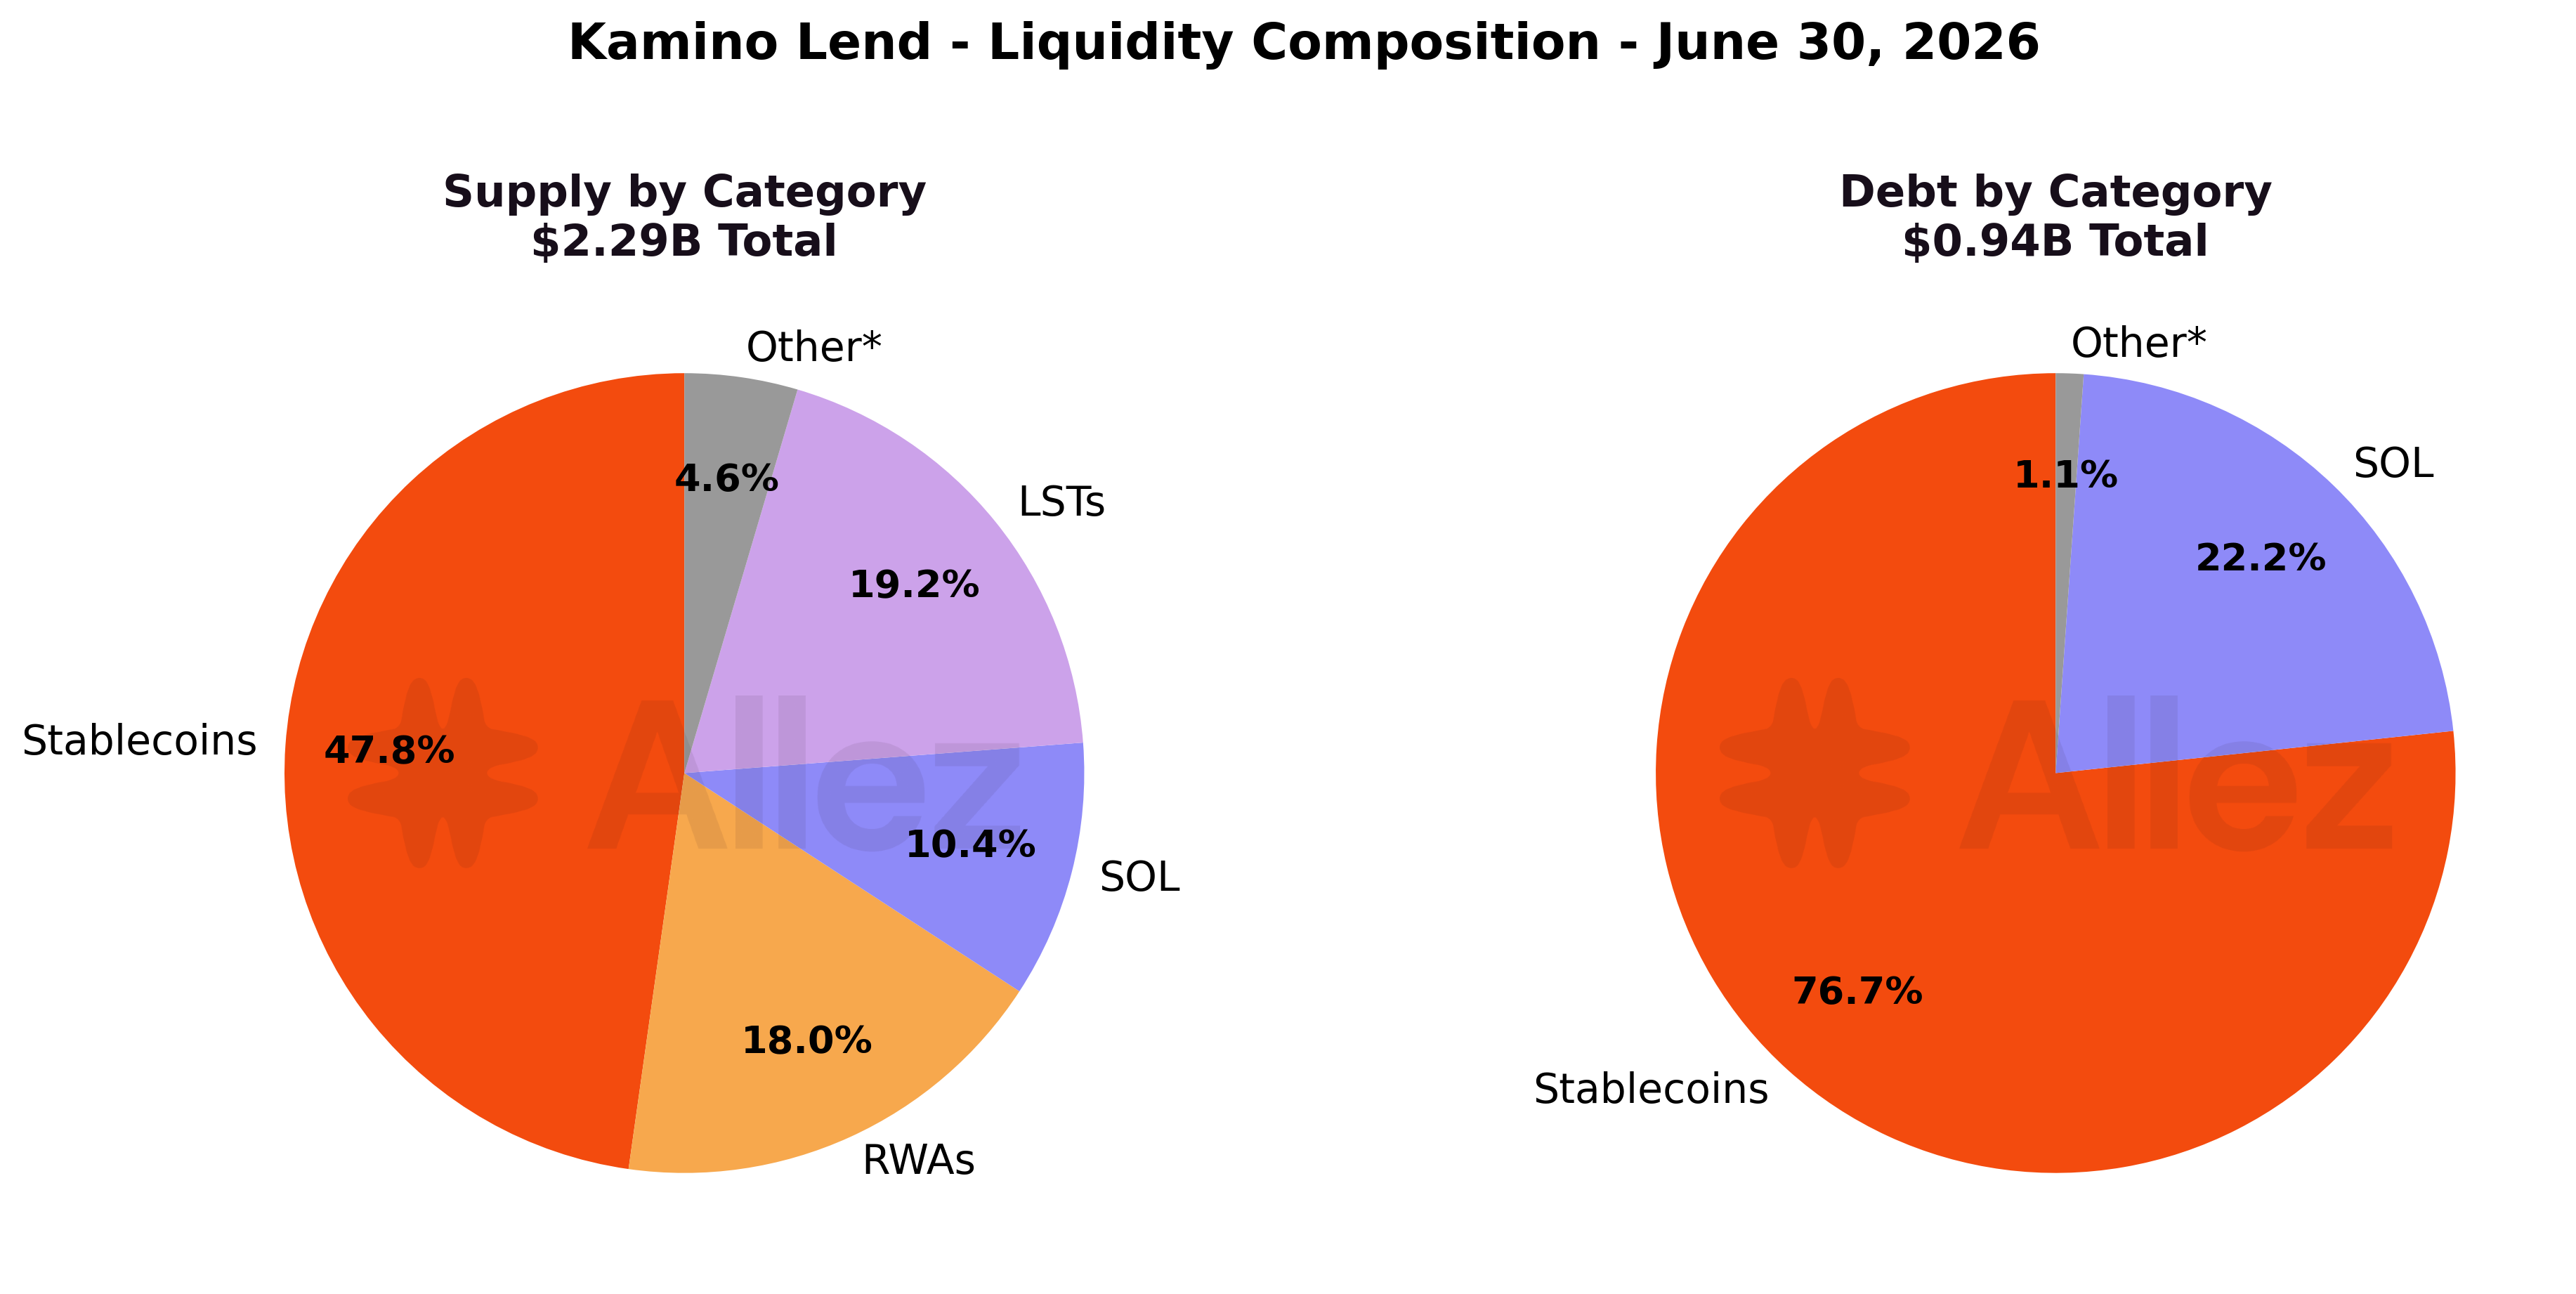
| Stablecoins | $1,095.4M | 47.8% | -8.6% | $720.5M | -14.8% |
| LSTs | $440.7M | 19.2% | -16.5% | $2.28M | +10.5% |
| RWAs | $413.7M | 18.0% | -19.6% | $0.37M | -11.5% |
| SOL | $238.5M | 10.4% | -11.4% | $208.6M | -10.1% |
| BTC | $57.7M | 2.5% | -48.2% | $6.08M | +87.7% |
| Other | $47.1M | 2.1% | -16.0% | $1.76M | +0.2% |
Every category contracted on the supply side. Stablecoins held the largest share at 47.8%, ahead of LSTs at 19.2%, but fell -8.6%, and the two largest non-stablecoin books, liquid staking tokens (-16.5%) and tokenized real-world assets (-19.6%), fell further. BTC's -48.2% is the largest category move, ahead of RWAs, taking wrapped Bitcoin supply down to $57.7M from a much larger May base.
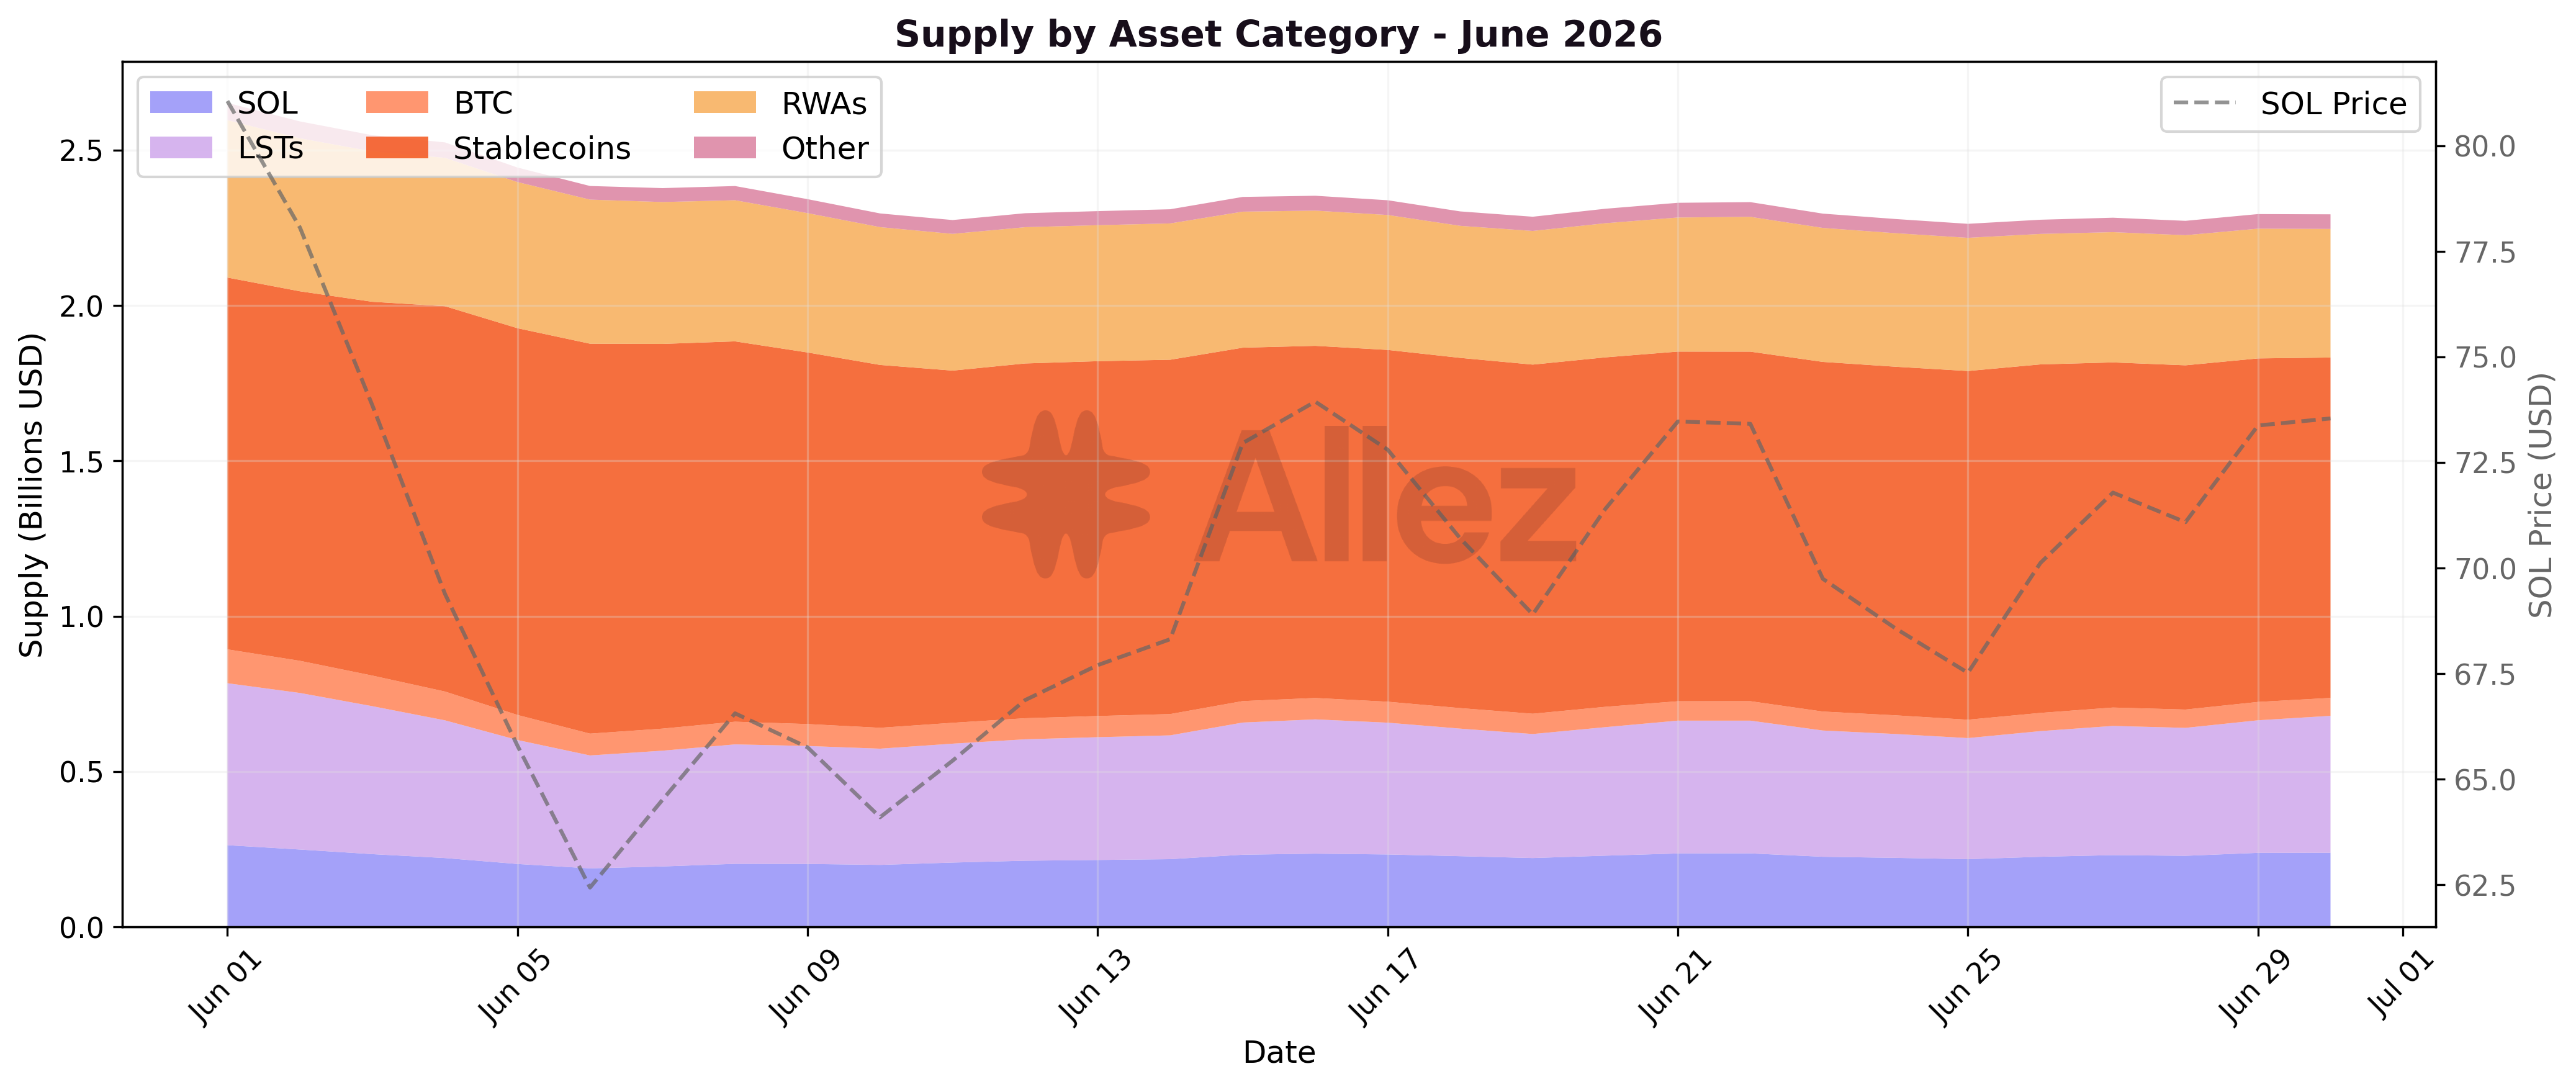
The daily series shows a steady drift lower across all categories rather than a single step-down, with the sharpest movement in the SOL and LST categories during the June 3 to 6 window as the price fell.
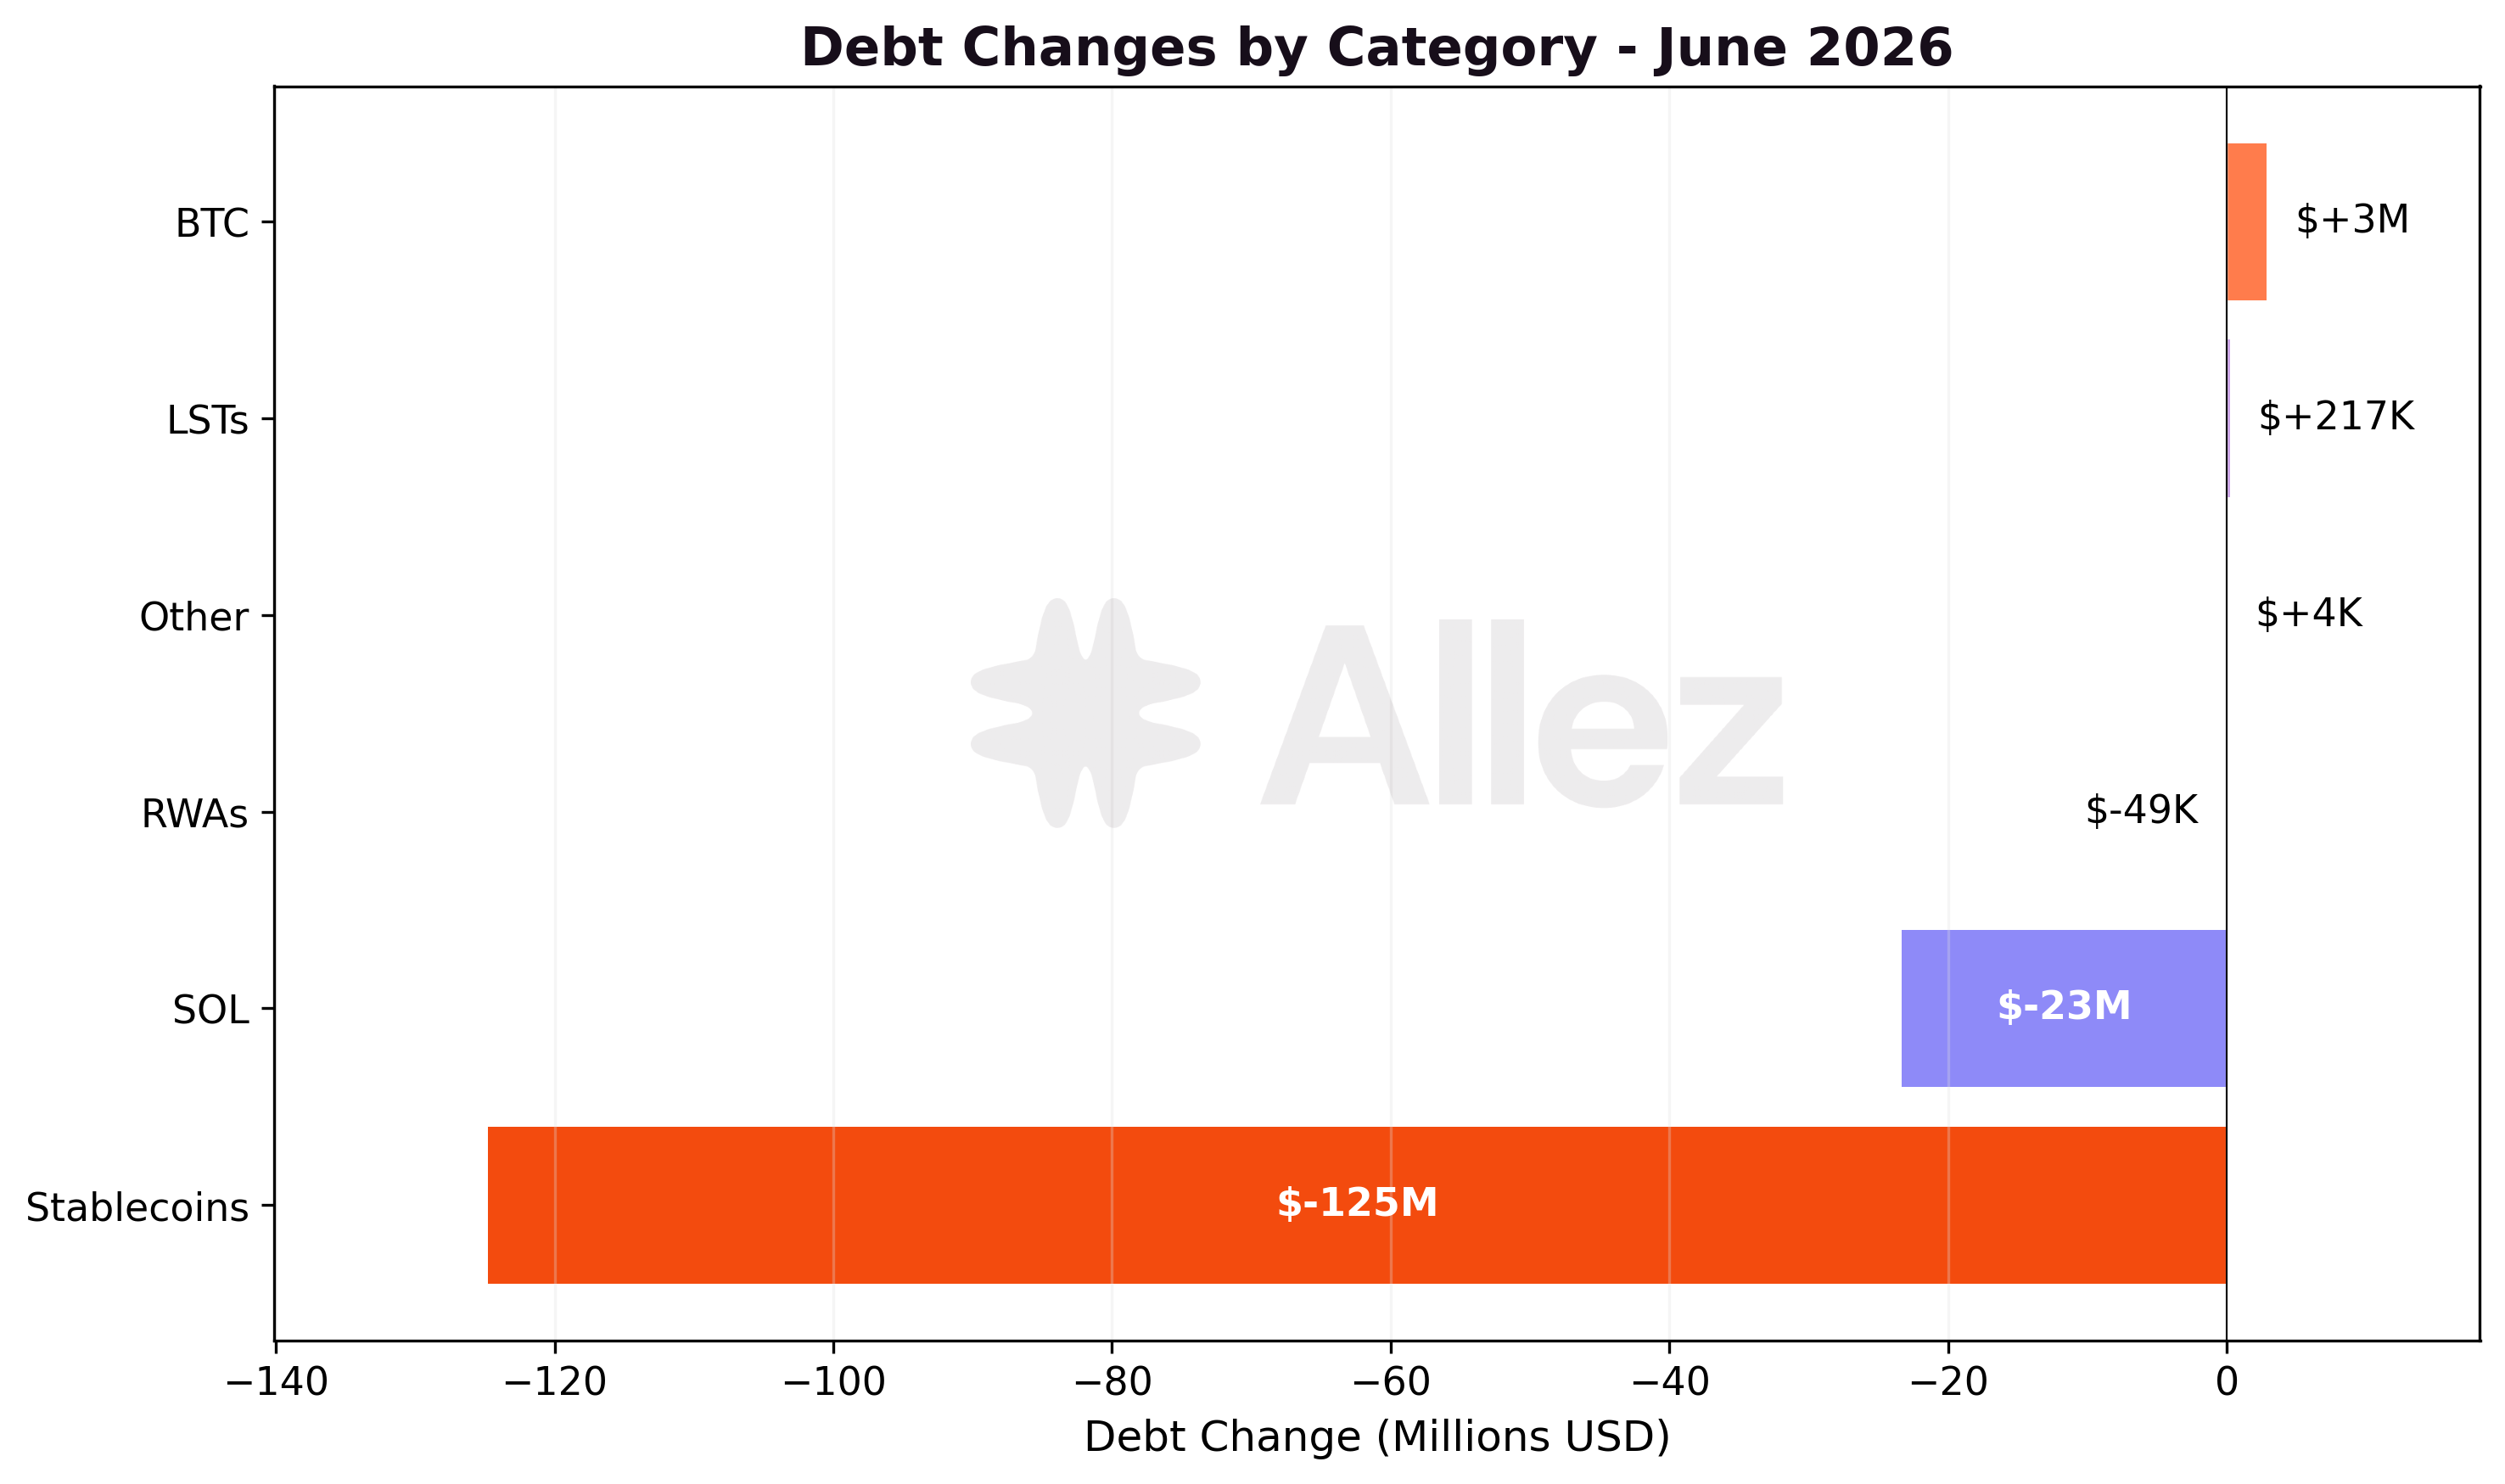
On the debt side, stablecoin borrowing fell -14.8% to $720.5M and SOL-denominated debt fell -10.1% to $208.6M as SOL longs reduced leverage into the drawdown. BTC debt rose +87.7%, but off a small base ($6.08M). LST debt (+10.5% to $2.28M) is similarly small.
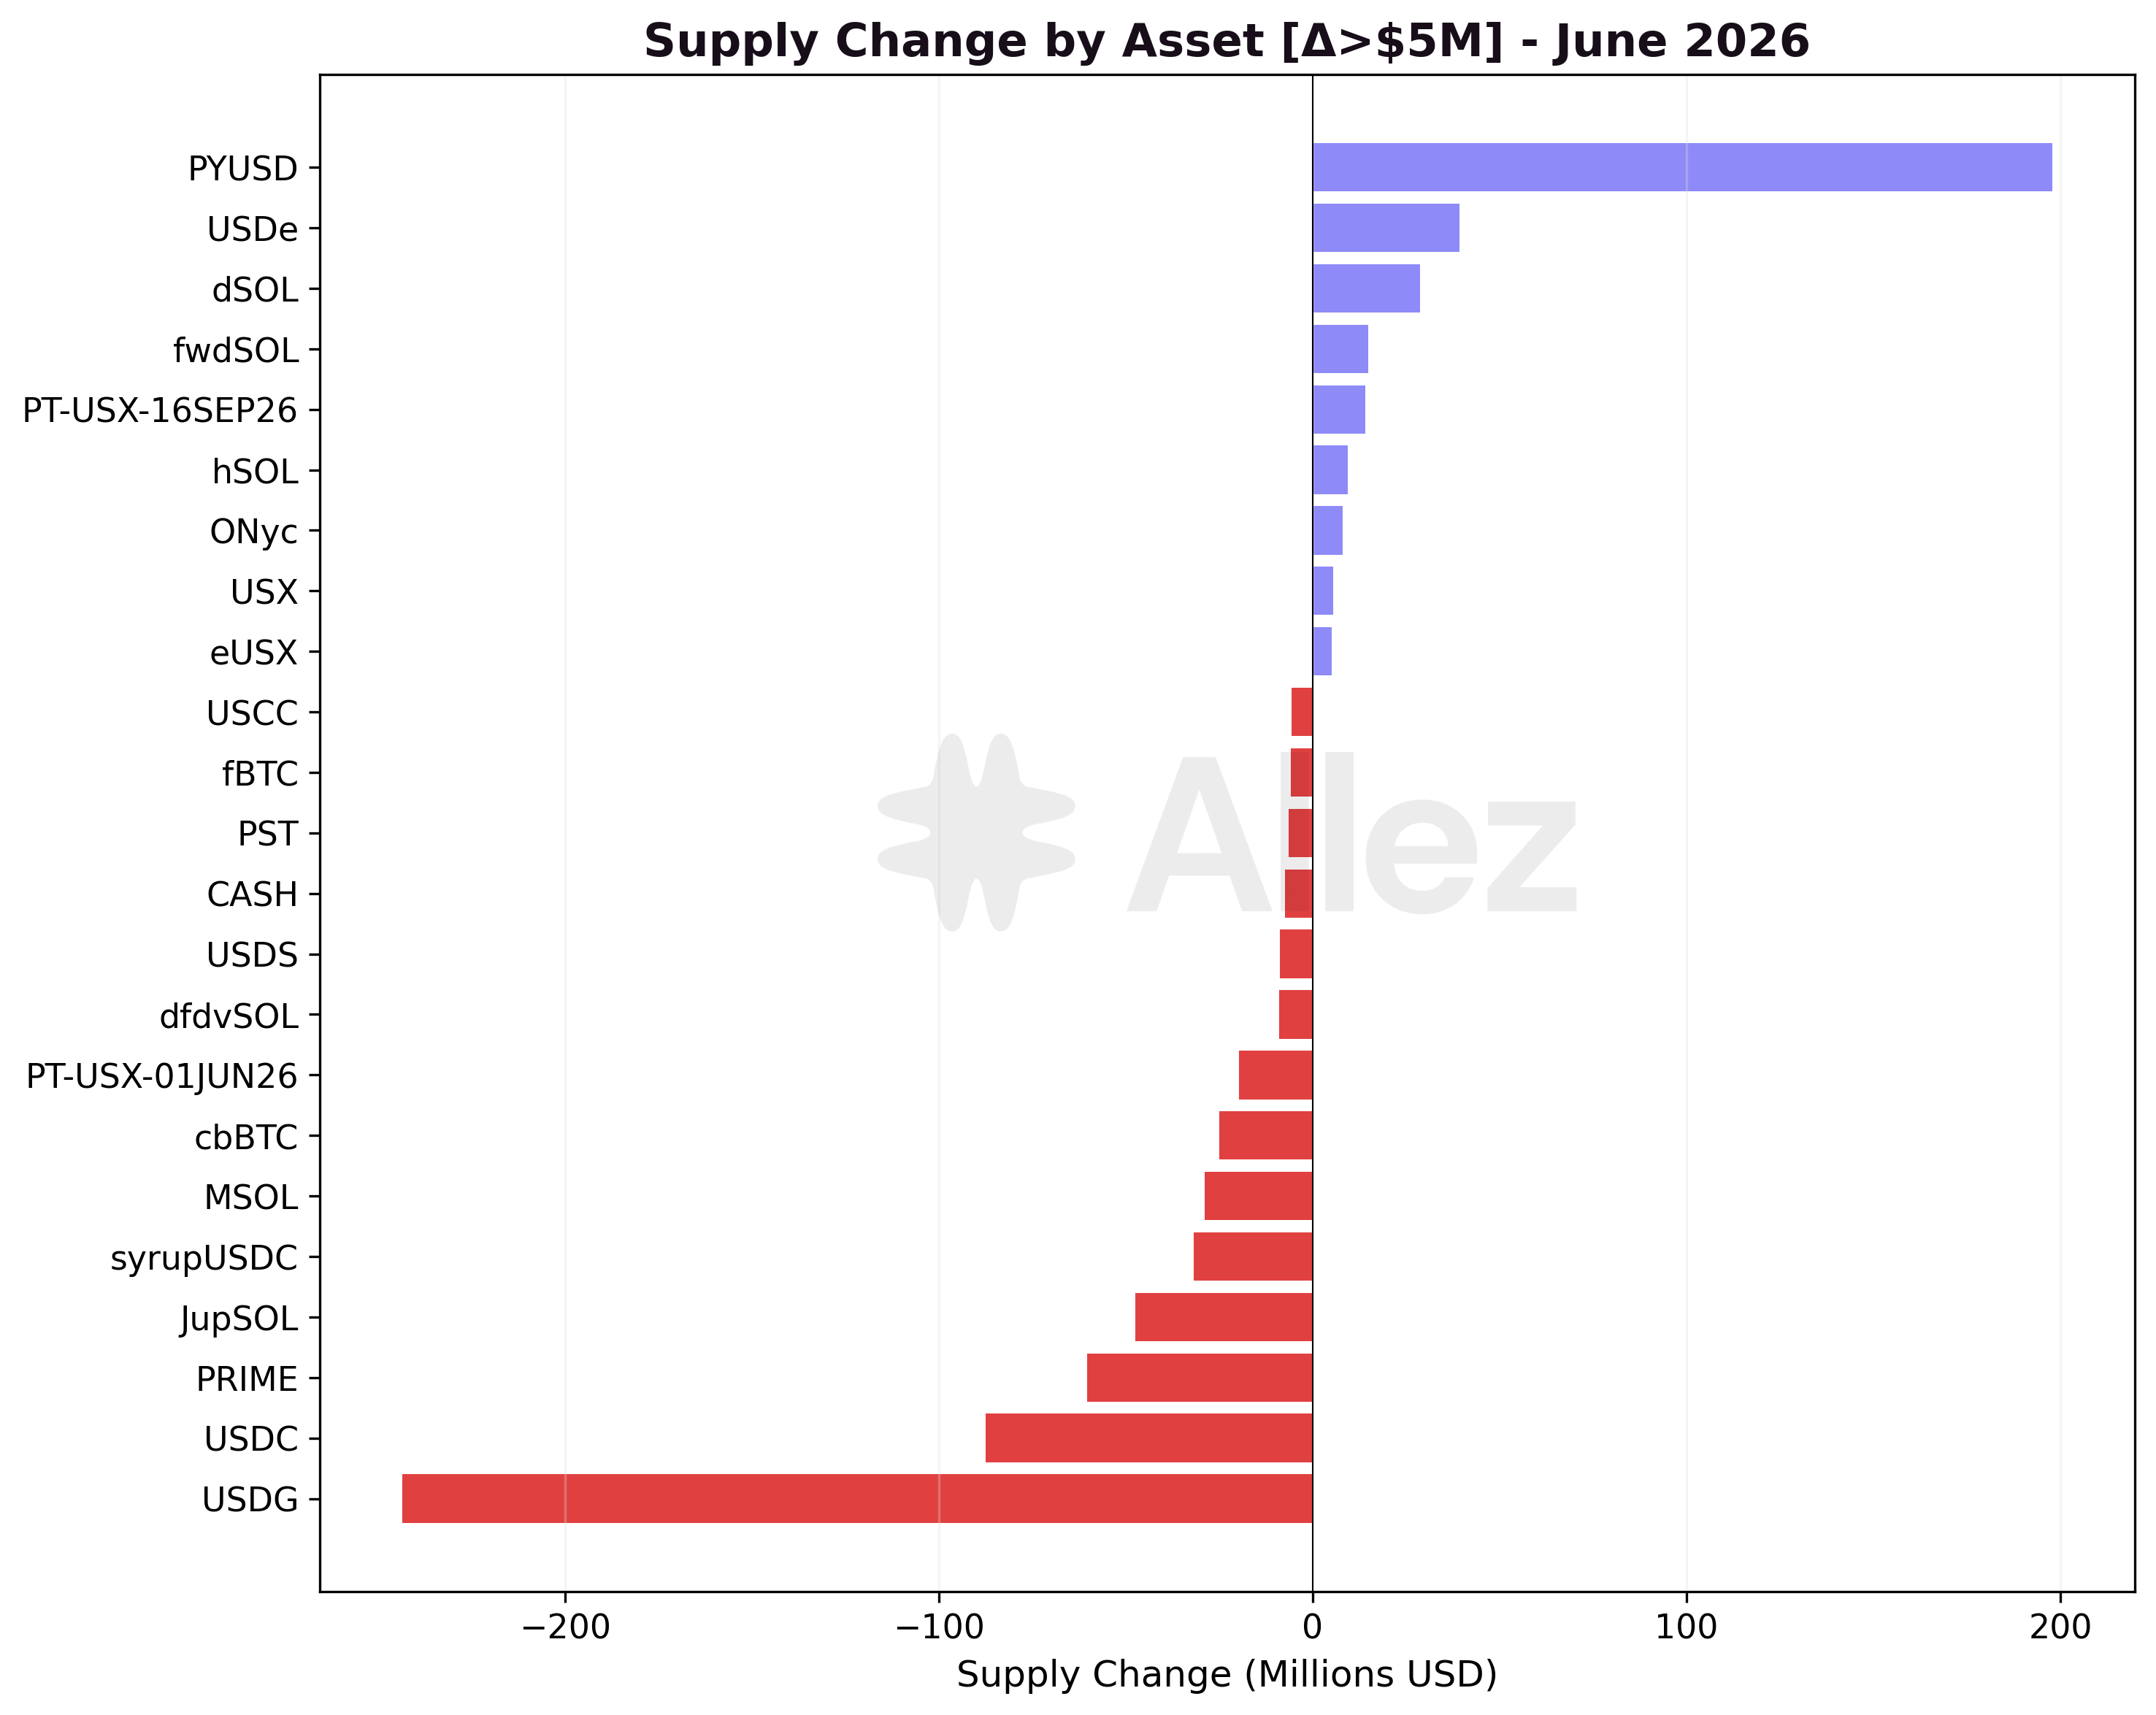
Note: Per-asset figures reflect token quantity changes valued at month-end prices, isolating user deposit and withdrawal behavior.
Major Inflows: PYUSD +$197.8M, USDe +$39.2M, dSOL +$28.8M, fwdSOL +$14.9M, PT-USX-16SEP26 +$14.2M, hSOL +$9.3M.
Major Outflows: USDG -$243.4M, USDC -$87.4M, PRIME -$60.3M, JupSOL -$47.5M, syrupUSDC -$31.9M, mSOL -$28.8M.
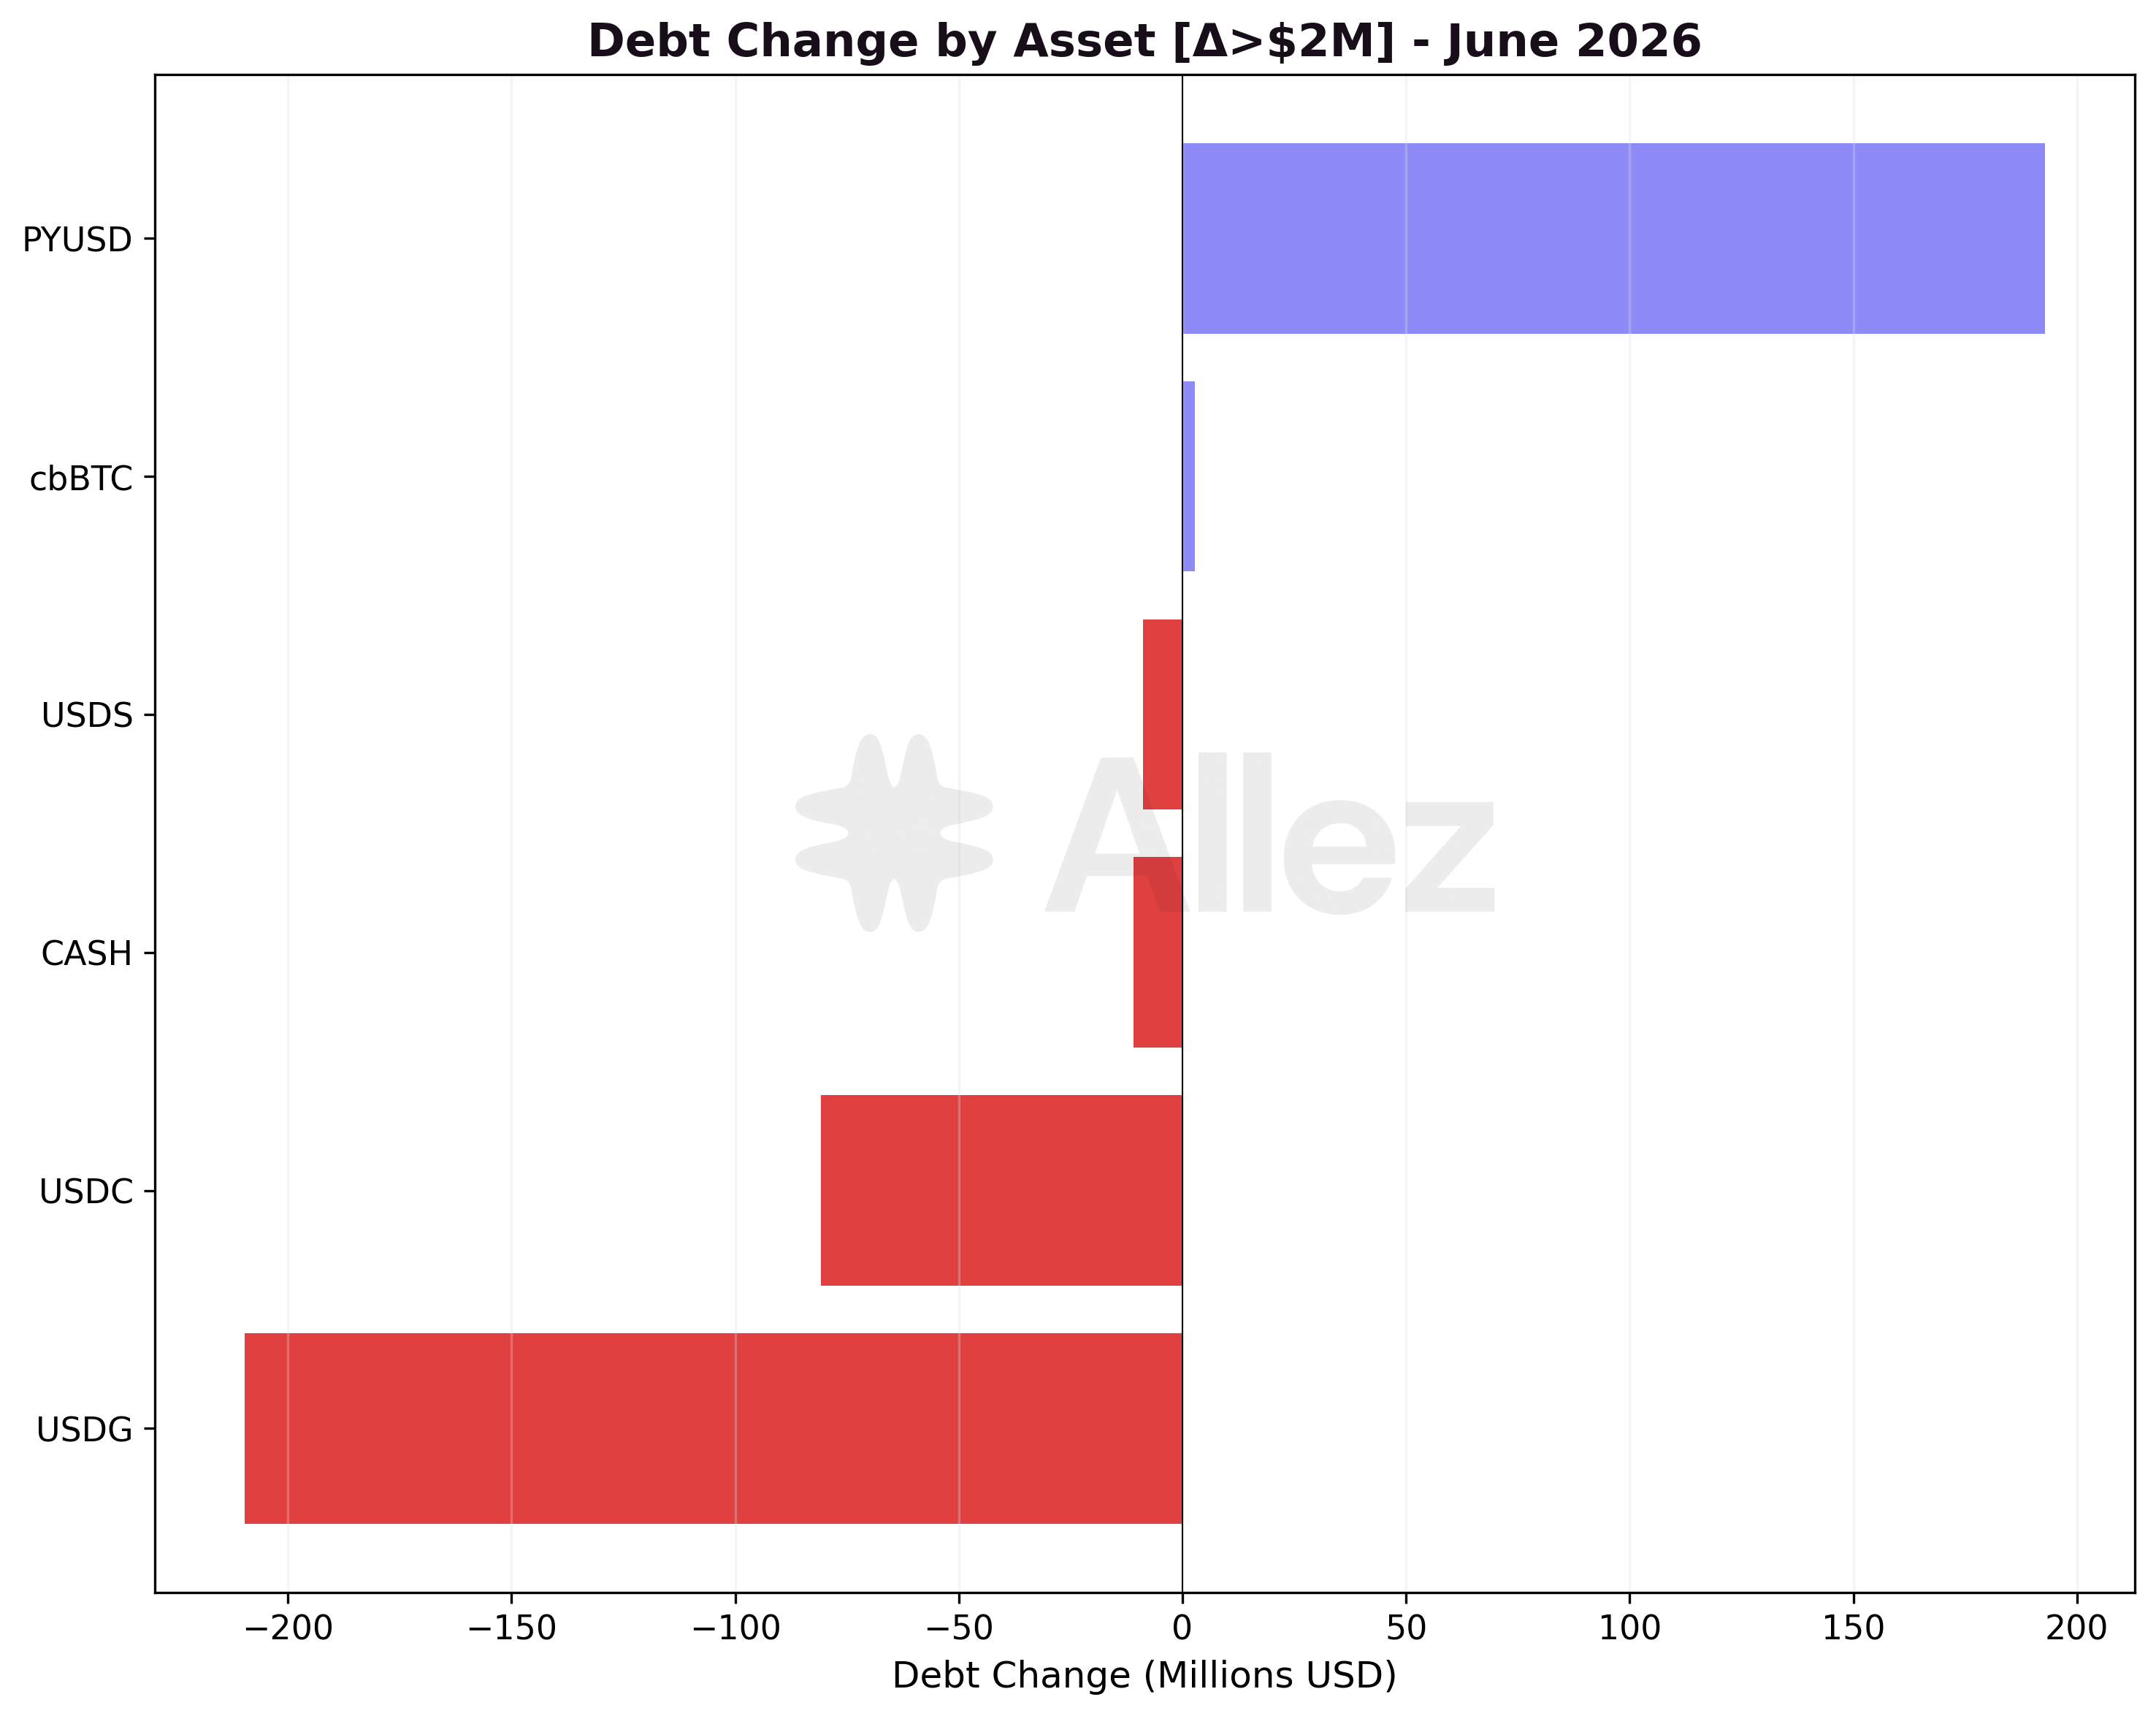
The two largest moves are two sides of one event. PYUSD supply rose +$197.8M while USDG supply fell -$243.4M, a near-mirror swing. The debt side matches: PYUSD borrowing rose +$192.8M while USDG borrowing fell -$209.7M. The flows trace the Ethena market switching its borrowed stablecoin from USDG to PYUSD, announced June 2 (see the ecosystem notes in Section 1). Section 4 covers the market-level effect and Section 5 the same shift at the vault layer.
The remaining outflows reflect the broad deleveraging: USDC -$87.4M, PRIME -$60.3M driving the RWA contraction, JupSOL -$47.5M and mSOL -$28.8M on the LST side, and syrupUSDC -$31.9M.
The stablecoin outflows did not free up borrowing capacity where the leverage sits. Aggregate stablecoin utilization eased to 65.8% from 70.5% as borrowing fell faster than supply, but the share of stablecoin supply in reserves running above 90% utilization rose to 40% from 31%, and the main looping reserves ended June near their caps (Prime USDC 95.3%, OnRe USDC 94.9%, Ethena PYUSD 93.0%, JLP USDC 92.3%). Borrowers looking to add leverage in those markets have limited headroom even as the book deleveraged overall.
3. Risk & Liquidations
Distance to Liquidation: Correlated vs Uncorrelated Positions
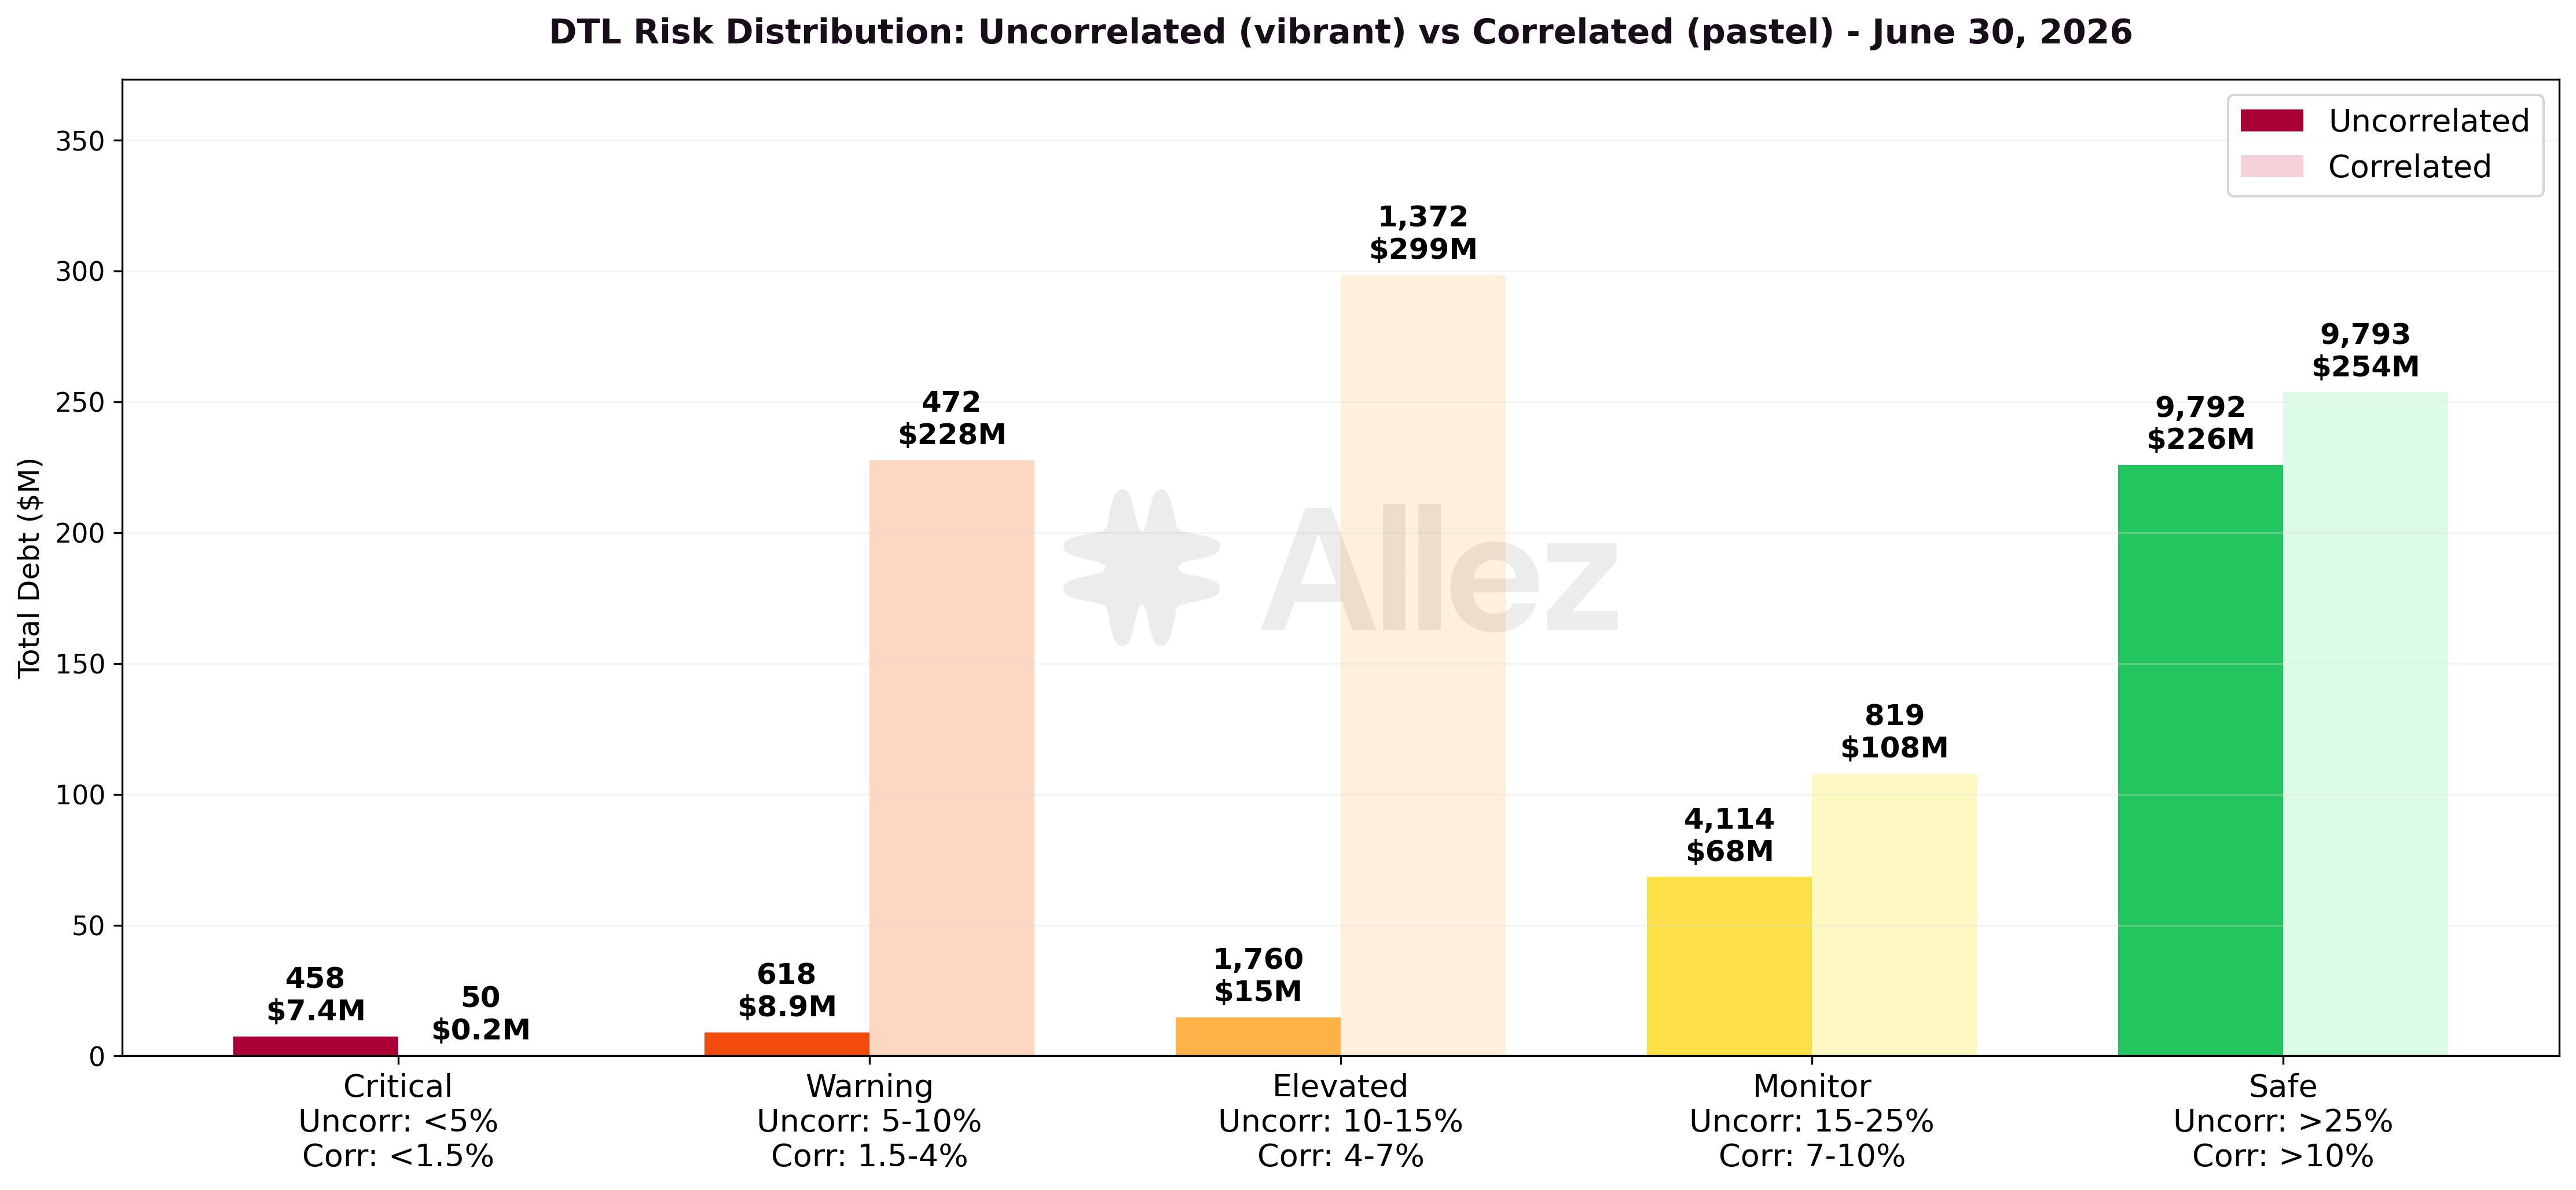
Each position is counted once per collateral-debt leg, so a position with several collateral or debt assets appears in more than one tier.
Uncorrelated positions (volatile collateral against stablecoin debt: SOL/USDC, BTC/USDC, JLP/USDC):
| Risk Tier | DTL Range | Volume | May Volume | MoM | Positions |
|---|---|---|---|---|---|
| Critical | <5% | $7.45M | $8.6M | -13% | 458 |
| Warning | 5-10% | $8.89M | $8.3M | +7% | 618 |
| Elevated | 10-15% | $14.78M | $131.6M | -89% | 1,760 |
| Monitor | 15-25% | $68.4M | $138.7M | -51% | 4,114 |
| Safe | >25% | $225.9M | $219.7M | +3% | 9,792 |
Correlated positions (collateral and debt move together: LST/SOL, RWA/stablecoin, stablecoin/stablecoin):
| Risk Tier | DTL Range | Volume | May Volume | MoM | Positions |
|---|---|---|---|---|---|
| Critical | <1.5% | $0.19M | $0.3M | -37% | 50 |
| Warning | 1.5-4% | $227.7M | $233.9M | -3% | 472 |
| Elevated | 4-7% | $298.6M | $286.2M | +4% | 1,372 |
| Monitor | 7-10% | $107.9M | $135.0M | -20% | 819 |
| Safe | >10% | $253.7M | $264.1M | -4% | 9,793 |
The uncorrelated book (about $325M) sits mostly in the Monitor and Safe tiers, with $225M further than 25% from liquidation. Critical-tier uncorrelated exposure is $7.45M across 458 positions, small relative to the book and distributed across many individual SOL and BTC longs rather than concentrated. The correlated book (about $888M) is dominated by the Warning and Elevated tiers, where the Ethena leverage positions cluster by construction: their collateral and debt are both dollar-pegged, so the tier distance reflects the leverage cap rather than live market proximity.
Liquidation summary:
| Metric | June | May | MoM |
|---|---|---|---|
| Events | 48,905 | 491 | +9,860% |
| Collateral seized | $5.77M | $0.51M | +1,038% |
| Avg liquidation size | $118 | $1,033 | -89% |
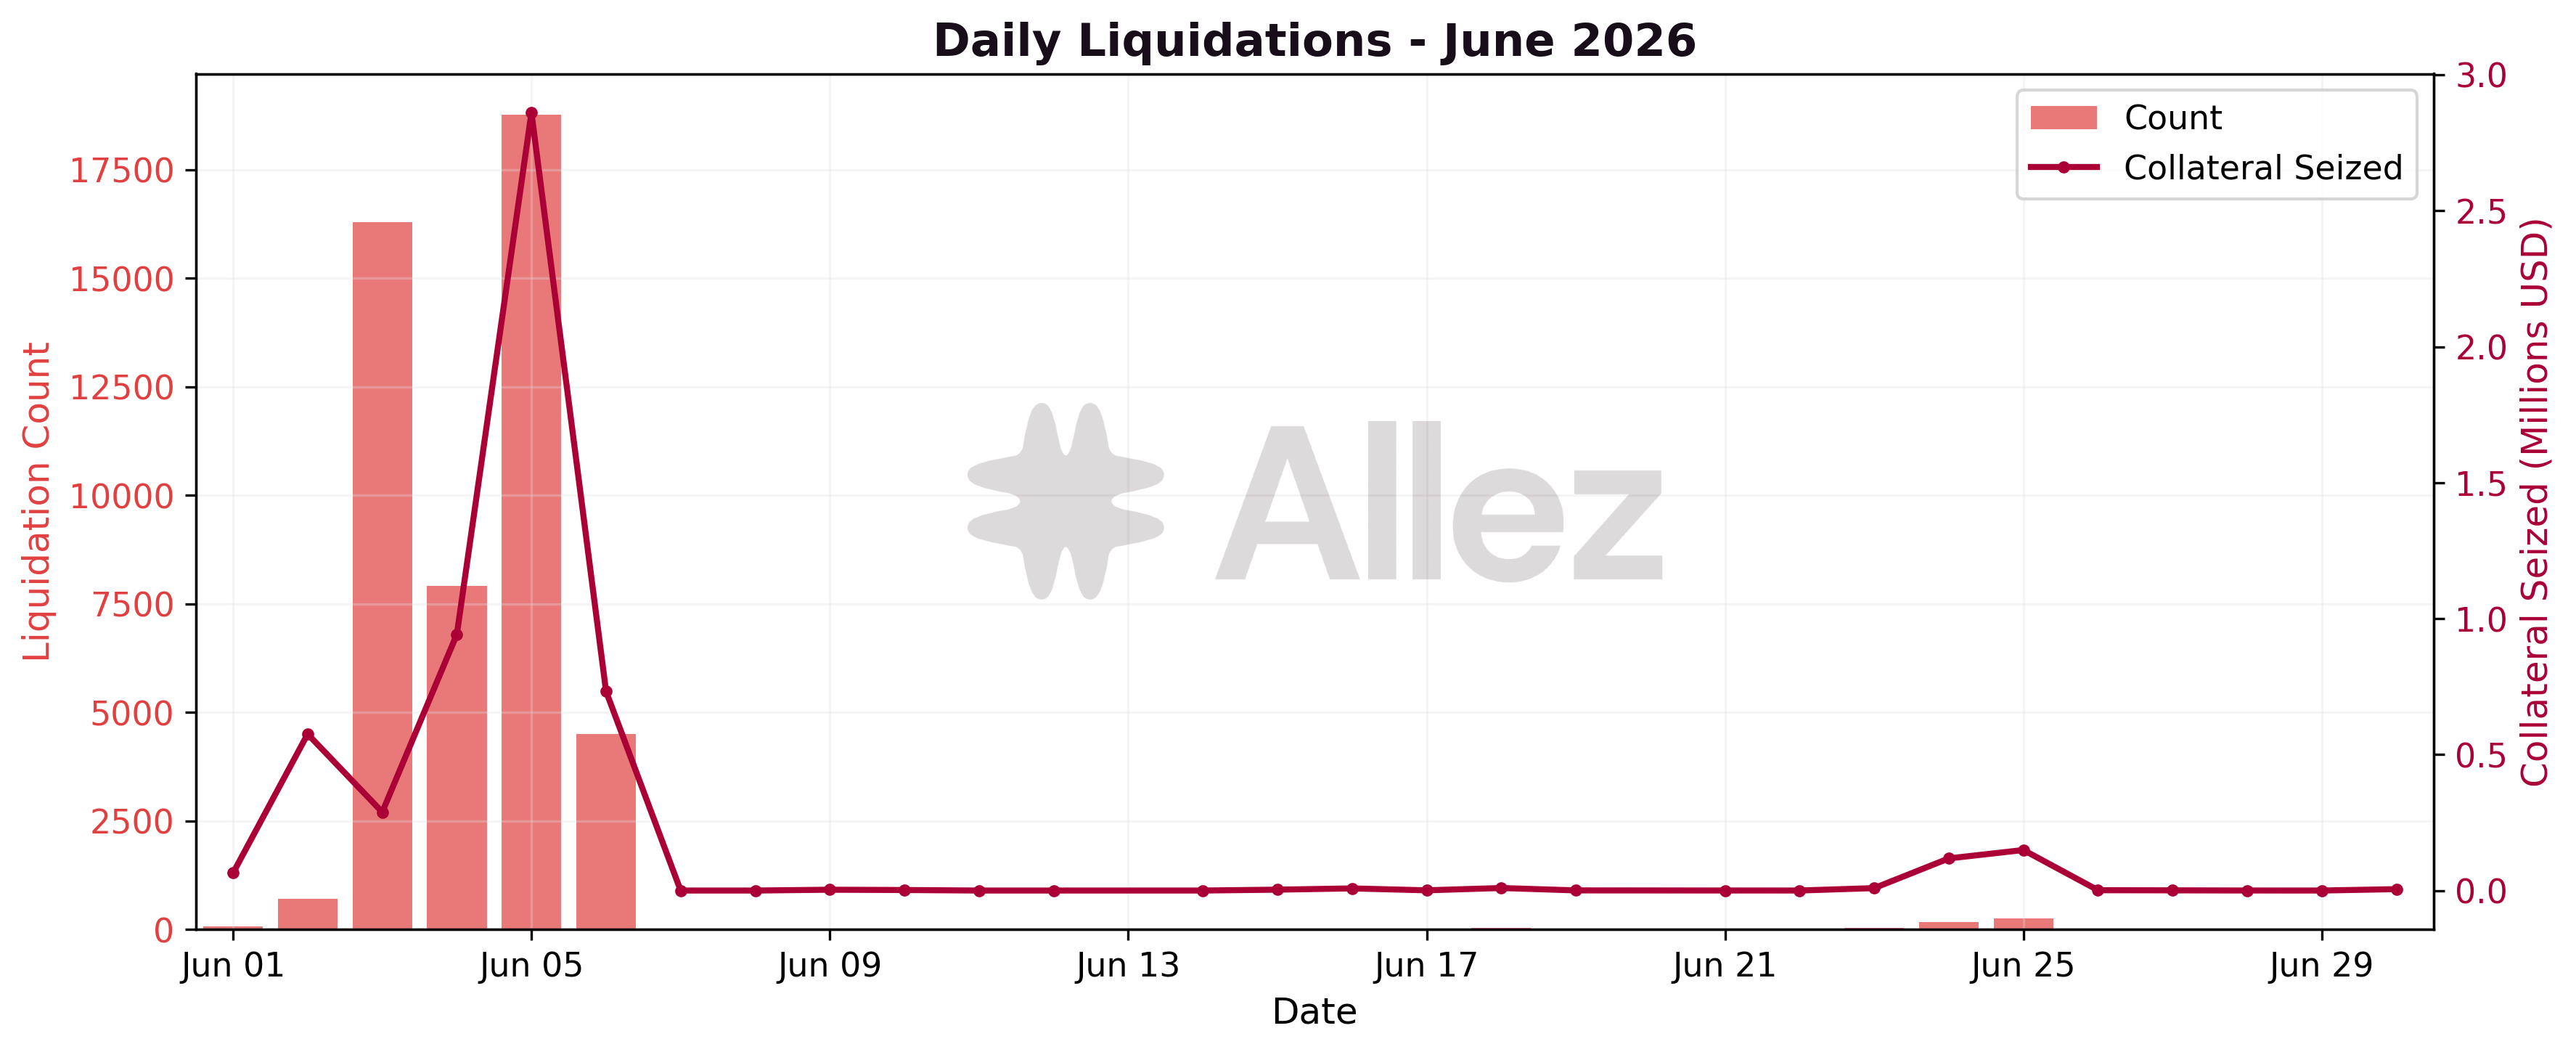
The June headline is overwhelmingly a June 3 to 6 cascade tied to the SOL drawdown, 47,478 of the month's 48,905 events. Daily activity was $64K on June 1 and $575K on June 2, then rose to a peak of $2.86M on June 5 as SOL hit its trough, before falling back to routine levels by June 7. The average event size of $118 is 89% below May's $1,033, consistent with many small partial liquidations rather than fewer large ones.
The cascade produced 47,478 events across 8,782 unique obligations, a ratio of 5.41 events per obligation, against about 1.7 to 2.0 in quieter periods (1.69 in May, 2.0 across the rest of June). This is the same mechanism seen in a normal month rather than a different one: liquidators split each position into many small partial fills instead of closing it at once, a routine Kamino pattern that the drawdown amplified. The distinguishing feature is scale, not method, with the average event falling to about $102 from $1,033 in May. Over the window liquidators seized $4.82M of collateral against $4.77M of loan repaid.
The liquidations were partial and the liquidator premium was small. Measured per obligation, the median position had about 25% of its collateral seized over the window (aggregate 19% of position value across the cascade), trims rather than full unwinds. The liquidation bonus, the discount captured by liquidators, was small measured against the borrower's whole position: a median of 0.074% of total position size, or 0.997% of the amount actually liquidated (dollar-weighted 1.14%, simple average 1.40%).
The composition was a broad crypto-drawdown cascade of volatile collateral against stablecoin debt, led by SOL and JLP. Classifying every event by its collateral-debt pair:
| Pair class | Events | Collateral seized | Share |
|---|---|---|---|
| SOL-denominated (SOL, LSTs) | 37,340 | $2.46M | 51% |
| Other volatile collateral (chiefly JLP and BTC wrappers) | 9,769 | $2.33M | 48% |
| Stablecoin against stablecoin | 369 | $0.03M | 1% |
The top pairs by collateral seized were JLP/USDC ($1.34M), SOL/USDC ($1.09M), JITOSOL/USDC ($309K), SOL/USDT ($213K) and cbBTC/USDC ($200K). Pure stablecoin-on-stablecoin activity was only 1% of collateral seized. This was a cascade of uncorrelated positions, driven by SOL falling from about $81 to its $62.5 trough on June 5.
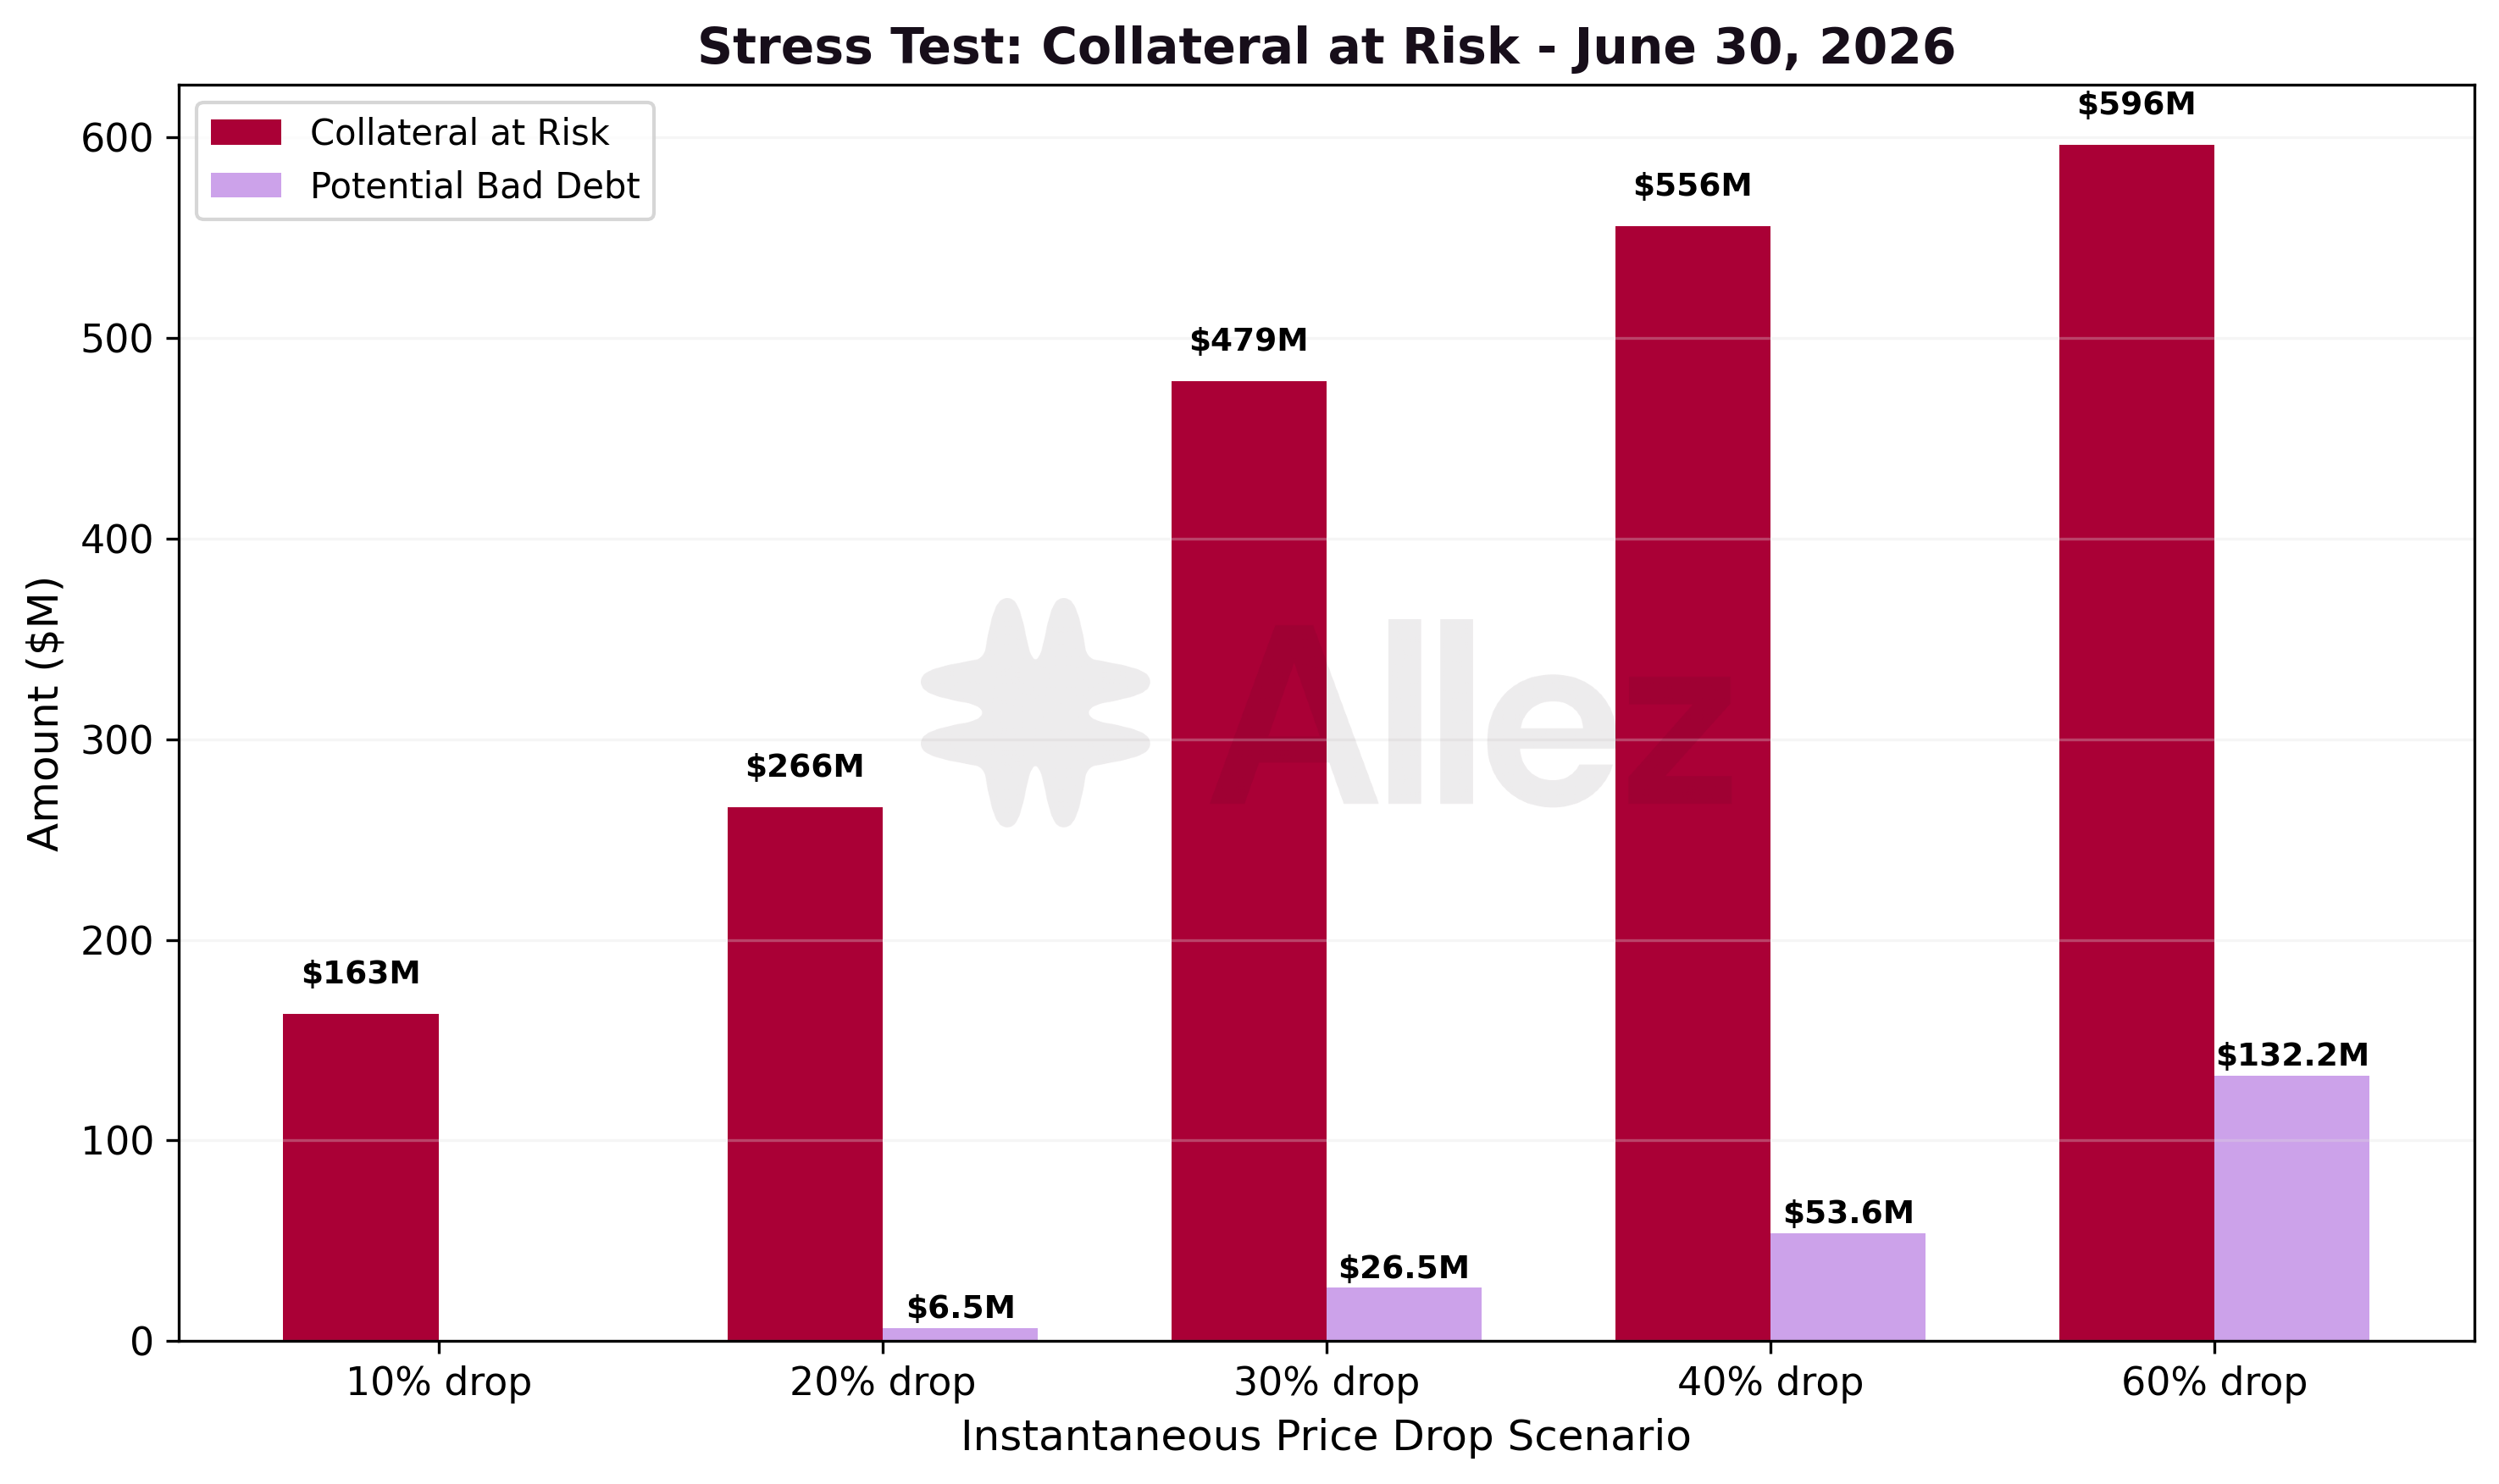
Stress Testing:
| Scenario | Collateral at Risk | Potential Bad Debt | Positions Liquidated | May Collateral | MoM |
|---|---|---|---|---|---|
| 10% drop | $163.2M | $0.0M | 652 | $229.9M | -29% |
| 20% drop | $266.3M | $6.5M | 3,141 | $486.4M | -45% |
| 30% drop | $478.6M | $26.5M | 8,815 | $627.0M | -24% |
| 40% drop | $556.0M | $53.6M | 10,977 | $686.1M | -19% |
| 60% drop | $596.5M | $132.2M | 12,735 | $765.4M | -22% |
Collateral at risk contracted in every scenario month-over-month, in line with the supply contraction and the reduction in SOL and RWA collateral that populates the at-risk pool. The contraction is largest at the shallow scenarios (-29% at -10% and -45% at -20%), where the high-LTV positions closest to their thresholds sit, consistent with those positions exiting as prices fell, and smaller at the deep -60% scenario (-22%), which scales with overall protocol size. Potential bad debt is zero at -10% and only appears at deeper drawdowns, reaching $132.2M at -60%.
Liquidation Cascade and On-Chain Exit Depth (SOL)
This analysis complements the threshold-based stress test above with a position-level partial-liquidation cascade for SOL, the protocol's largest price-sensitive collateral. Where the stress test measures collateral that crosses its liquidation threshold, the cascade measures the sell pressure that actually reaches the market as liquidators seize and sell collateral in partial waves, and compares it against the depth available to exit SOL into dollars on-chain.
The model steps the SOL price down in 0.25% increments and, at each level, liquidates each position in 10% close-factor waves until it returns below its liquidation threshold, carrying residual collateral and debt forward. The Main market holds 93% of the protocol's SOL collateral, and supply-only SOL is excluded because it generates no forced selling. Debt is allocated pro-rata to each position's SOL collateral share, and the 10% wave size matches the Main market's configured close factor (the per-liquidation debt-repay cap) and the 10.1% realized in SOL liquidations over the past year.
We estimate the on-chain depth available to exit SOL into dollars across trade sizes. Selling SOL into USDC absorbs $10.6M at 2% price impact and $31.5M at 5%, with realizable output flattening near a $34M ceiling beyond which price impact escalates sharply. These figures reflect current early-July on-chain state, read live, rather than a June 30 snapshot, and are a point-in-time estimate.
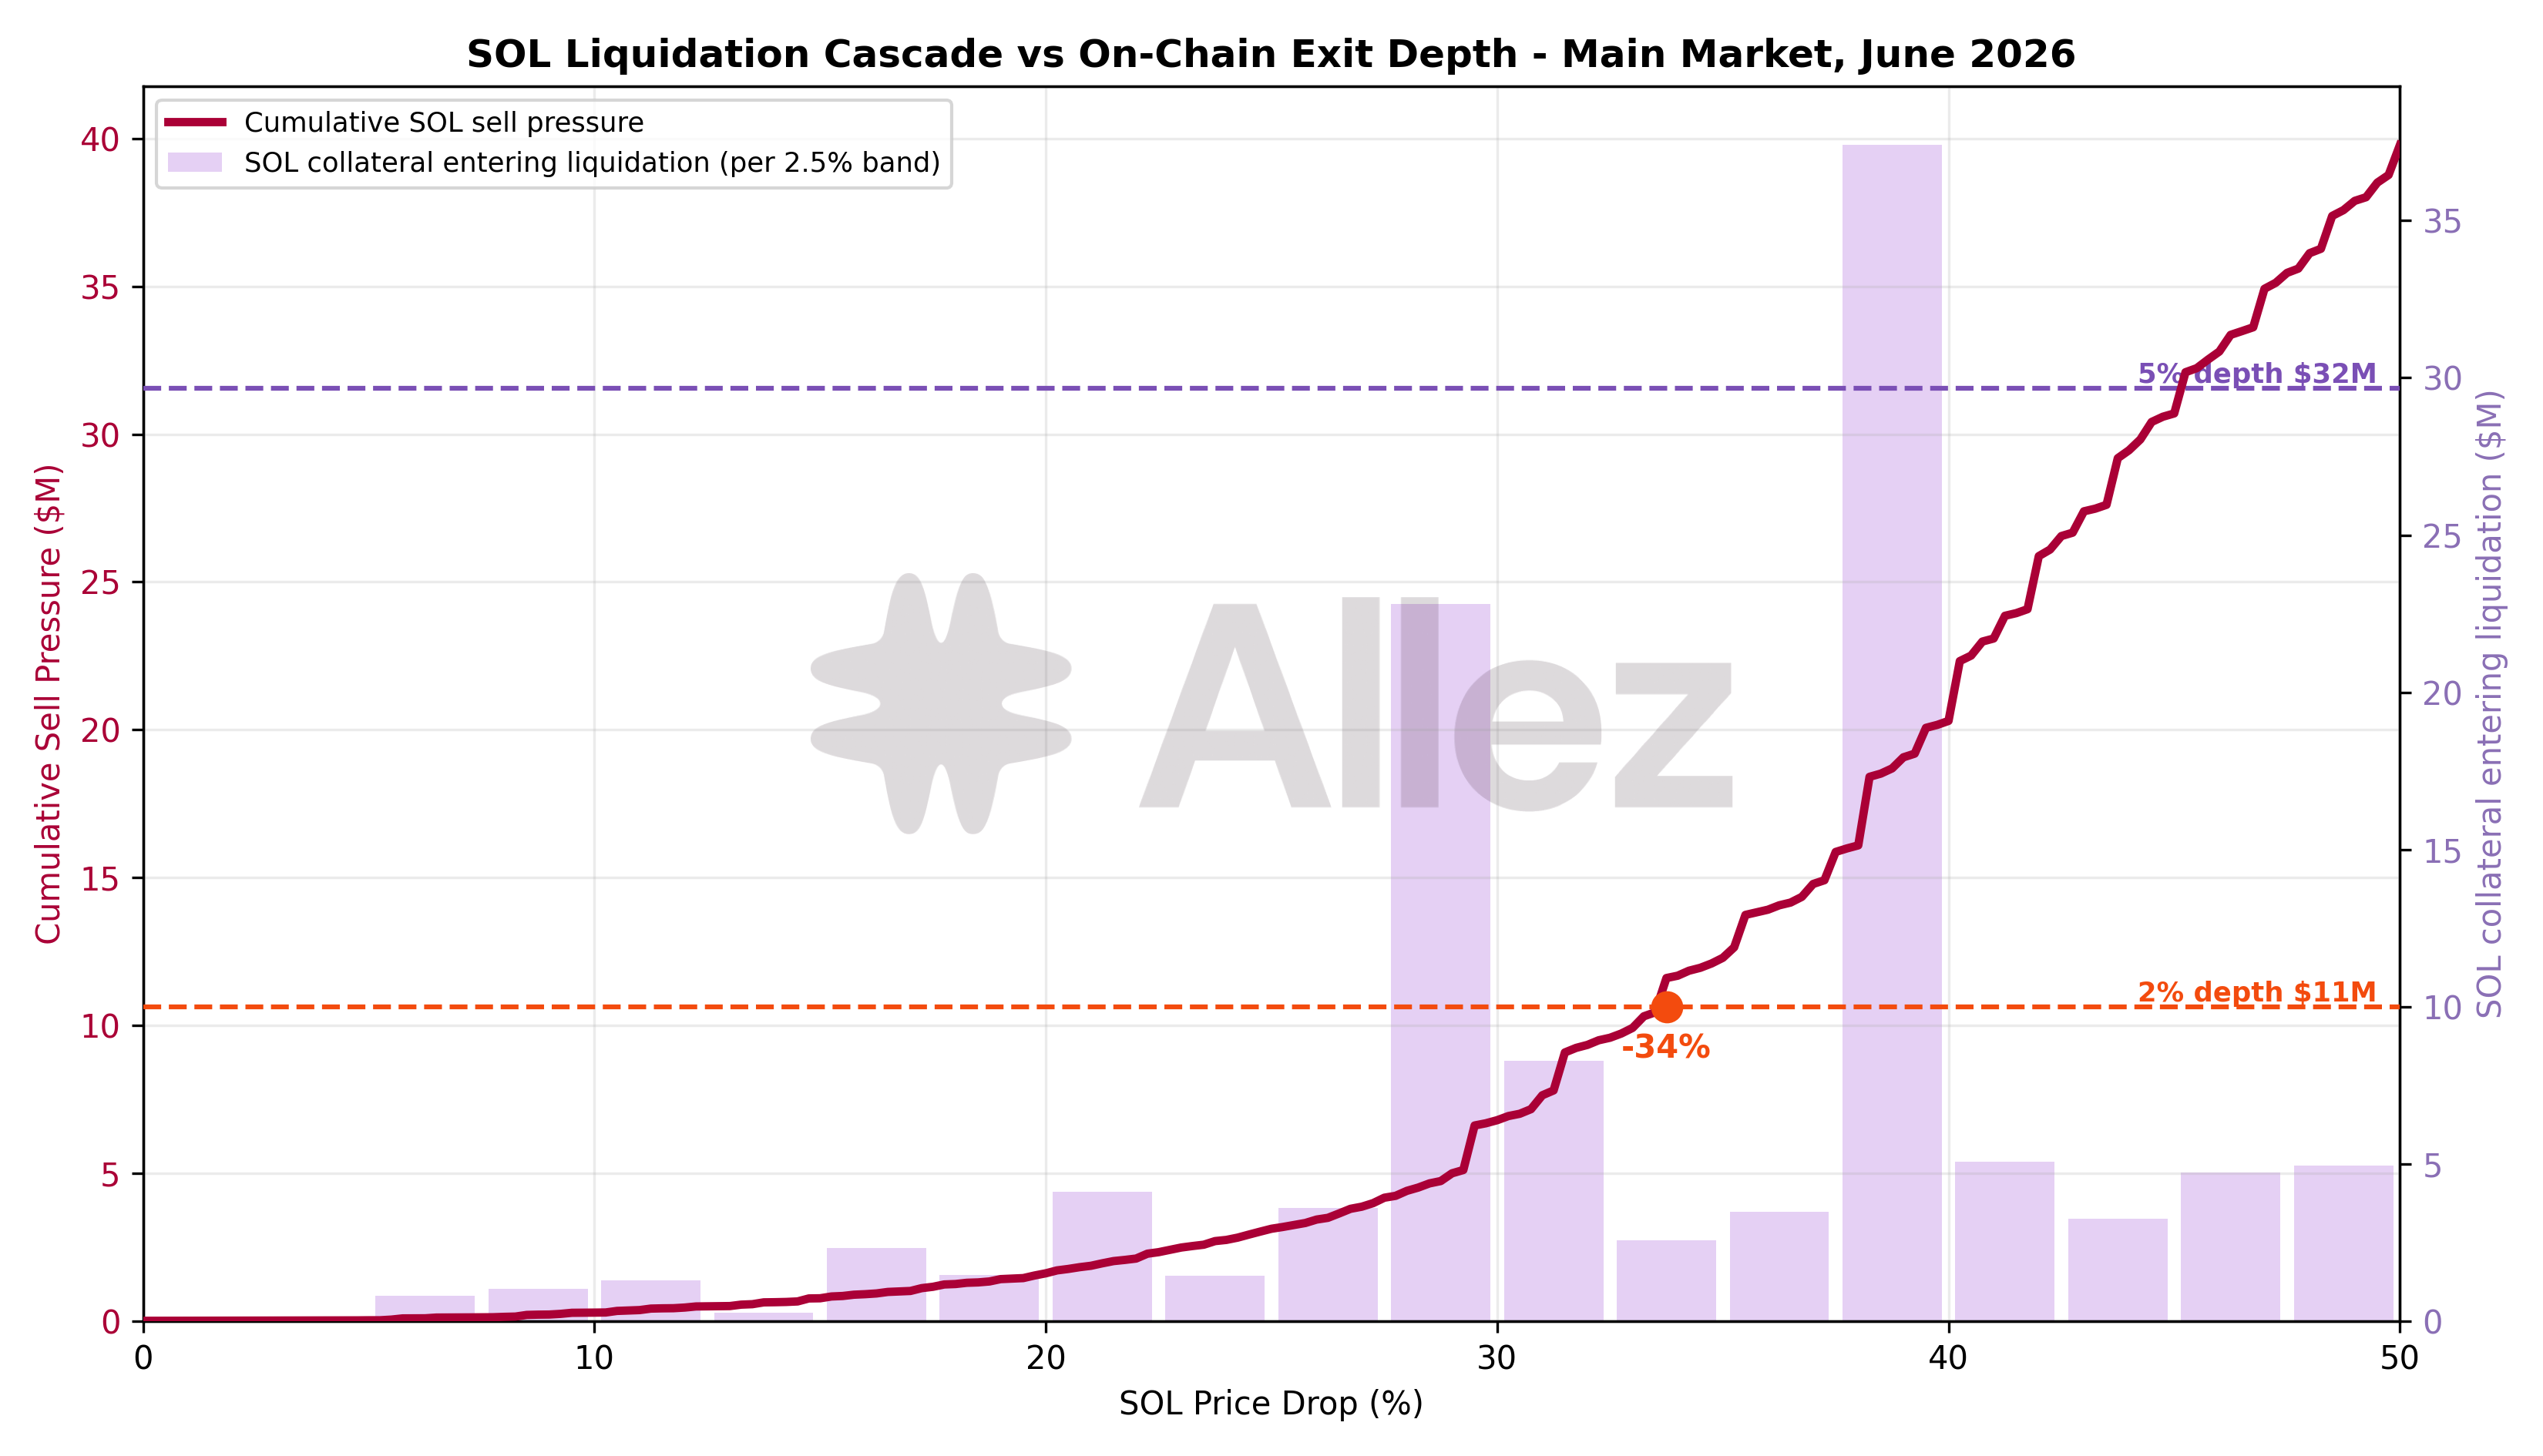
| SOL price drop | Cumulative SOL sell pressure | MoM vs May | Price impact to clear | 2% depth coverage | 5% depth coverage |
|---|---|---|---|---|---|
| -10% | $0.3M | -70% | 0.03% | 36.1x | 107.2x |
| -20% | $1.6M | -61% | 0.17% | 6.6x | 19.4x |
| -30% | $6.8M | -62% | 1.06% | 1.6x | 4.6x |
| -40% | $20.3M | -45% | 2.84% | 0.5x | 1.6x |
| -50% | $39.8M | -22% | 17.57% | 0.3x | 0.8x |
At the realistic shock range, SOL liquidation sell pressure is negligible against on-chain depth: $0.3M at -10% and $1.6M at -20% clear at 0.03% and 0.17% price impact, covered many times over by the 2% depth alone (36x at -10%, 7x at -20%). The cascade reaches $6.8M at -30%, still inside the 2% depth at 1.1% price impact and covered 1.6x. It crosses the 2% depth around -34% and reaches $20.3M at -40%, clearing at 2.8% price impact and covered 1.6x by the 5% depth. Sell pressure stays within the roughly $34M realizable exit ceiling through -40% and only exceeds it beyond that, reaching $39.8M at -50% and running to 18% price impact. The curve stays flat through the shallow band and accelerates through the -30% to -40% range, where the bulk of the SOL collateral crosses its liquidation threshold.
Compared with May, the cascade is lighter: sell pressure fell 45% to 70% across every drop level (for example $17.7M to $6.8M at -30% and $37.1M to $20.3M at -40%), driven by a lower SOL price and a smaller SOL-backed borrow book. The 2% breach point moved out from -28% in May to -34% in June, and the point where the cascade exceeds the realizable exit ceiling shifted from roughly -38% to beyond -45%. On both measures SOL exit risk improved month-over-month.
Two caveats bound the deep-scenario reading. The depth quoted is an atomic SOL-to-USDC exit at a single instant. A real cascade unfolds over many blocks, during which arbitrage and fresh liquidity refill the pools and liquidators can route into USDT and other pairs, so the realizable depth over a liquidation window is larger than any single-instant quote. A -40%-plus SOL move is also an extreme tail. The conclusion is that SOL sell pressure is comfortably absorbed on-chain through the -30% range, and only a fast, deep drawdown would test exit depth.
4. Per-Market Micro Analysis
Spotlight: the USDG-to-PYUSD rotation in the Ethena market
The month's headline market event was the Ethena market's switch of its borrowed stablecoin from USDG to PYUSD, announced June 2. In this one-click Multiply venue, users deposit USDe as collateral and borrow a stablecoin against it, looping to capture the spread between USDe's native yield and the borrow rate. The borrowed leg, USDG through May, migrated to PYUSD over the first week of June.
Ethena ended the month as the protocol's second-largest market at $528.5M of supply (+9.4%), behind Main at $887.7M, and one of only three markets to grow.
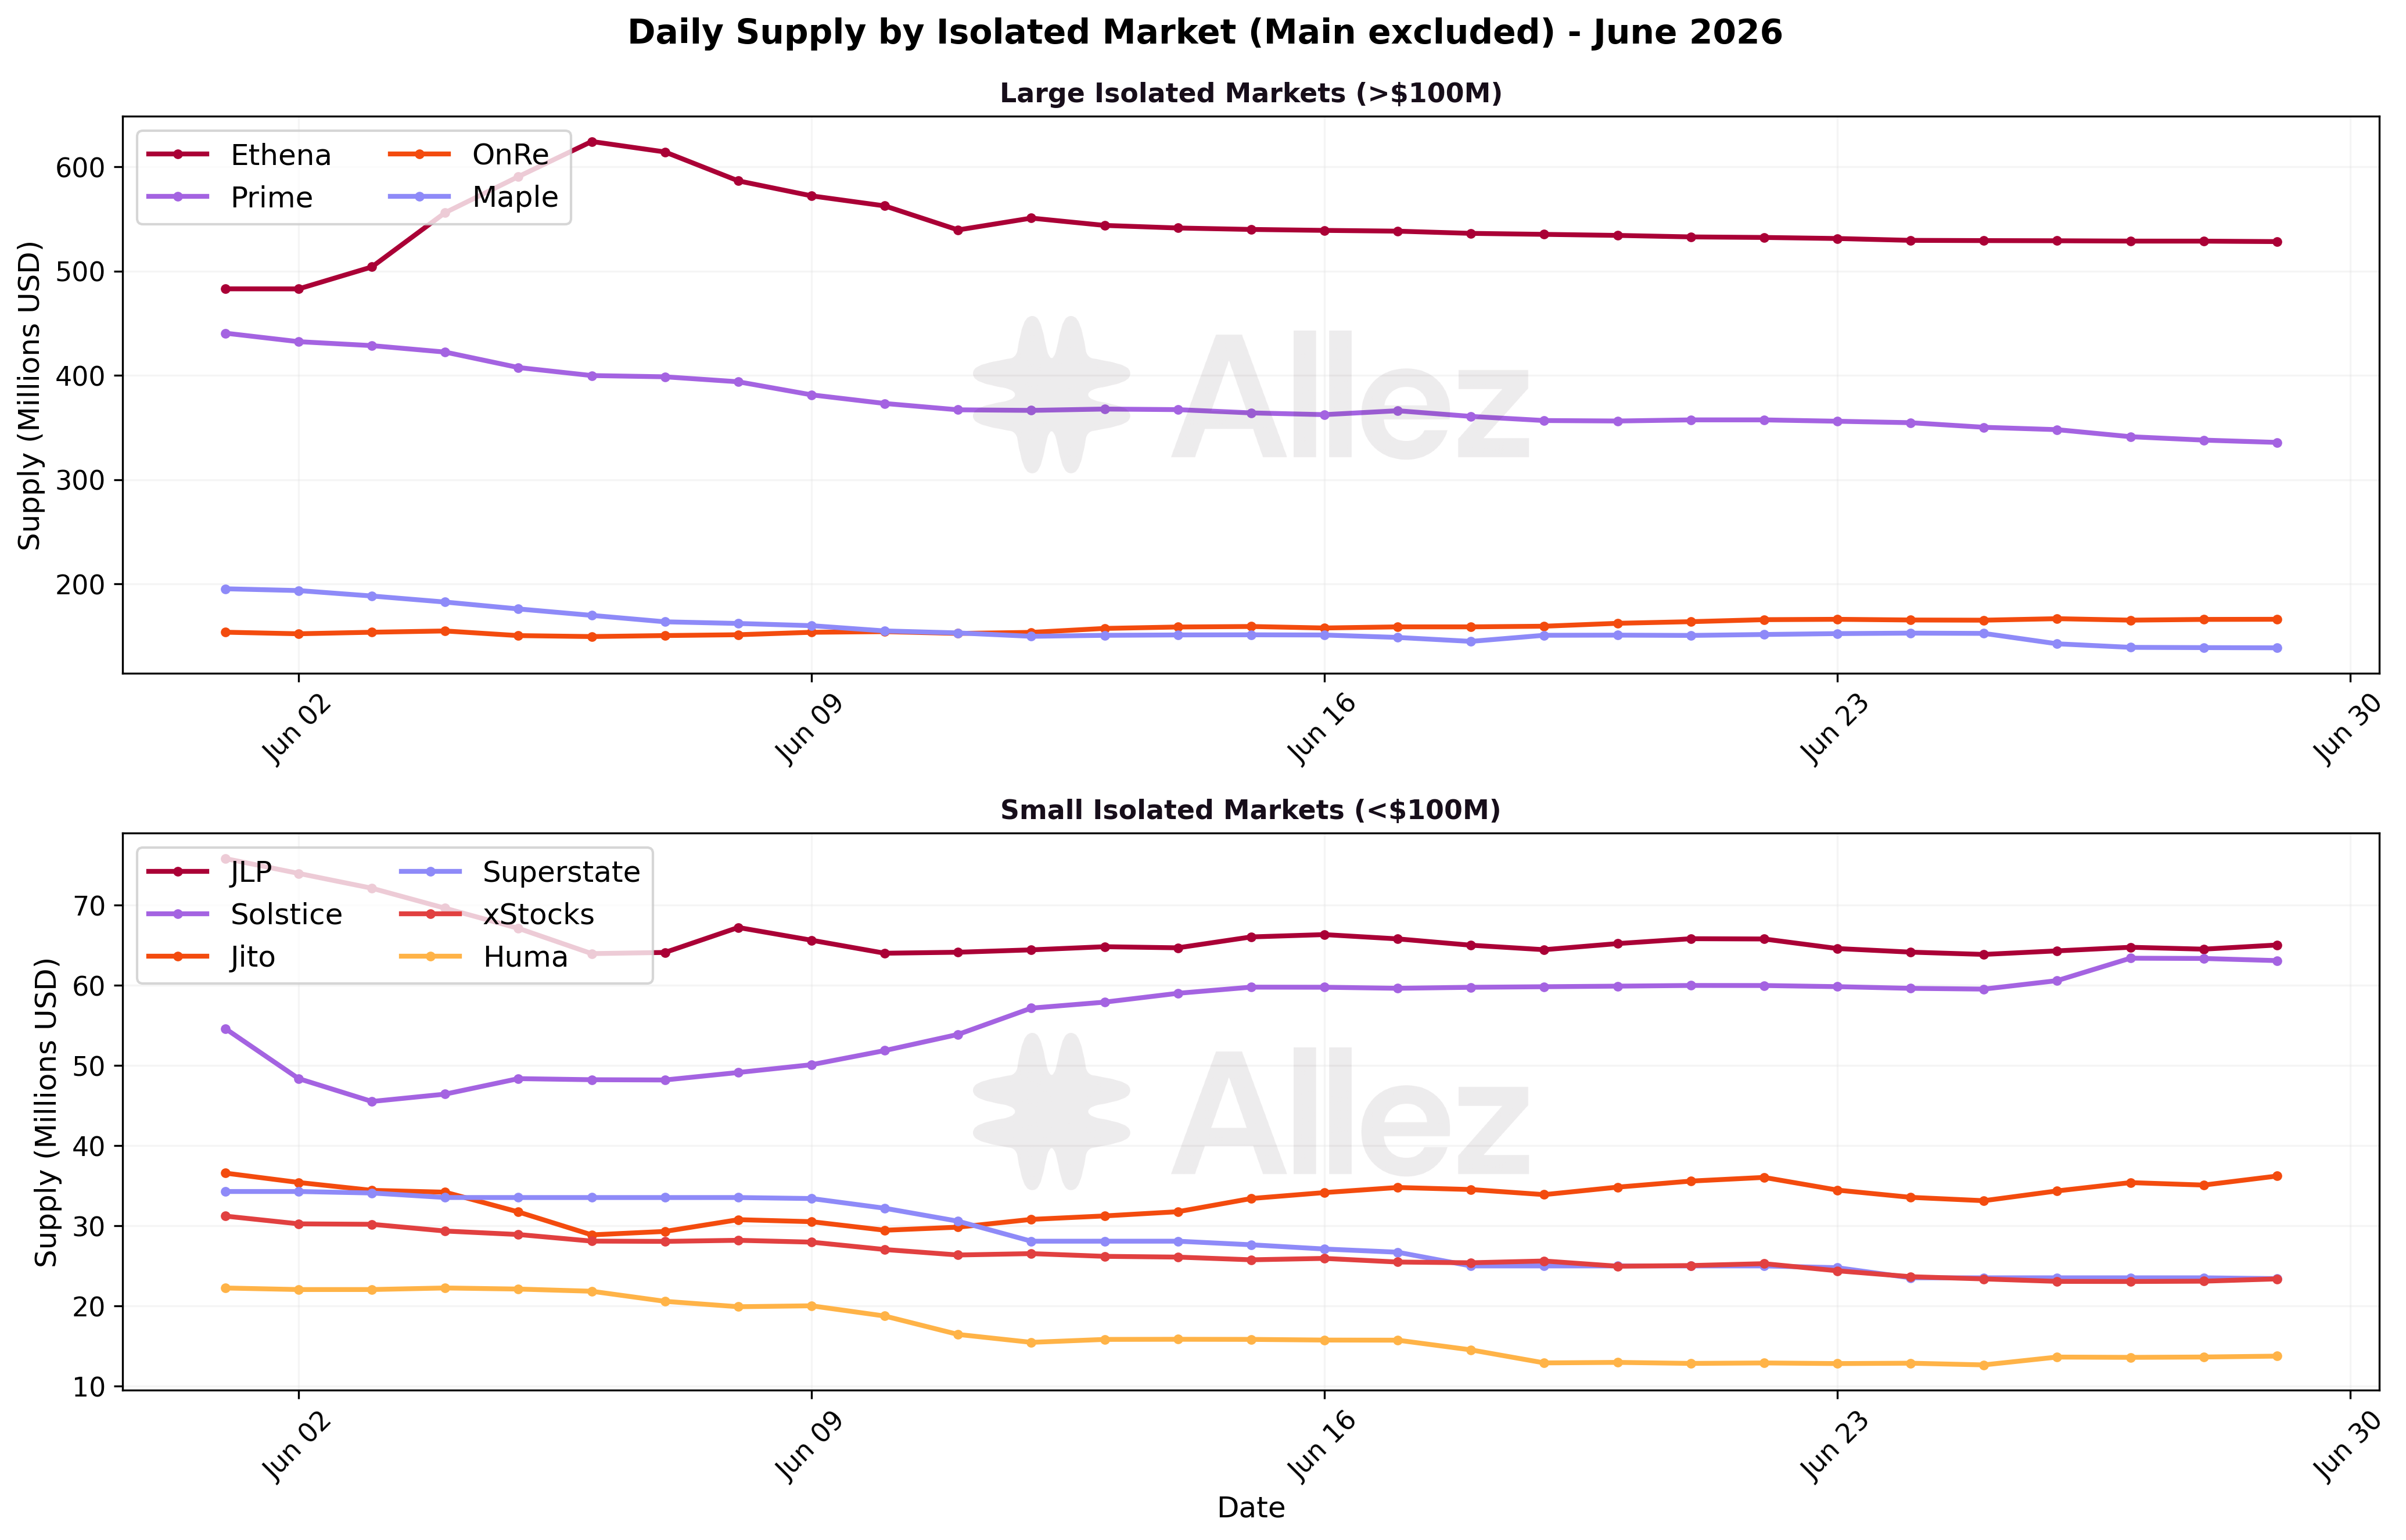
Growing markets: Ethena (+9.4% to $528.5M), OnRe (+8.9% to $165.3M) and Solstice (+9.7% to $63.1M) were the only markets to expand, each just under 10%.
Contracting markets: the contraction was led by the established books. Main eased -20.6% to $887.7M, Prime -26.8% to $325.8M and Maple -29.1% to $139.5M, while several specialized markets fell more than 20%: xStocks -23.4% to $23.9M, Superstate -32.6% to $23.1M and Huma -37.9% to $13.7M.
Market snapshot:
| Market | Supply | Supply MoM | Debt | Debt MoM | Util |
|---|---|---|---|---|---|
| Main | $887.7M | -20.6% | $364.8M | -20.2% | 41.1% |
| Ethena | $528.5M | +9.4% | $238.6M | +12.7% | 45.2% |
| Prime | $325.8M | -26.8% | $135.7M | -26.5% | 41.6% |
| OnRe | $165.3M | +8.9% | $56.9M | +16.0% | 34.4% |
| Maple | $139.5M | -29.1% | $55.2M | -31.8% | 39.6% |
| JLP | $65.1M | -15.0% | $23.3M | -15.5% | 35.8% |
| Solstice | $63.1M | +9.7% | $22.1M | -1.8% | 35.0% |
| Jito | $36.4M | -2.2% | $16.1M | -1.8% | 44.1% |
| xStocks | $23.9M | -23.4% | $5.5M | -18.9% | 23.2% |
| Superstate | $23.1M | -32.6% | $7.9M | -36.1% | 34.3% |
| Huma | $13.7M | -37.9% | $5.5M | -24.3% | 40.2% |
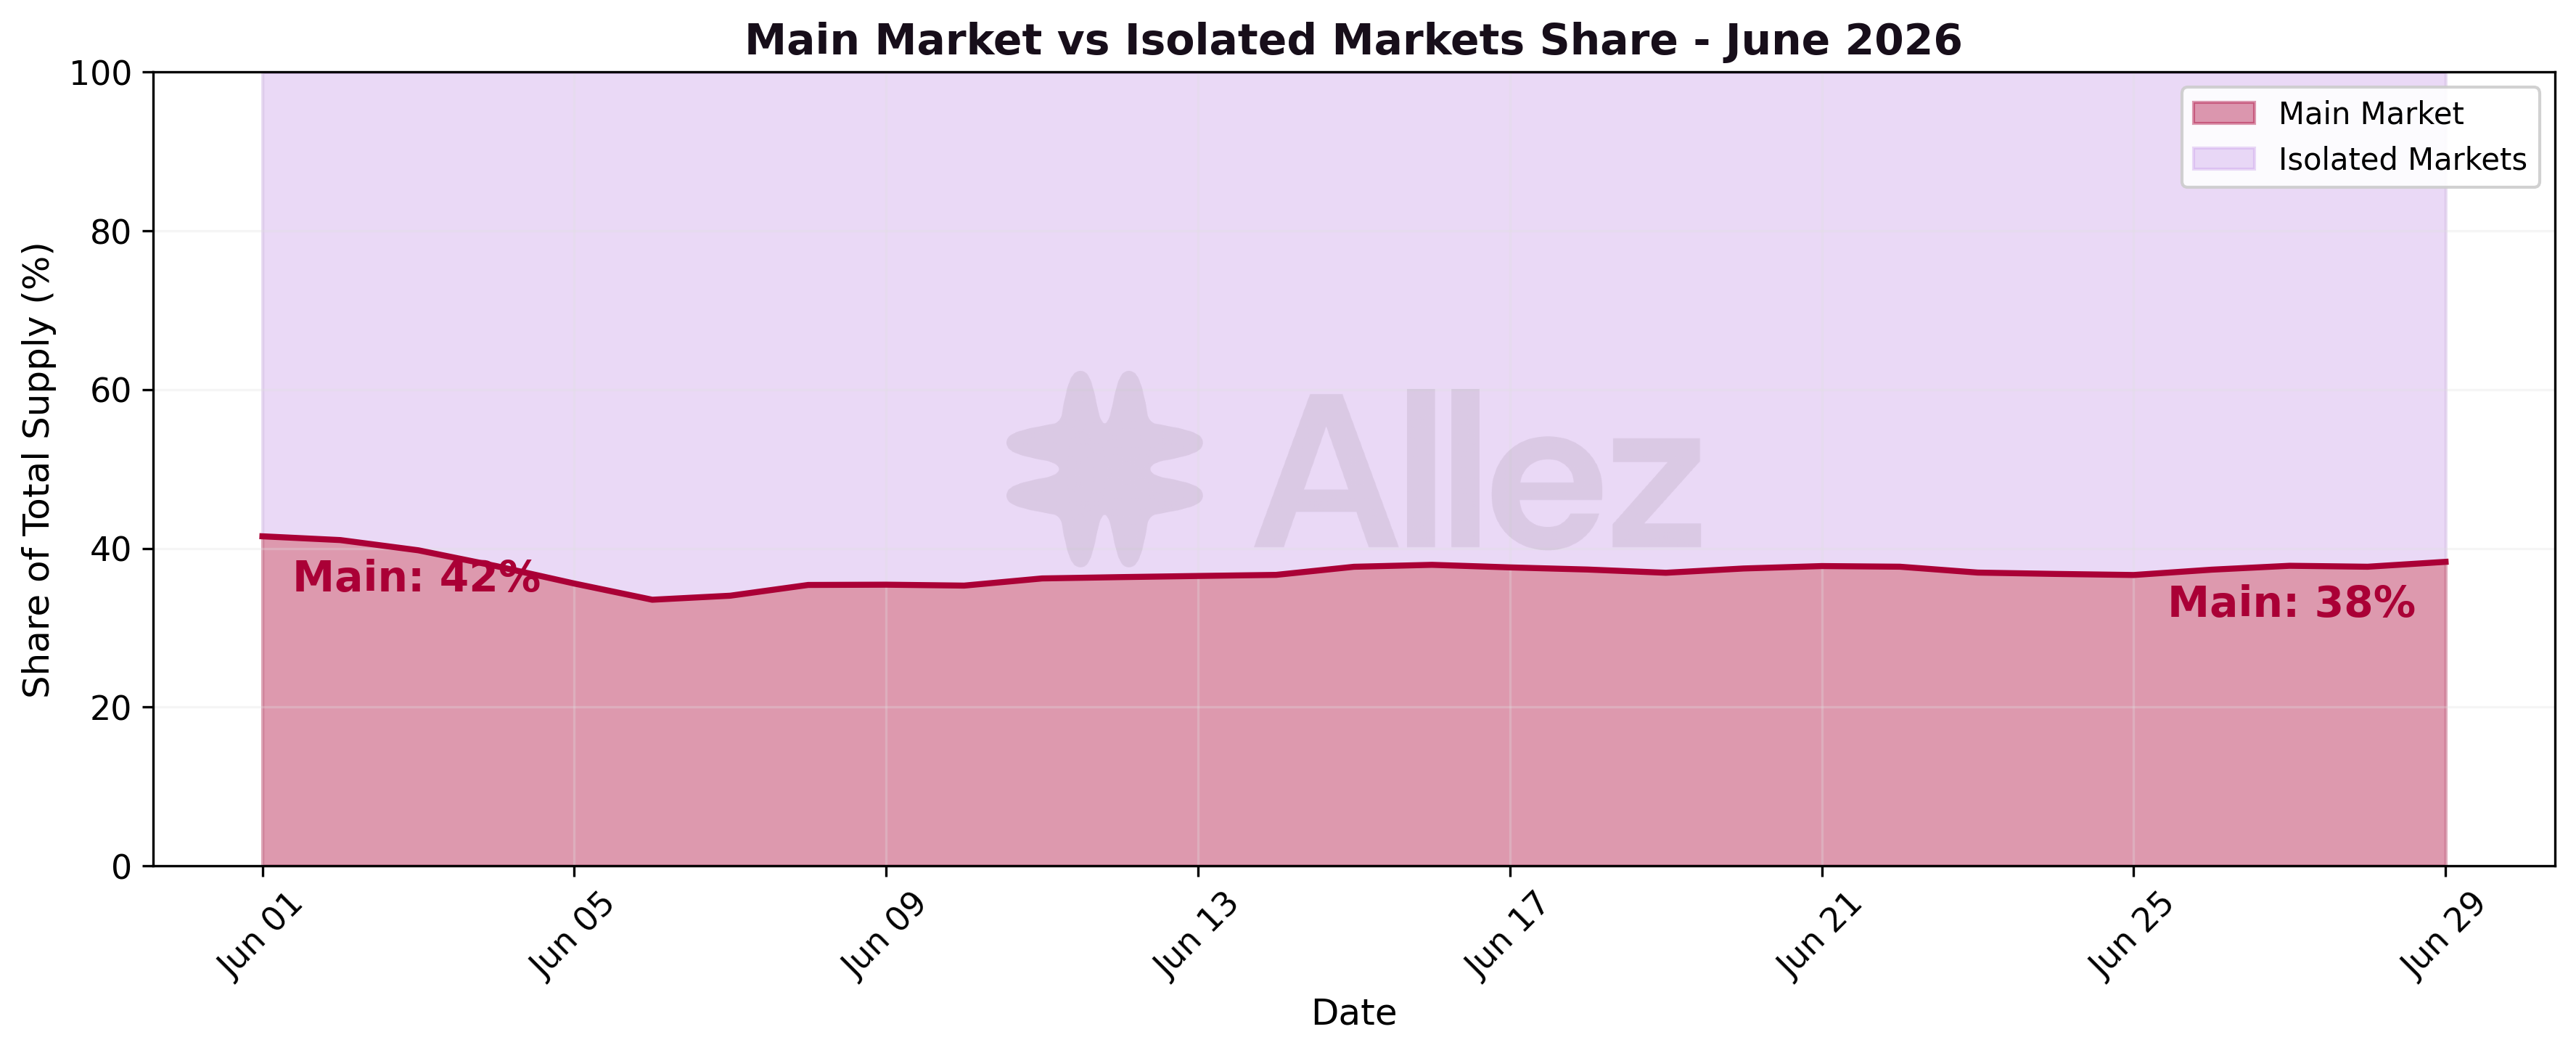
Main's share of protocol supply kept falling, from about 42% in May to about 38% in June. The decline comes from Main's own contraction (-20.6%, steeper than the protocol's -14.4%), not from capital flowing into other markets: the only markets that grew (Ethena, OnRe, Solstice) are far too small to absorb the roughly $231M that Main shed.
5. Kamino Lending Vaults
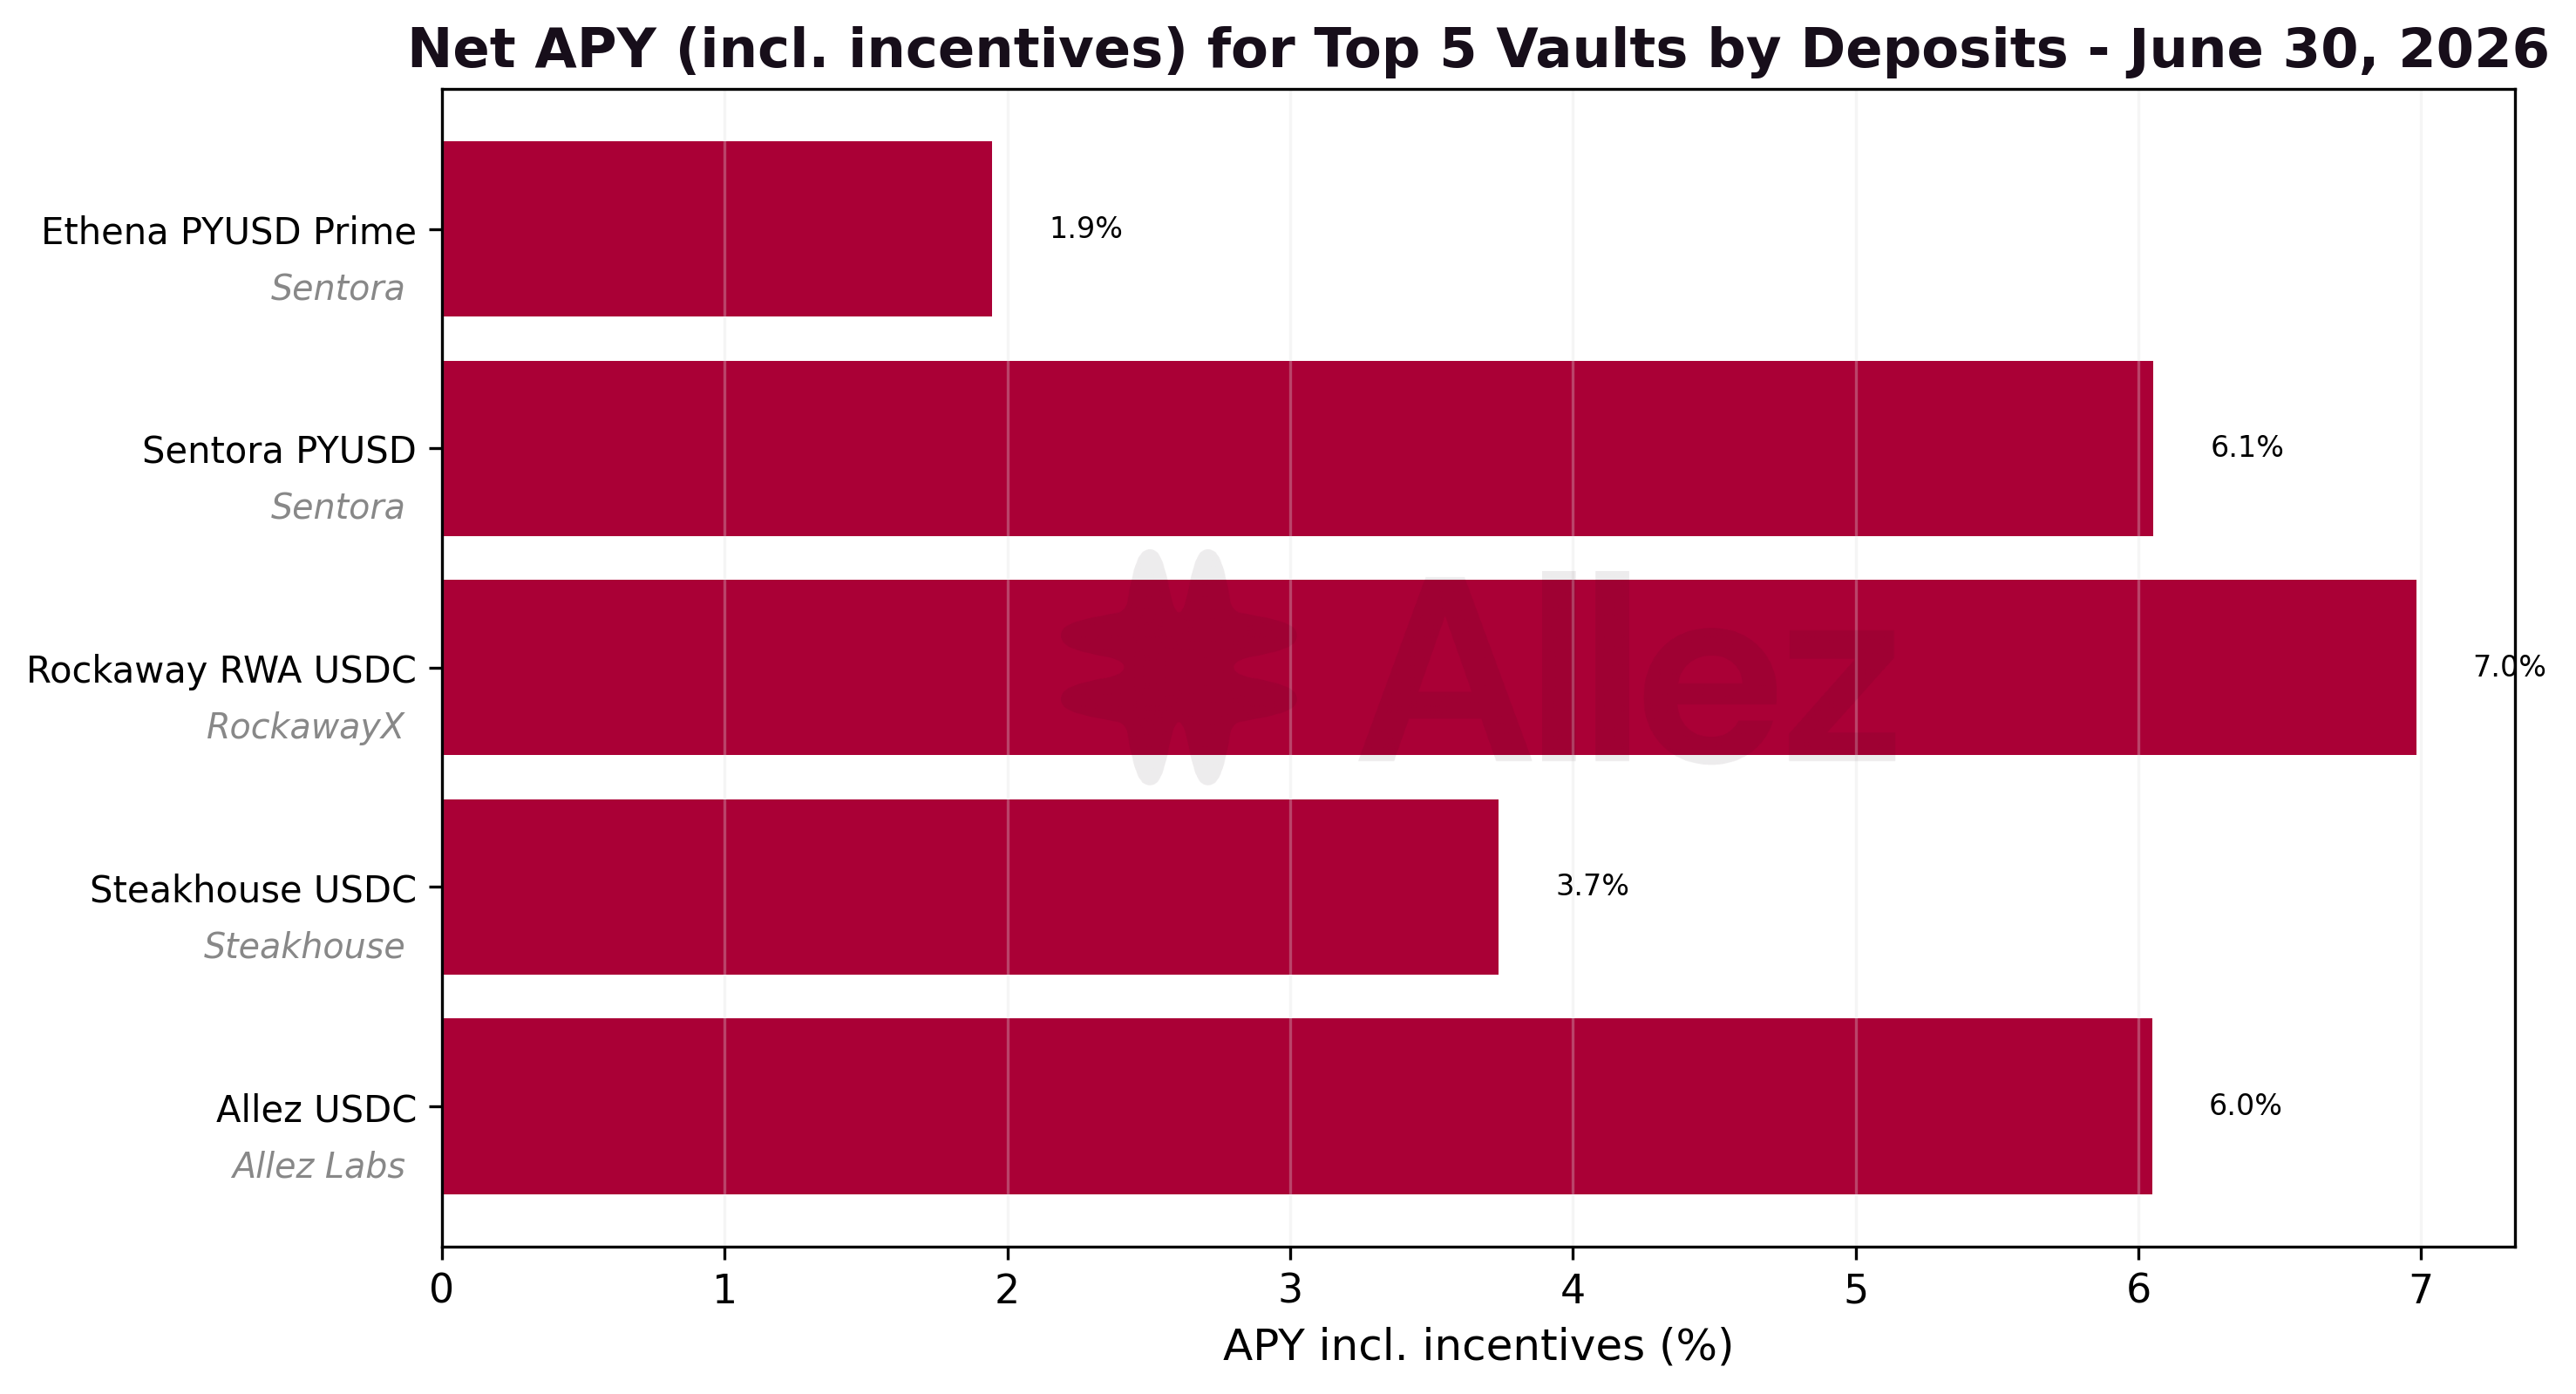
| Vault | Token | Deposits | Deposits MoM | Lending APY | Net APY (incl. incentives) |
|---|---|---|---|---|---|
| Ethena PYUSD Prime | PYUSD | $250.3M | new | 2.04% | 1.95% |
| Sentora PYUSD | PYUSD | $142.3M | -26.7% | 3.28% | 6.05% |
| Rockaway RWA USDC | USDC | $26.0M | -40.3% | 6.93% | 6.98% |
| Steakhouse USDC | USDC | $22.5M | -26.5% | 3.94% | 3.74% |
| Allez USDC | USDC | $16.0M | +23.0% | 6.21% | 6.05% |
| Ethena Prime | USDG | $7.5M | -97.0% | 3.11% | 2.94% |
| CASH Earn | CASH | $7.3M | -34.2% | 2.90% | 2.91% |
| Elemental USDG Optimizer | USDG | $5.7M | +3.7% | 8.06% | 8.14% |
| Allez SOL | SOL | $5.0M | -19.5% | 4.22% | 5.70% |
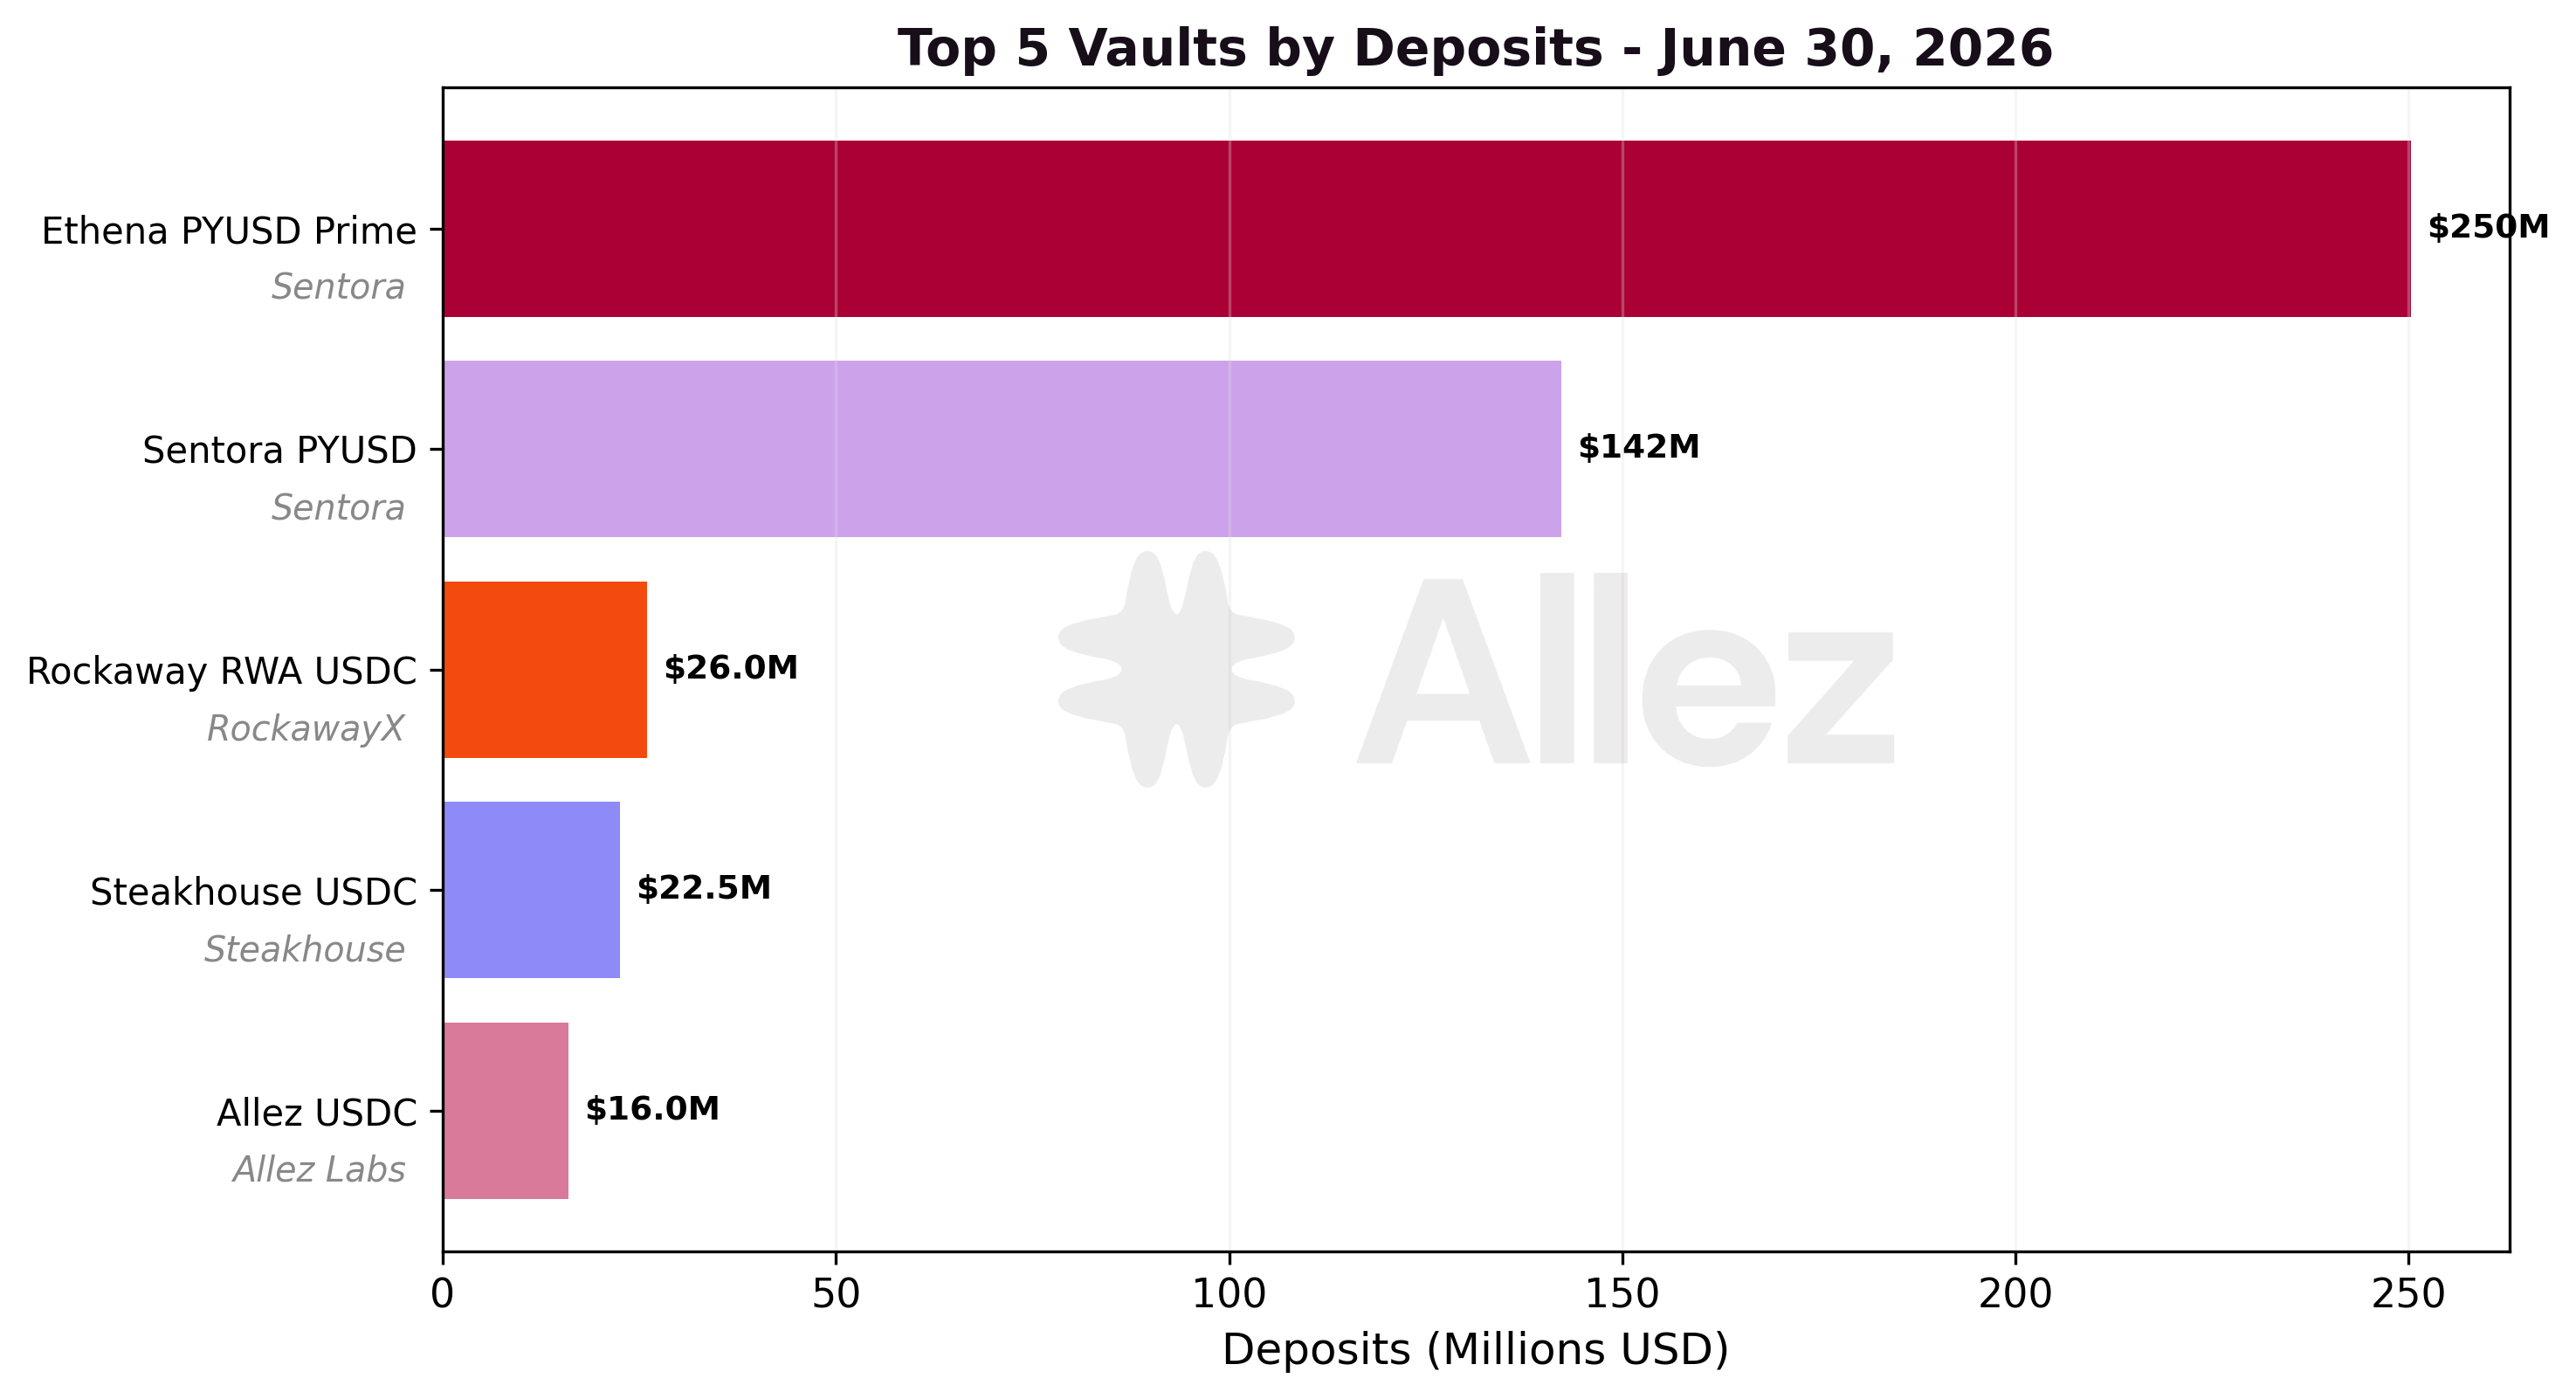
The vault layer reflects the same USDG-to-PYUSD rotation seen in the reserves. The new Ethena PYUSD Prime vault holds $250.3M of PYUSD and supplies borrow liquidity to the Ethena PYUSD Multiply market, while the prior USDG-denominated Ethena Prime vault shrank to $7.5M. These vaults route deposits into the underlying Kamino reserves, so their balances are the same capital tracked at the curator layer, not additional supply on top of the reserve totals.
Beyond that rotation, the vault set is dollar-heavy and top-weighted. The two PYUSD vaults, Ethena PYUSD Prime and Sentora PYUSD at $142.3M, together hold the large majority of tracked vault deposits, followed by a tier of USDC vaults from $16.0M to $26.0M (Rockaway RWA, Steakhouse and Allez) and smaller USDG, CASH and SOL vaults below $8M.
Both APYs are month-end figures. The Lending APY is the base supply yield; the Net APY adds vault incentives and is net of the curator fee, so a vault carrying no incentive can sit just below its lending rate (Ethena PYUSD Prime, Steakhouse USDC). Where a vault runs an incentive it lifts the figure materially: Sentora PYUSD's 6.05% net is 3.28% base lending plus 2.93% in PYUSD rewards, and Allez SOL's 5.70% net is 4.22% base plus a 1.66% reward layer. The largest vault, Ethena PYUSD Prime, has no active incentive, so its 1.95% net is essentially the base lending yield and sits below smaller USDC vaults paying 6% to 8% (Rockaway RWA 6.98%, Elemental USDG Optimizer 8.14%).
6. Transaction Volume & User Behavior
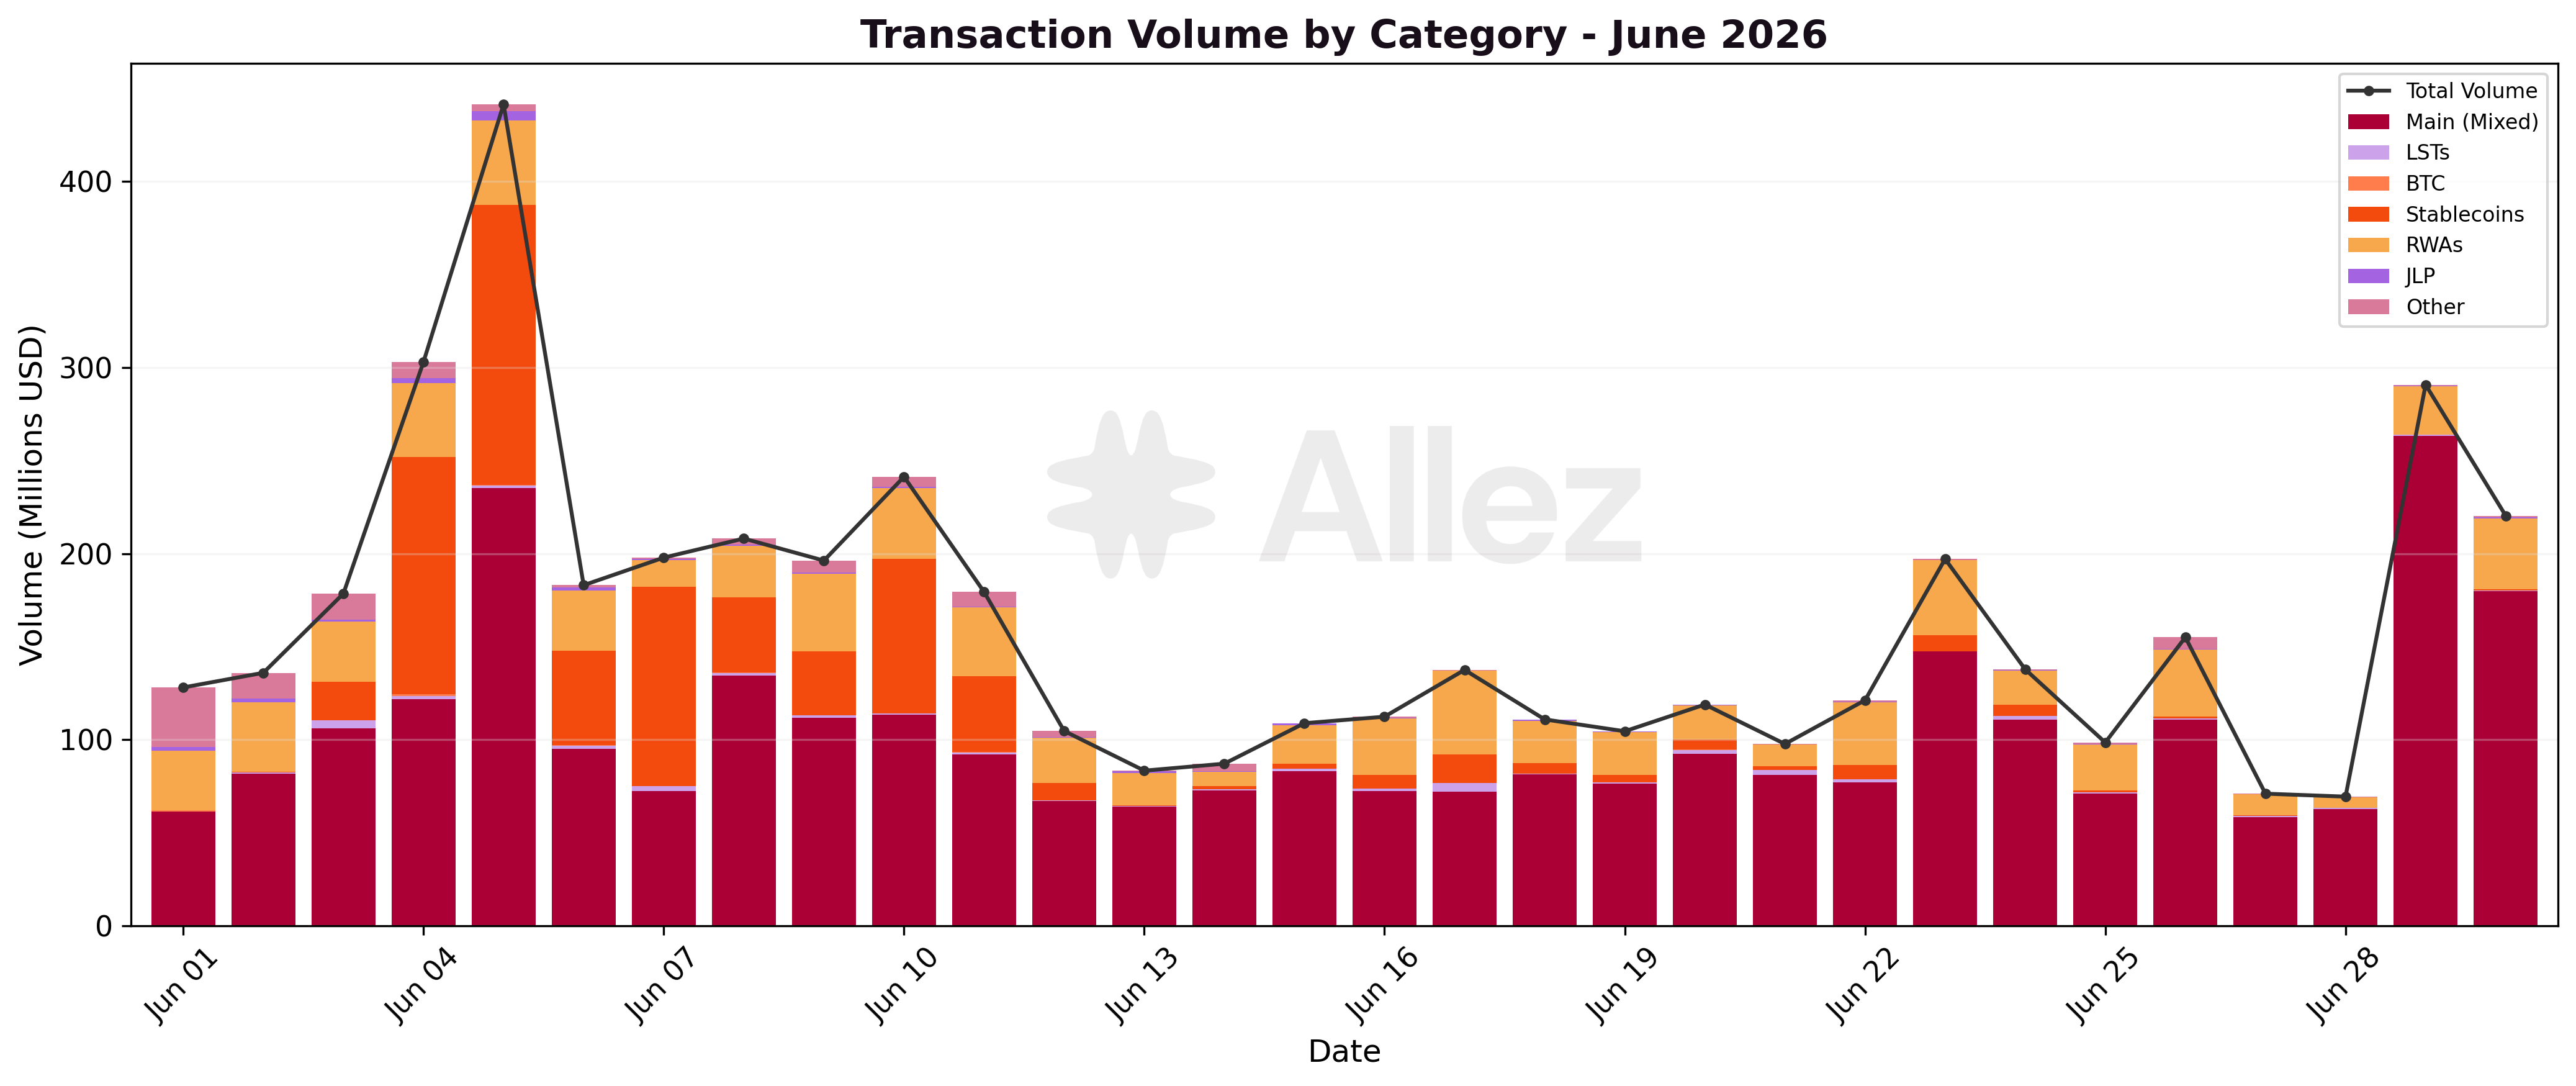
Transaction volume totaled $4.82B across 291,825 transactions, up +28% MoM. The increase broke the recent downtrend and came despite lower balances.
| Type | Volume | Share | May Volume | MoM |
|---|---|---|---|---|
| Withdraw | $1.89B | 39% | $1.33B | +41% |
| Deposit | $1.70B | 35% | $1.32B | +29% |
| Repay | $0.68B | 14% | $0.49B | +38% |
| Borrow | $0.56B | 12% | $0.60B | -8% |
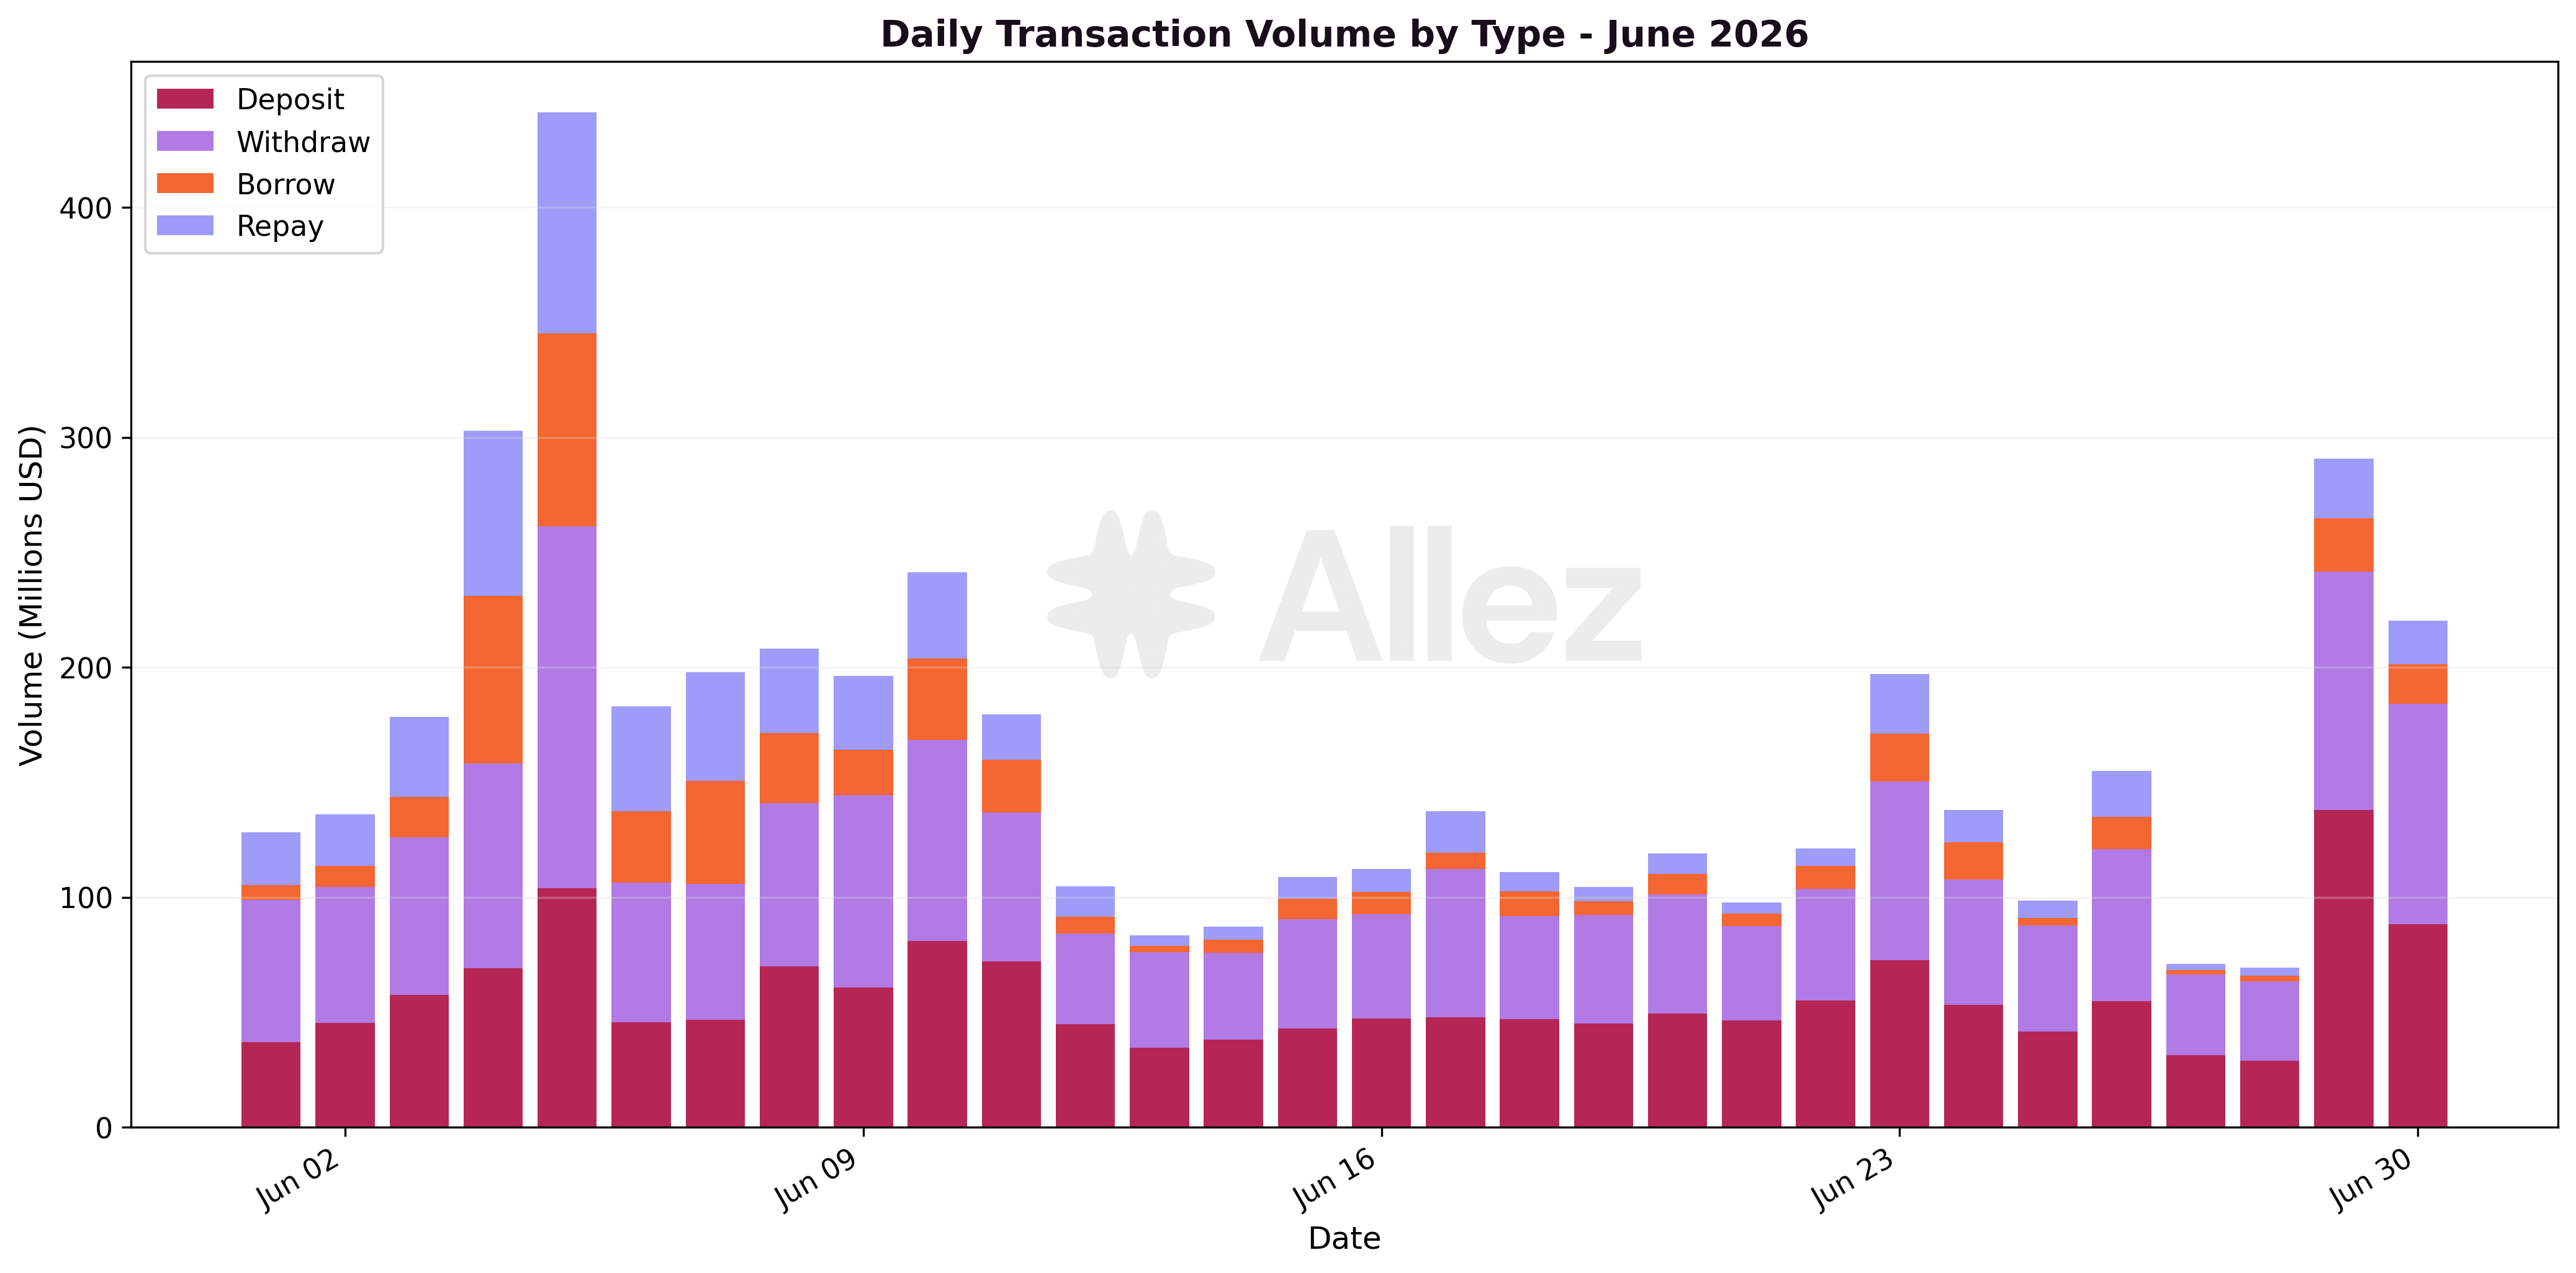
Withdrawals exceeded deposits and repayments exceeded new borrowing, and both imbalances point in the same direction: net capital leaving the supply side and net debt being repaid, consistent with the month's contraction.
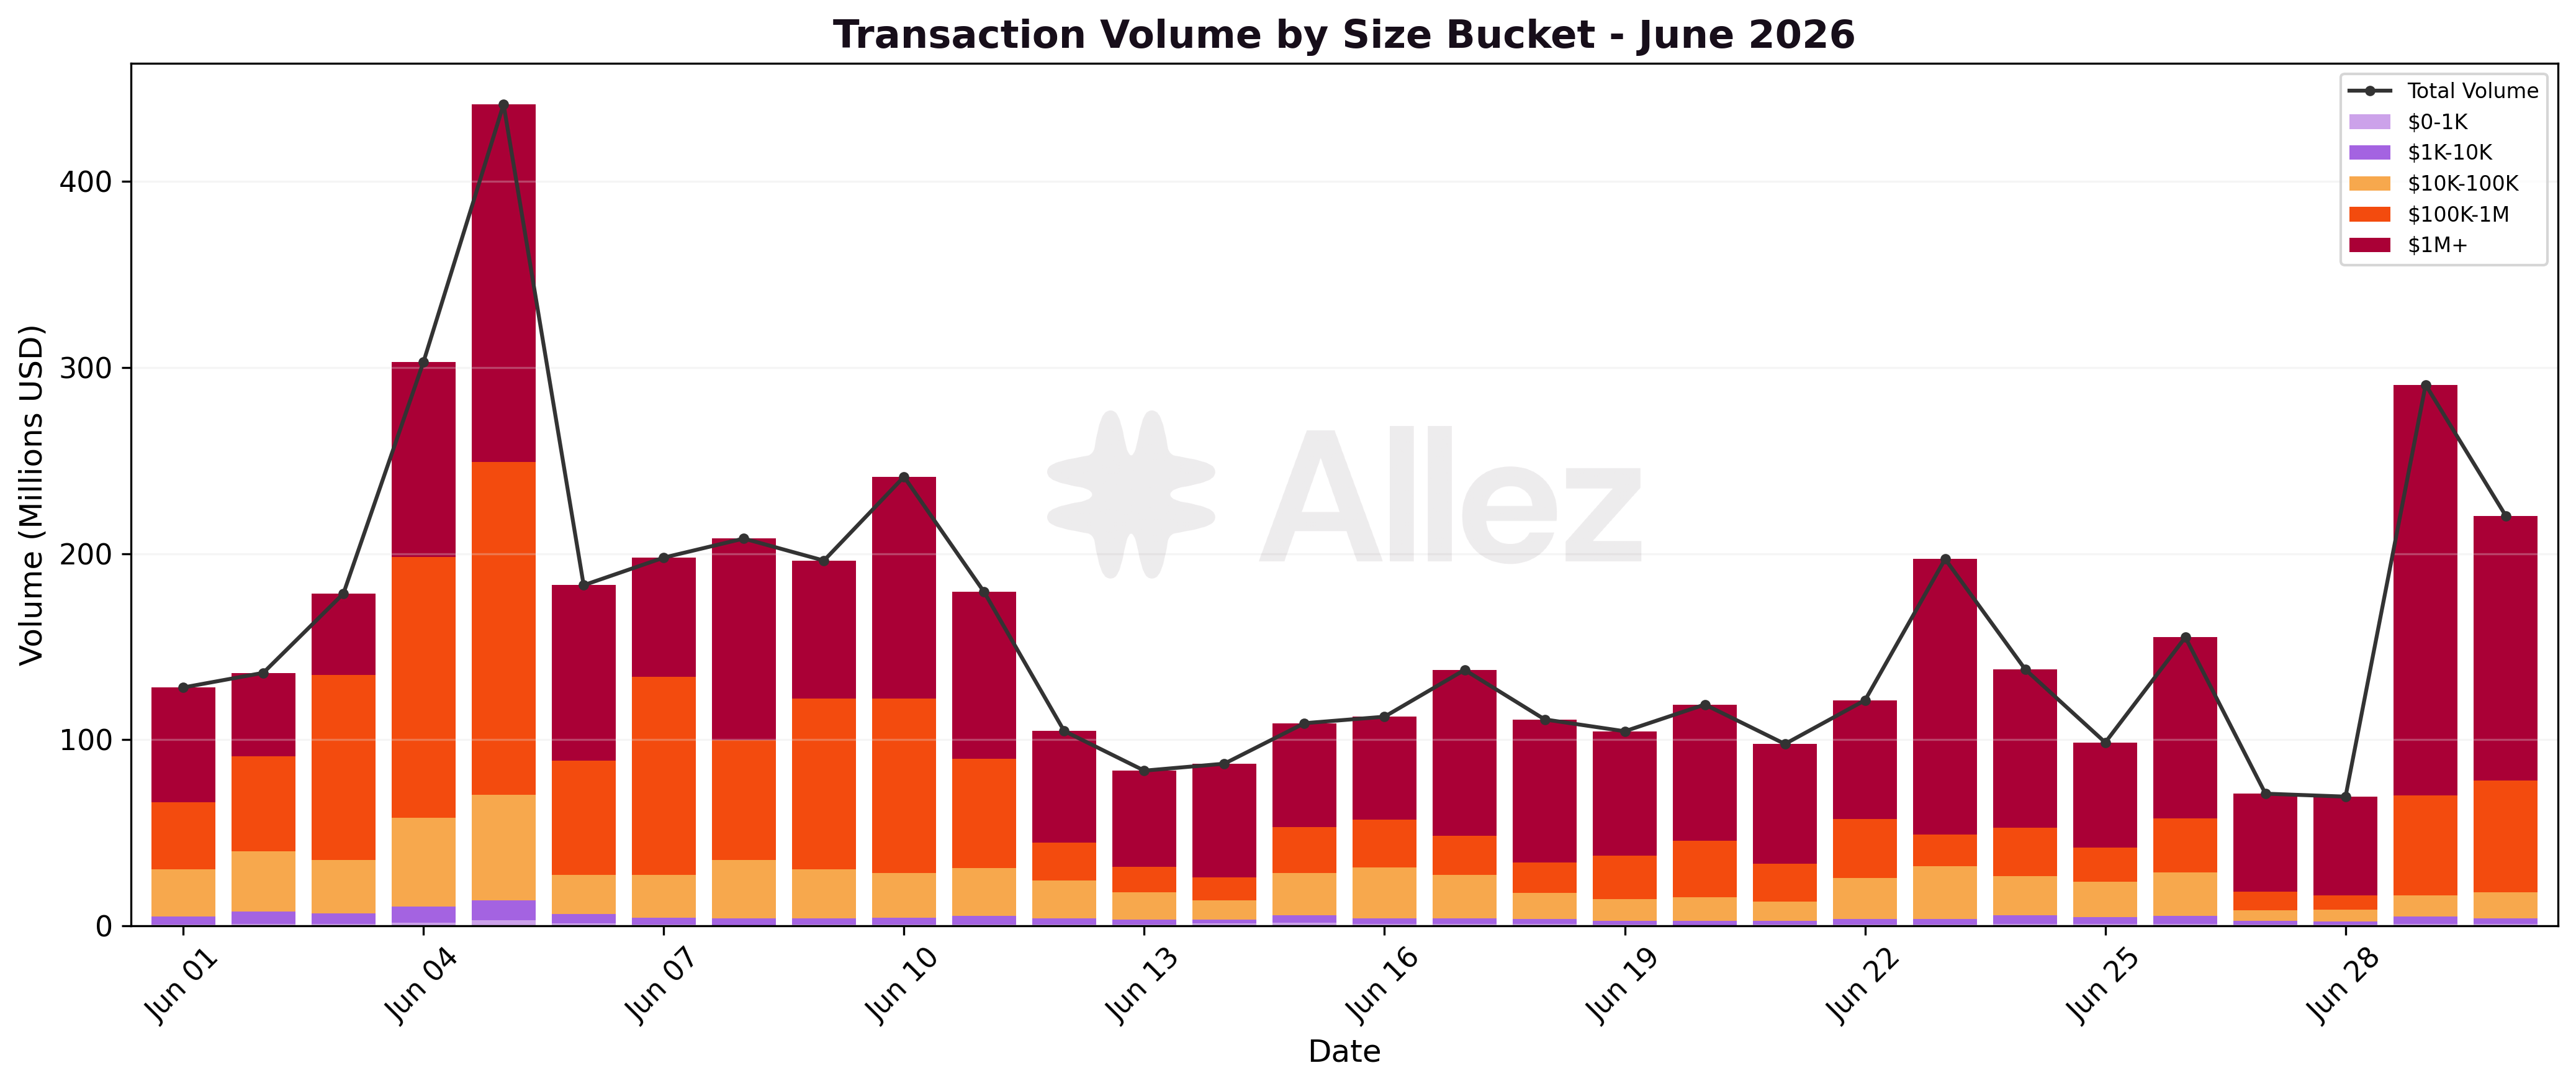
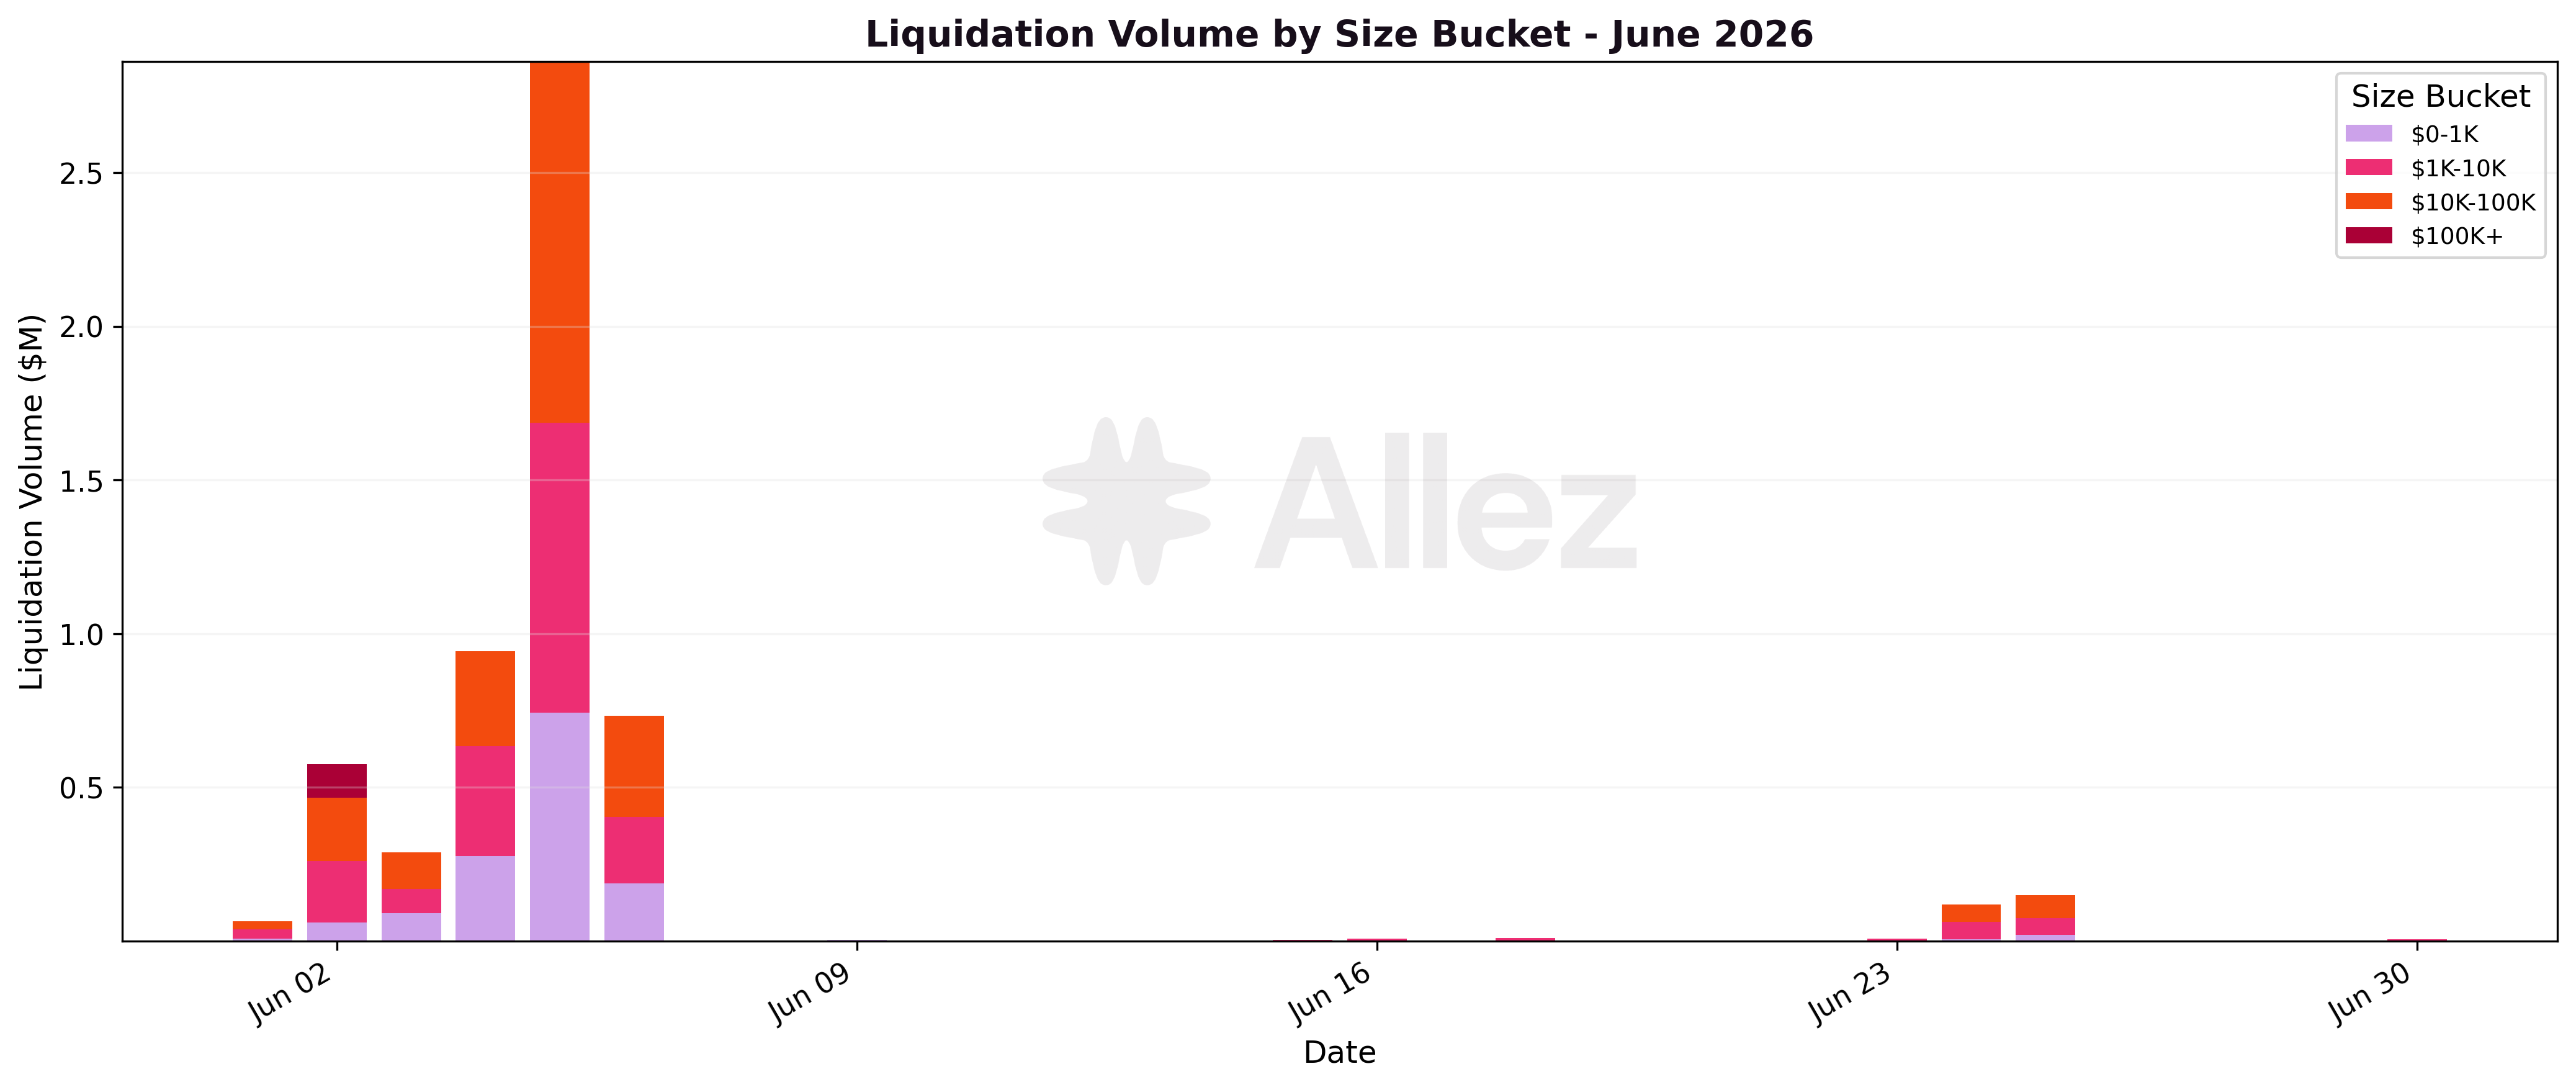
Volume is concentrated in large transfers across the whole month. The $1M-plus and $100K-to-$1M buckets account for the large majority of daily volume, while sub-$10K retail activity is negligible on every day. The busiest day was June 5 at roughly $440M, coinciding with the peak of the SOL cascade, with a smaller rebound on June 28 to 29. The size mix is consistent with a book driven by a small number of large depositors and borrowers rather than broad retail flow.
7. Conclusions & Forward Look
June was a contraction month across every category and most markets, driven by the early-June SOL slide, and SOL's rebound into month-end did not pull balances back up.
The drawdown resolved through liquidations with an early-June cascade of partial liquidations that reduced leverage rather than fully closing positions out, and it subsided as SOL steadied. Because the contraction pulled high-LTV collateral out of the book, collateral at risk fell at every stress scenario, so the protocol enters July with less exposure to a further shock.
The main capital shift was a rotation, as the Ethena market switched its borrowed stablecoin from USDG to PYUSD. Everywhere else the established books deleveraged and only a few small markets grew. Transaction volume rose even as balances fell, led by withdrawals and repayments, consistent with orderly deleveraging rather than distress selling.
Outlook
Three questions carry into July. The first is whether the deleveraging stabilises now that SOL has steadied off its lows, or whether the established markets keep contracting. The second is whether stablecoin supply returns to the markets where leverage demand sits: with the main looping reserves ending June near their utilization caps, borrowers have little room to add leverage until fresh stablecoin deposits arrive. The third is how durable the Ethena market's PYUSD book proves under its new borrowed leg, and whether the looping leverage holds or unwinds.
Appendix: Asset Category Classification
| Category | Top Assets | Month-End Supply | Supply MoM |
|---|---|---|---|
| Stablecoins | USDC, PYUSD, USDe, USDG, USDT | $1,095.4M | -8.6% |
| LSTs | JitoSOL, JupSOL, mSOL, dSOL, INF | $440.7M | -16.5% |
| RWAs | PRIME, syrupUSDC, ONyc, xStocks, eUSX | $413.7M | -19.6% |
| SOL | SOL | $238.5M | -11.4% |
| BTC | cbBTC, xBTC, WBTC | $57.7M | -48.2% |
| Other | ETH, JLP, governance/meme tokens | $47.1M | -16.0% |
Classification notes:
-
LSTs: liquid staking tokens. Any token ending in "sol" (except SOL itself) plus INF.
-
RWAs: tokenized real-world assets accessing DeFi liquidity, including PRIME, syrupUSDC (a Maple credit market token, classified as RWA despite the USDC suffix), ONyc, tokenized stocks (xStocks) and PT-* tokens.
-
Stablecoins: USDC, PYUSD, USDe, USDG, USDT, CASH, USX, USDS and other dollar- and euro-pegged tokens.
-
BTC: cbBTC, xBTC, WBTC and other wrapped Bitcoin.
-
Other: ETH, JLP, and governance/meme tokens.
This report represents independent risk analysis by Allez Labs for the Kamino Finance community.
Prepared by: Allez Labs Risk Team
Report Date: June 30, 2026
Next Report: July 2026 Monthly Report published in August 2026