July was a calm month for Kamino Lend, with few liquidations and little volatility as SOL slightly dipped to recover. Supply and debt eased modestly (~3.3%), continuing June's deleveraging at a slower pace, while interest paid rose as SOL utilization moved past the kink. Within the book, the OnRe insurance market grew 26% to new highs as the Prime and Maple markets contracted. Four new curated markets launched: the HYPE market (curated by Allez Labs) opened July 2, and three new RWA markets, auto-loan credit (AUTO), trade-finance yield (oTFY curated by RockawayX) and tokenized gold (PAXG curated by Steakhouse), launched at month-end.
1. Market Context and SOL Price
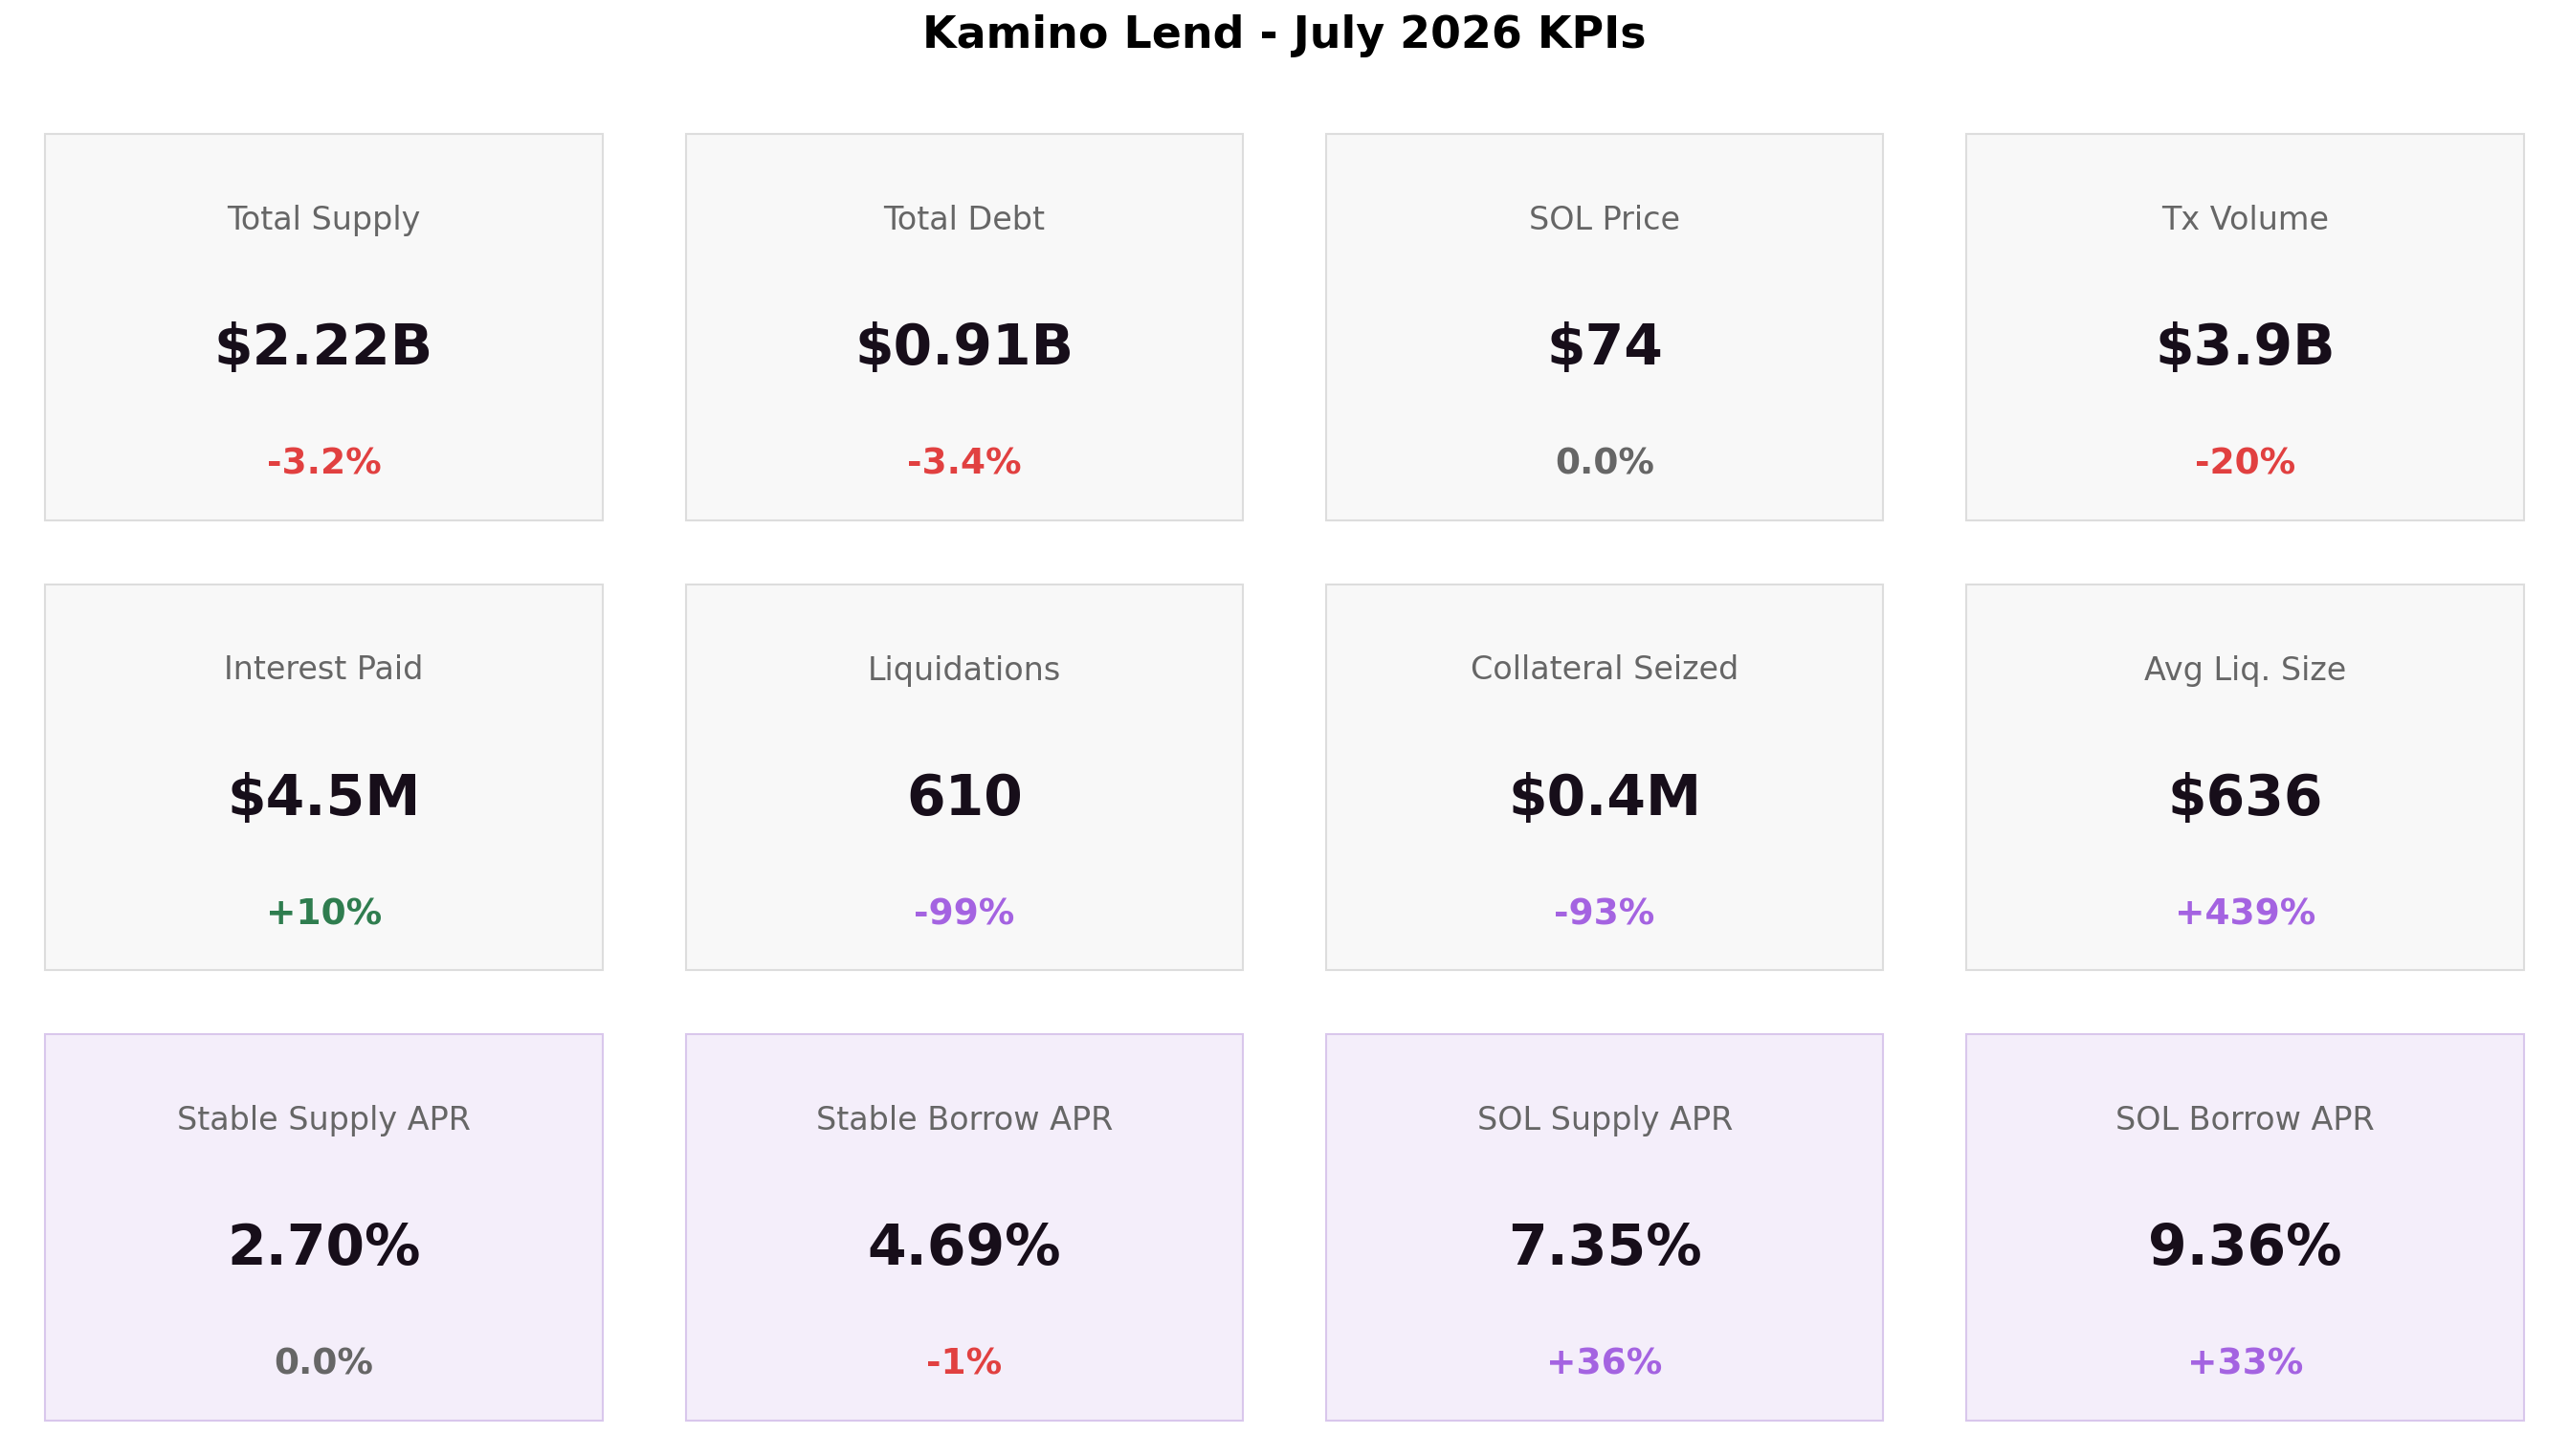
July was a quiet month as every flow metric eased by just a few percent, and liquidation activity stayed minimal, even as SOL swung mid-month (detail below). The SOL-driven deleveraging that defined June has largely run its course: a -14.4% supply contraction became -3.2%.
-
Total Supply: $2.22B (-3.2% MoM)
-
Total Debt: $0.91B (-3.4% MoM)
-
SOL Price: $73.51 at month-end (0% MoM vs June close of $73.54)
-
Transaction Volume: $3.86B (-20.4% MoM)
-
Interest Paid: $4.53M (+10.0% MoM)
-
Liquidations: 610 events (-98.8% MoM)
-
Collateral Seized: $0.39M (-93.3% MoM)
-
Average Liquidation Size: $636 (+438.7% MoM)
Transaction volume of $3.86B was down 20.4% from June and toward the lower end of the protocol's recent range, consistent with a quieter summer month. Deposits ($1.58B) and withdrawals ($1.59B) were closely matched. Repay volume ($0.38B) exceeded borrow volume ($0.30B).
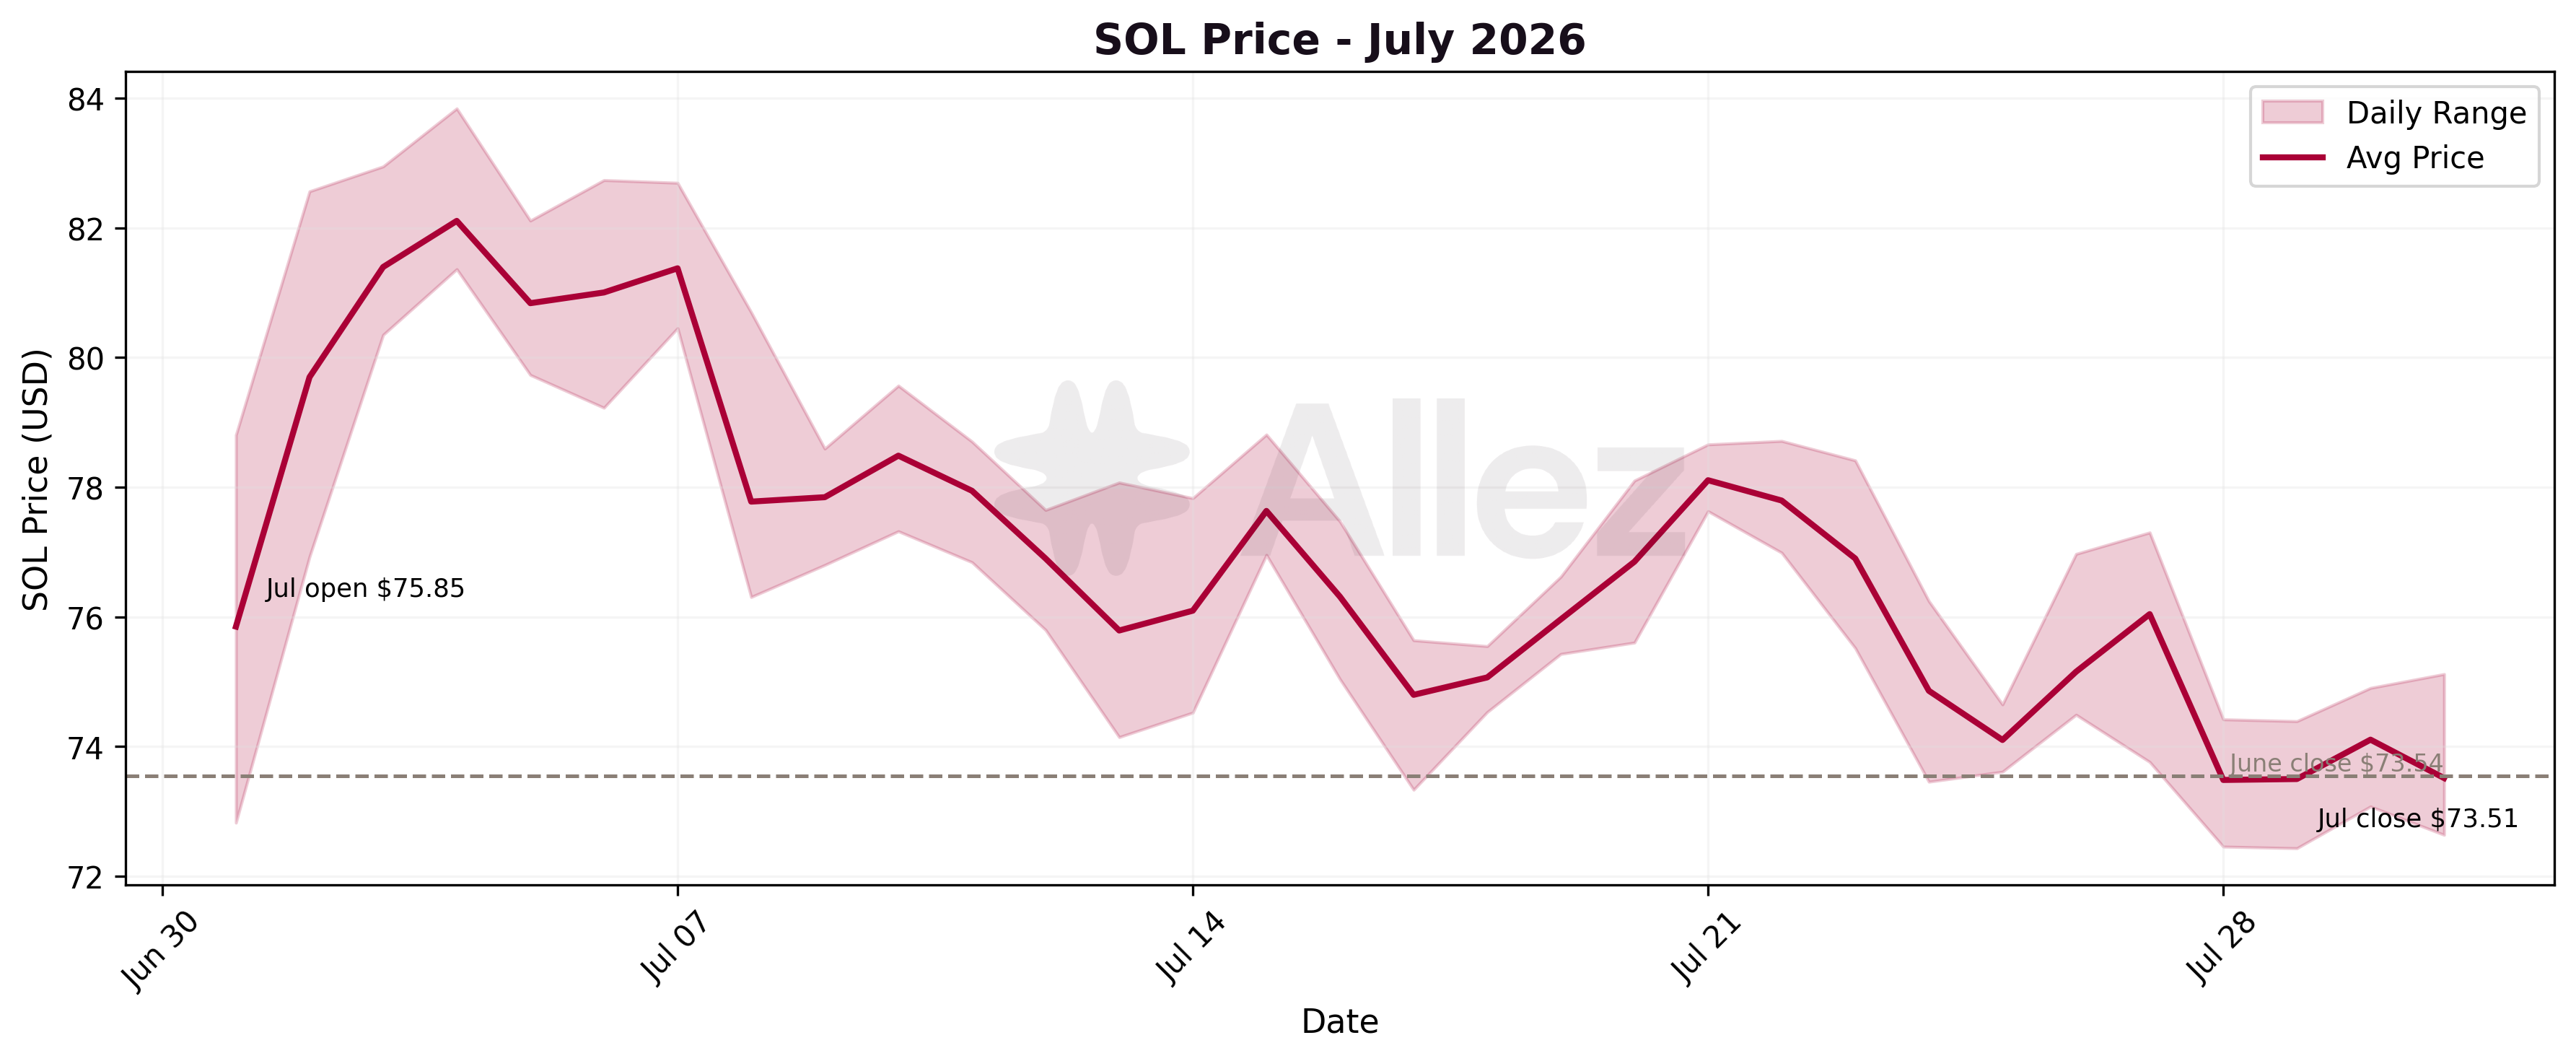
Close-to-close SOL was flat month-over-month: June closed at $73.54 and July closed at $73.51. The monthly path was not: SOL opened July higher at $75.85, ran to $83.84 mid-month, then gave back to close 3.1% below its July open. Therefore the 9-11% decline in SOL and LST supply is driven primarily by token outflows. The asset-level flows below show a $27.4M SOL outflow, which broadly accounts for the SOL-category decline.
Kamino Ecosystem Updates:
-
OnRe (ONyc) market: grew from about $165M to $208M in supply (Kamino, July 23).
-
**Steakhouse USDG vault: **reached $33.9M in deposits over the month, fed by the new PAXG market it curates (below).
-
PAXG market launch, a gold-backed credit market curated by Steakhouse: users supply PAXG (tokenized gold issued by Paxos, one token per troy ounce of London Good Delivery gold) as collateral and borrow USDG (Steakhouse, July 28).
-
HYPE market launched (July 2), an isolated market curated by Allez Labs where users supply HYPE, Hyperliquid's native token bridged to Solana via Sunrise, as collateral and borrow USDC. It reached about $1.3M in supply by month-end (Kamino, July 2).
-
New RWA markets launched AUTO, backed by US near-prime auto loans (originated via Agora Data / Figure Forge, issued by HastraFi), went live July 29 with Multiply strategies (Kamino, July 29); and oTFY, an isolated trade-finance-yield market curated by RockawayX, launched July 31 (Kamino, July 31).
2. Macro View: Liquidity by Category
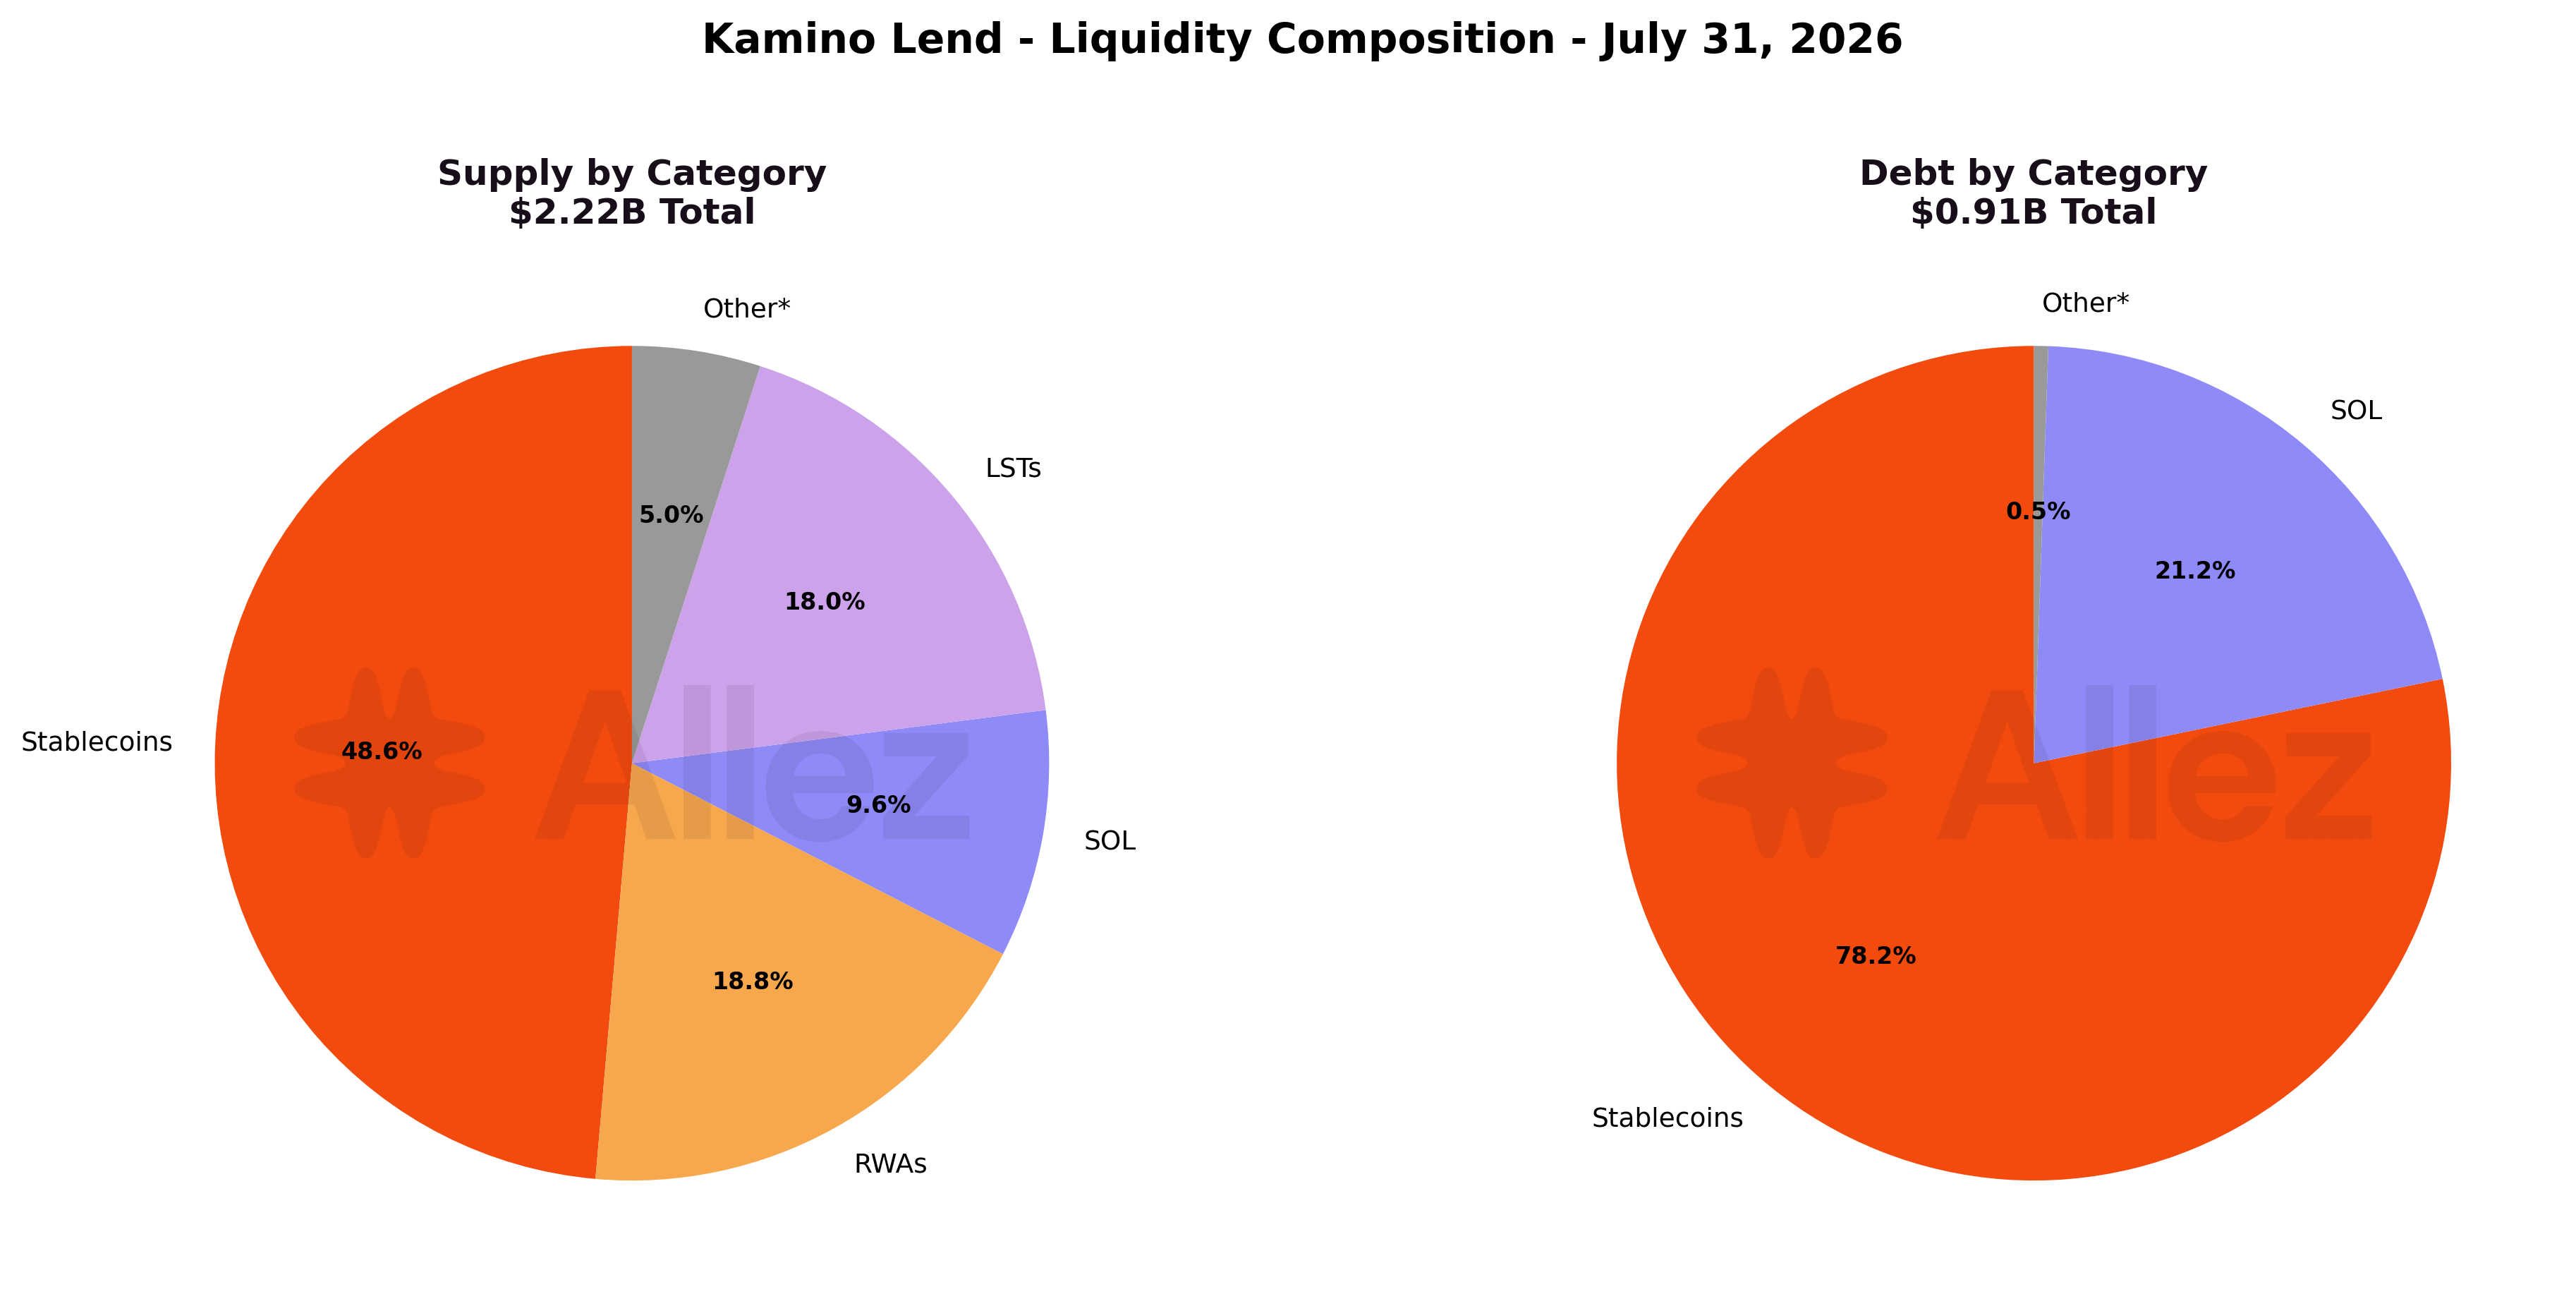
Stablecoins remained the largest category at 48.6% of supply. The USD-denominated categories (Stablecoins plus RWAs) together account for two-thirds of protocol supply; the SOL and LSTs together hold about a quarter.
| Category | Supply | Share | Supply MoM | Debt MoM |
|---|---|---|---|---|
| Stablecoins | $1,078.7M | 48.6% | -1.5% | -1.5% |
| RWAs | $418.1M | 18.8% | +1.0% | -26.1% |
| LSTs | $399.3M | 18.0% | -9.4% | +6.5% |
| SOL | $212.9M | 9.6% | -10.7% | -7.7% |
| BTC | $62.9M | 2.8% | +9.0% | -71.3% |
| Other | $47.6M | 2.1% | +1.0% | -69.6% |
RWA and LST debt are under $3M each, so their large percentage debt swings are not material to the protocol's risk profile.
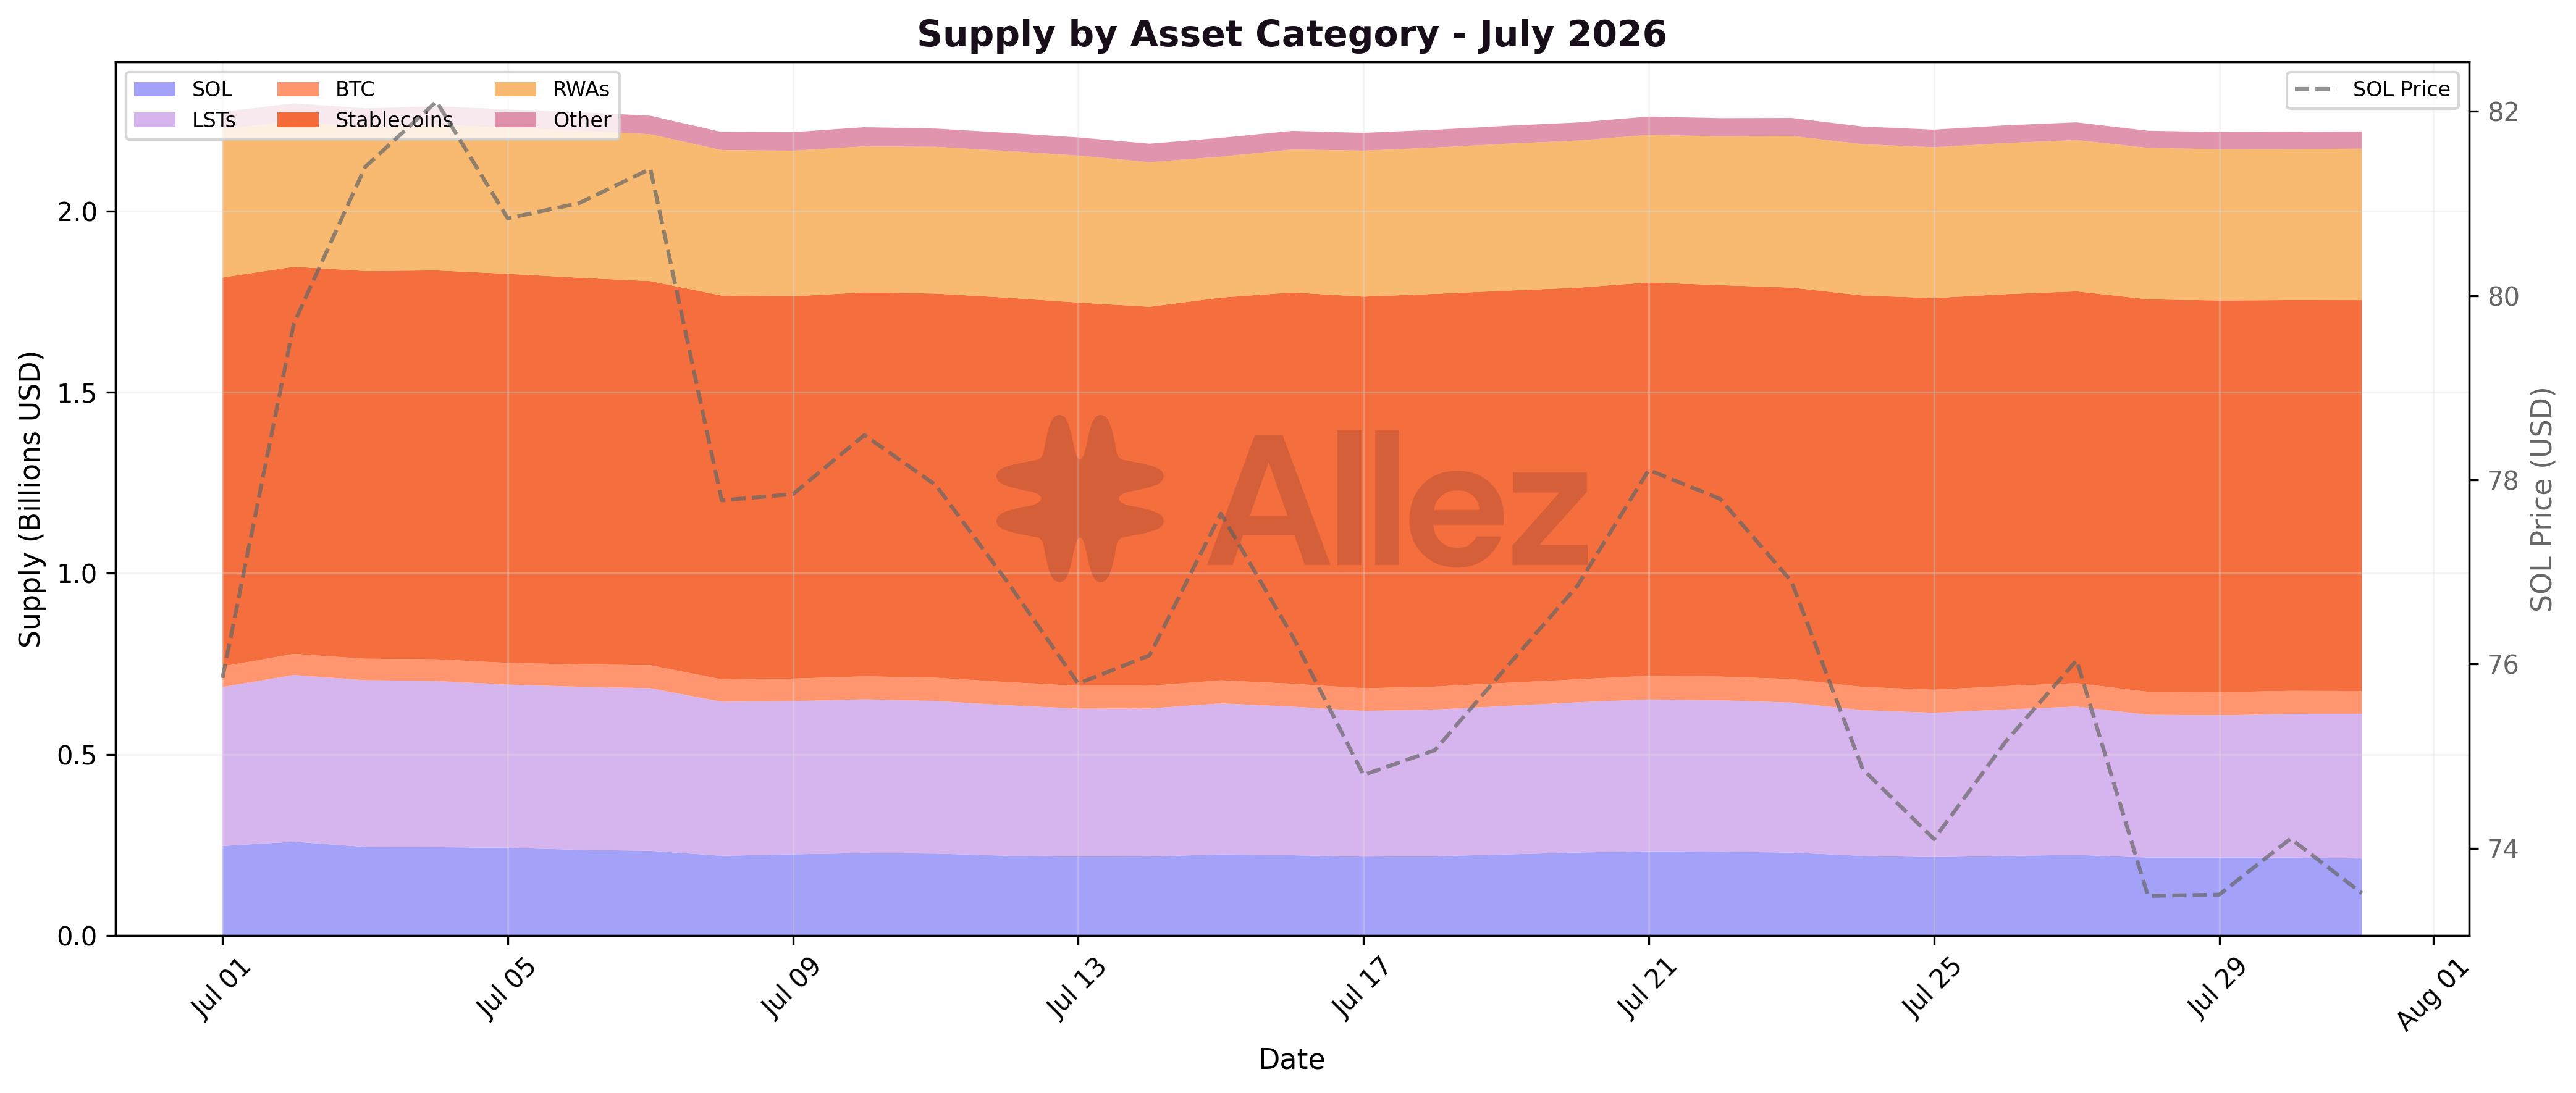
Daily composition held through the month. The softening in the SOL and LST bands tracks the mid-month SOL price dip and steady LST deposit outflows, spread across days.
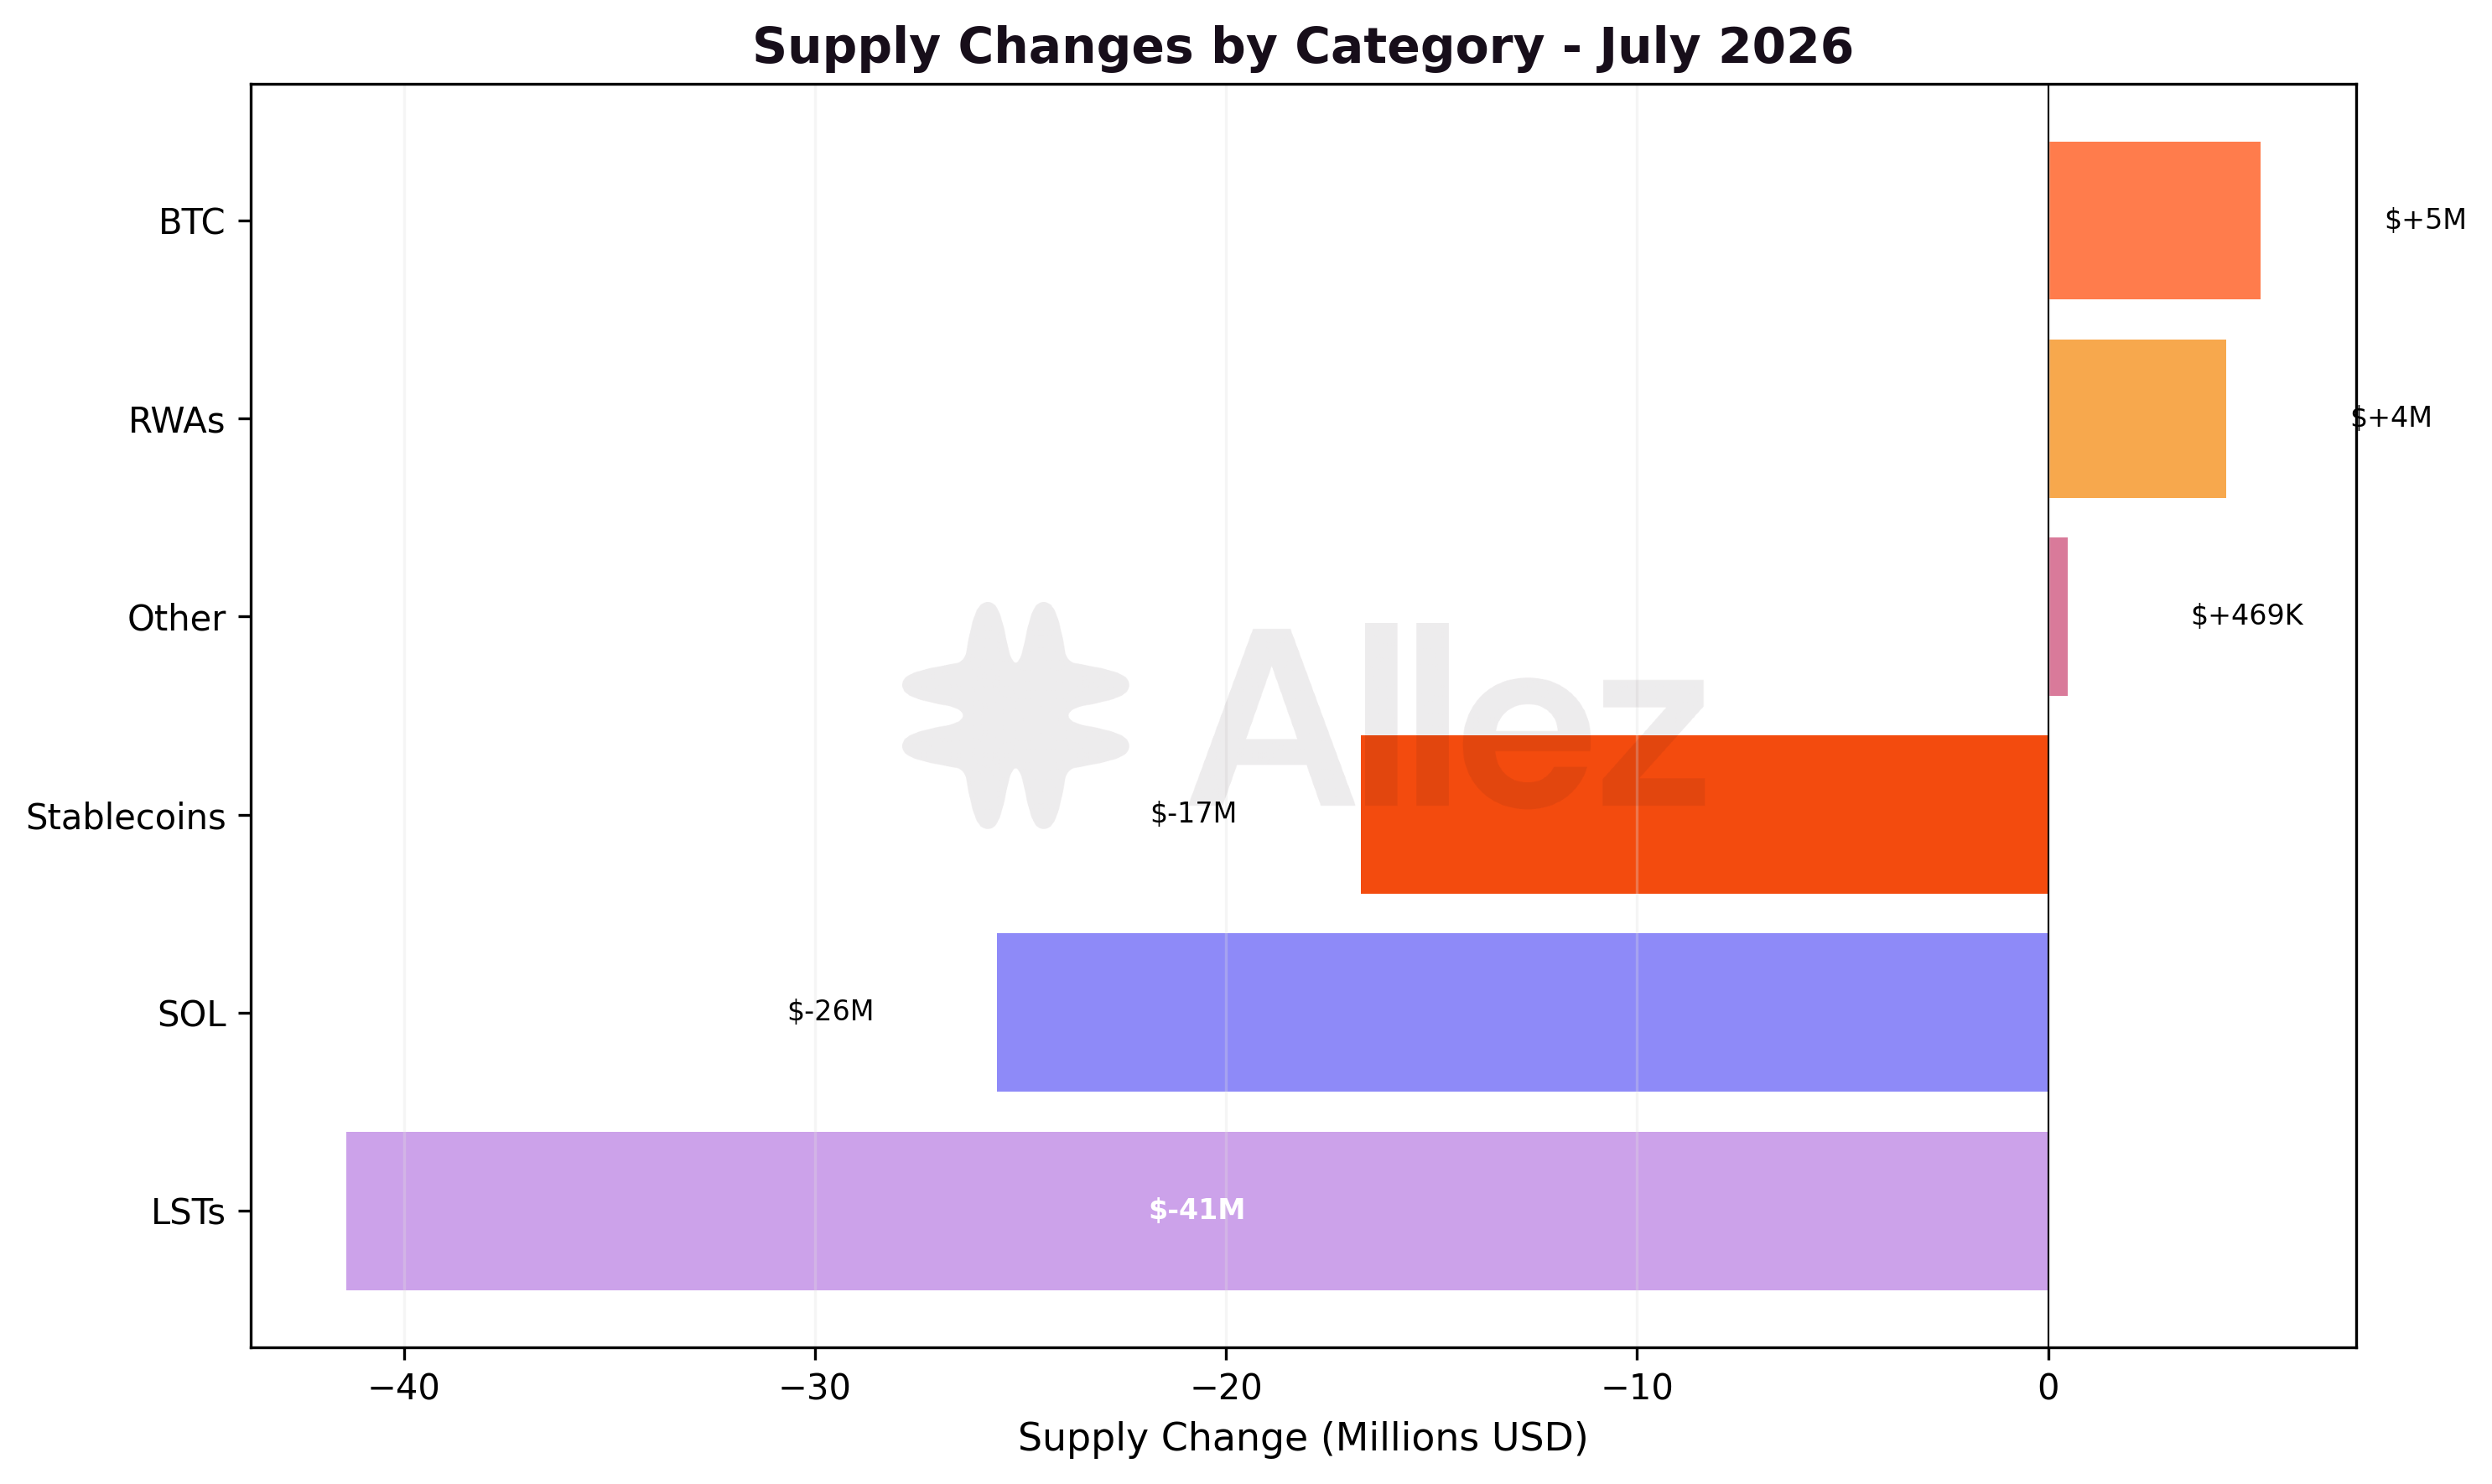
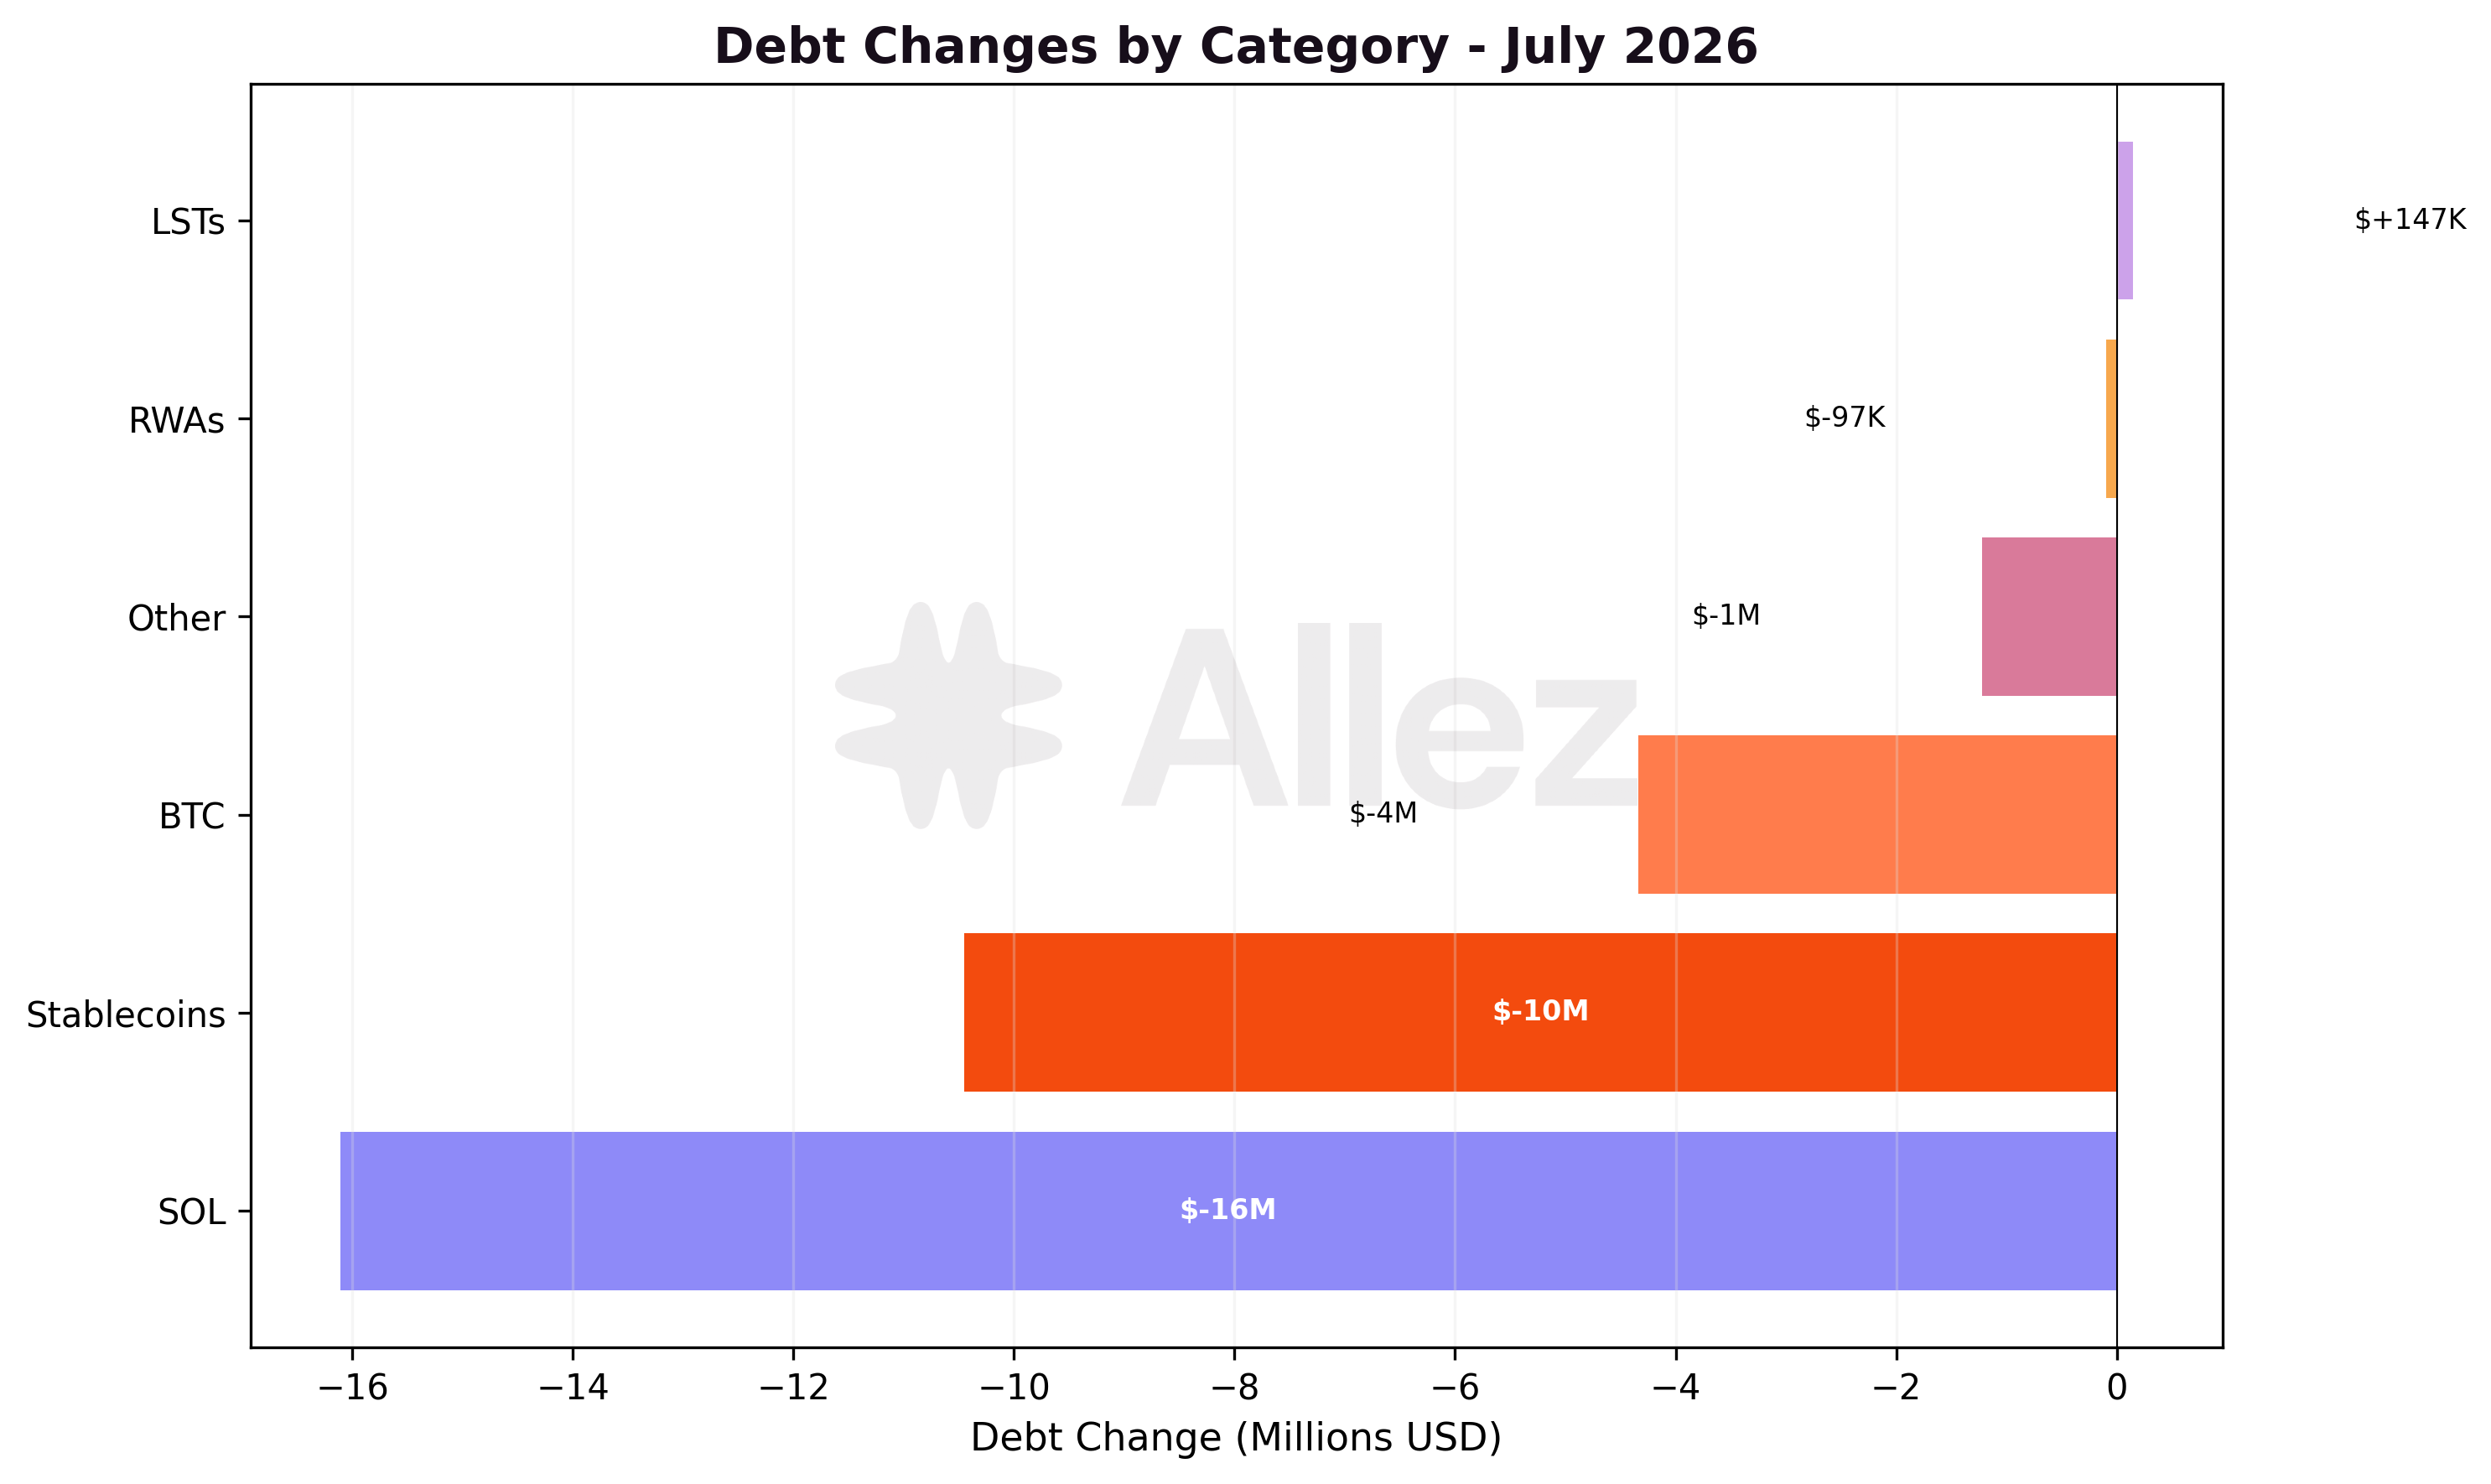
Only LSTs (-9.4%) and SOL (-10.7%) moved materially. Both track SOL price action and both see deposit outflows (see the asset-level flows below). RWAs edged up 1.0%, supported by inflows into ONyc and PST that offset a large PRIME outflow. Stablecoins were nearly flat at -1.5%.
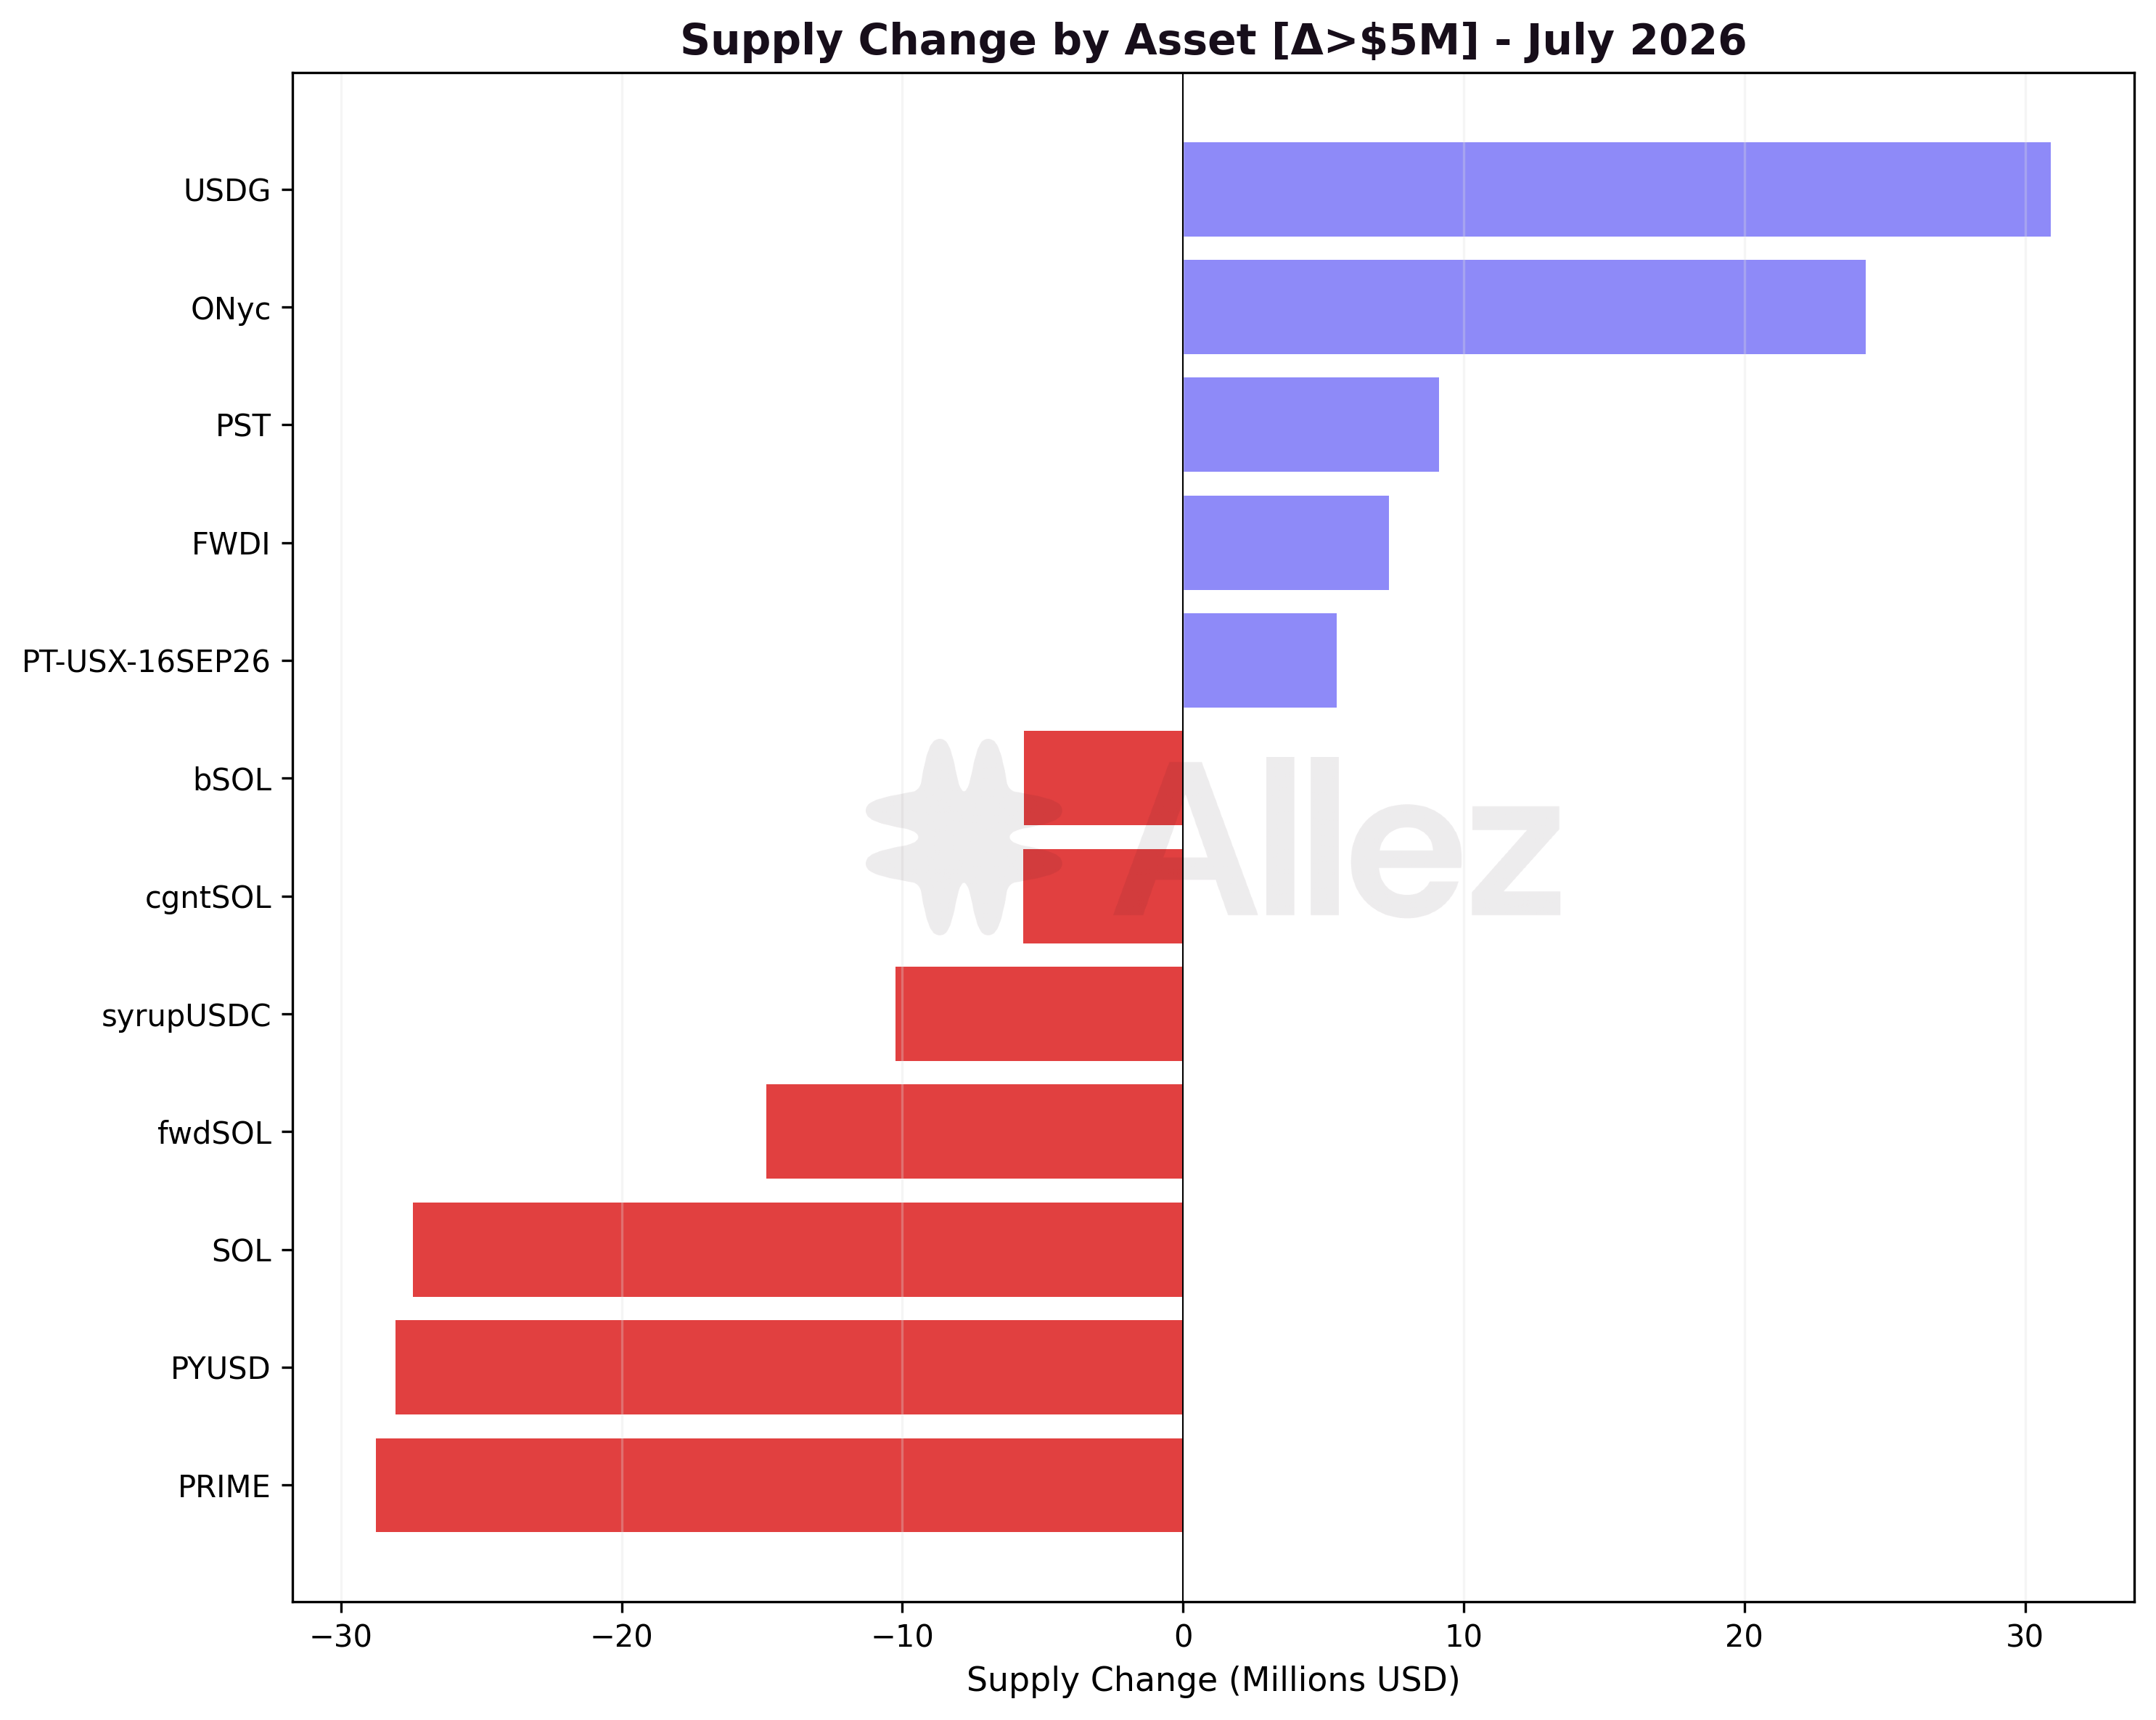
Note: Per-asset figures reflect token quantity changes valued at current prices, isolating user deposit/withdrawal behavior.
Major Inflows: USDG (+$30.9M), ONyc (+$24.3M), PST (+$9.1M), FWDI (+$7.3M), PT-USX-16SEP26 (+$5.5M).
Major Outflows: PRIME (-$28.7M), PYUSD (-$28.0M), SOL (-$27.4M), fwdSOL (-$14.8M), syrupUSDC (-$10.2M).
Inflows were led by USDG and the RWA tokens ONyc and PST, consistent with the OnRe and Huma markets' growth (Huma +88%). Outflows concentrated in PRIME, PYUSD, native SOL, an LST (fwdSOL), and the Maple credit token syrupUSDC. Prime and Maple market contraction runs through several of these.
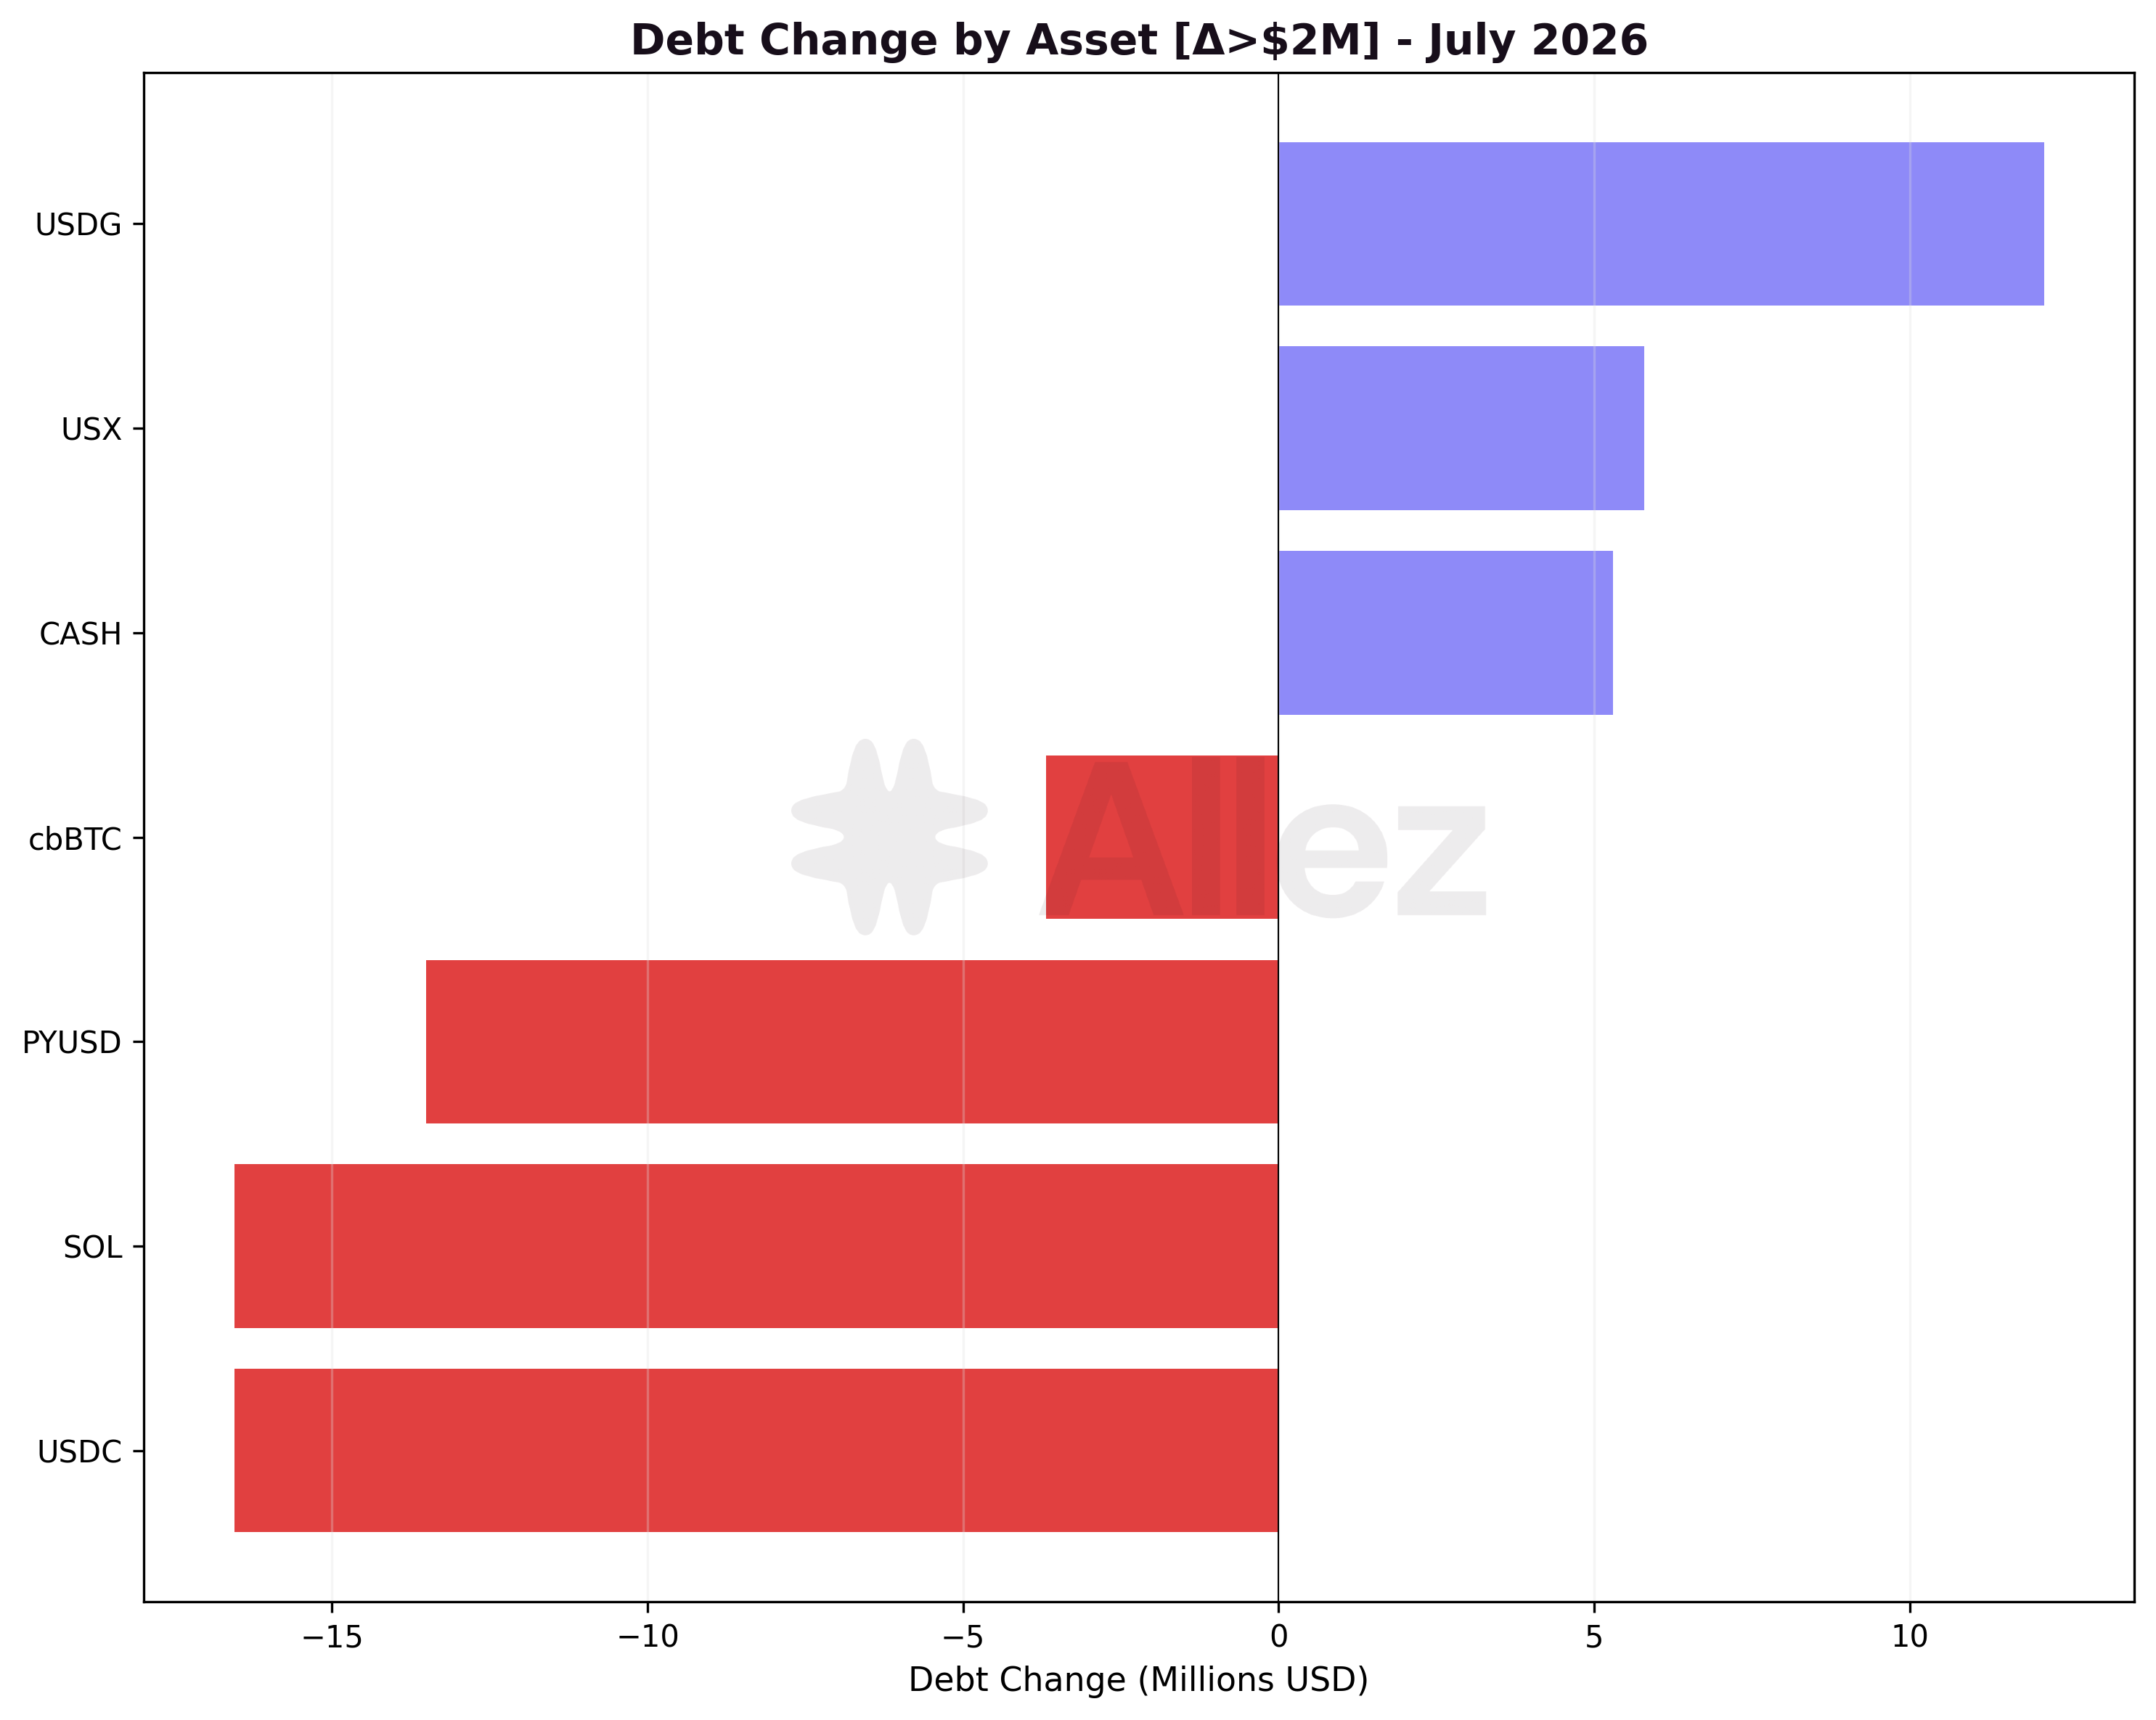
Borrowing rose in USDG (+$12.1M), USX (+$5.8M) and CASH (+$5.3M), and fell in USDC (-$16.6M), SOL (-$16.5M) and PYUSD (-$13.5M). Net stablecoin borrowing barely moved once the USDG, USX and CASH gains are set against each other.
3. Risk and Liquidations
Distance to Liquidation (DTL): Correlated vs Uncorrelated Positions
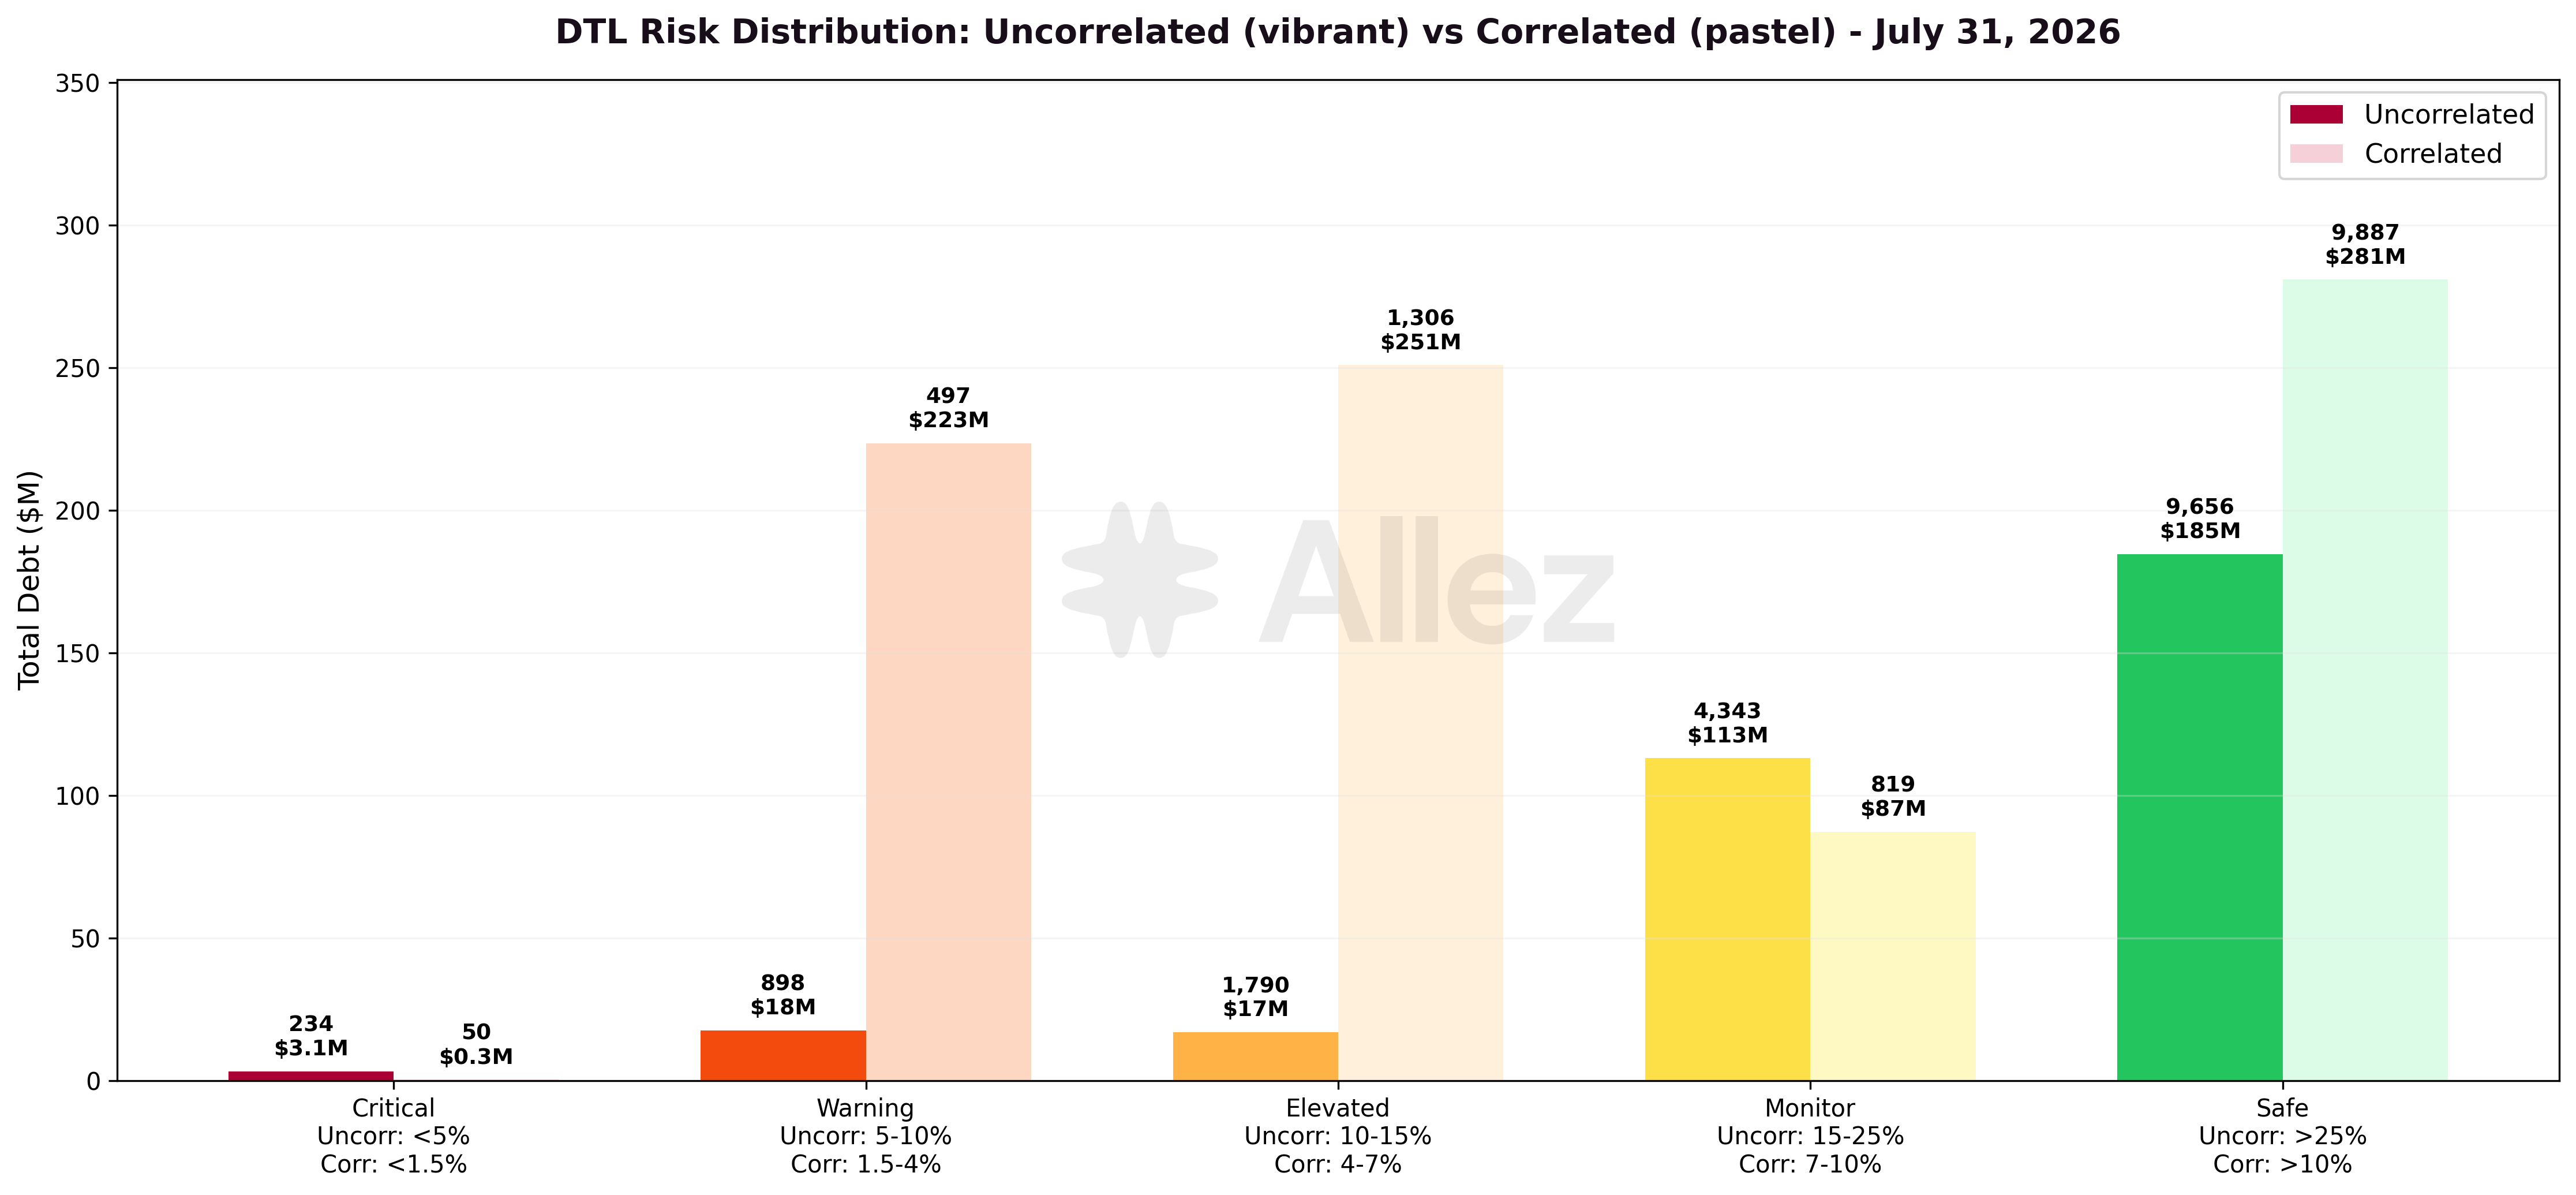
Positions are split into uncorrelated pairs, where collateral and debt that move independently (SOL collateral against USDC debt) and correlated pairs where they move together (an LST against SOL, or a stablecoin against a stablecoin). Correlated pairs can safely run much closer to their liquidation threshold, so they are measured against a tighter set of tier bands.
Uncorrelated positions (month-end):
| Tier | DTL range | Borrow value | June | MoM | Share | Positions |
|---|---|---|---|---|---|---|
| Critical | < 5% | $3.14M | $7.45M | -57.9% | 0.9% | 234 |
| Warning | 5-10% | $17.62M | $8.89M | +98.2% | 5.3% | 898 |
| Elevated | 10-15% | $16.92M | $14.78M | +14.5% | 5.0% | 1,790 |
| Monitor | 15-25% | $113.03M | $68.40M | +65.2% | 33.7% | 4,343 |
| Safe | > 25% | $184.66M | $225.90M | -18.3% | 55.1% | 9,656 |
Correlated positions (month-end):
| Tier | DTL range | Borrow value | June | MoM | Share | Positions |
|---|---|---|---|---|---|---|
| Critical | < 1.5% | $0.26M | $0.19M | +36.8% | under 0.1% | 50 |
| Warning | 1.5-4% | $223.47M | $227.70M | -1.9% | 26.5% | 497 |
| Elevated | 4-7% | $250.91M | $298.60M | -16.0% | 29.8% | 1,306 |
| Monitor | 7-10% | $87.19M | $107.90M | -19.2% | 10.3% | 819 |
| Safe | > 10% | $280.87M | $253.70M | +10.7% | 33.3% | 9,887 |
The uncorrelated book sits well clear of trouble: 89% of its value is in the Monitor and Safe tiers, and only 0.9% is within 5% of liquidation, the $3.14M of borrow value held by the 234 positions in the Critical tier. These are mostly SOL and cbBTC collateral against stablecoins (USDC, USDT, USDG) that could be easily liquidated. Critical-tier value more than halved over June, from $7.45M to $3.14M (-57.9%). At the same time the middle of the distribution thickened: Warning-tier nearly doubled to $17.62M and value shifted out of the Safe-tier (-18.3%) into Monitor (+65.2%).
The correlated book carries more value in its Warning and Elevated tiers, typical of tight-band markets. LST-against-SOL and stablecoin-against-stablecoin positions run 1.5-7% distances. As both legs move together, they are much less exposed to volatility than uncorrelated pairs. The distribution was stable month-over-month, with a modest shift from Elevated (-16.0%) toward Safe (+10.7%). Critical-tier correlated value is negligible at $0.26M.
Liquidation summary (July):
| Metric | July | June | MoM |
|---|---|---|---|
| Events | 610 | 48,905 | -98.8% |
| Collateral seized | $0.39M | $5.77M | -93.3% |
| Debt repaid | $0.38M | - | - |
| Average size | $636 | $118 | +438.7% |
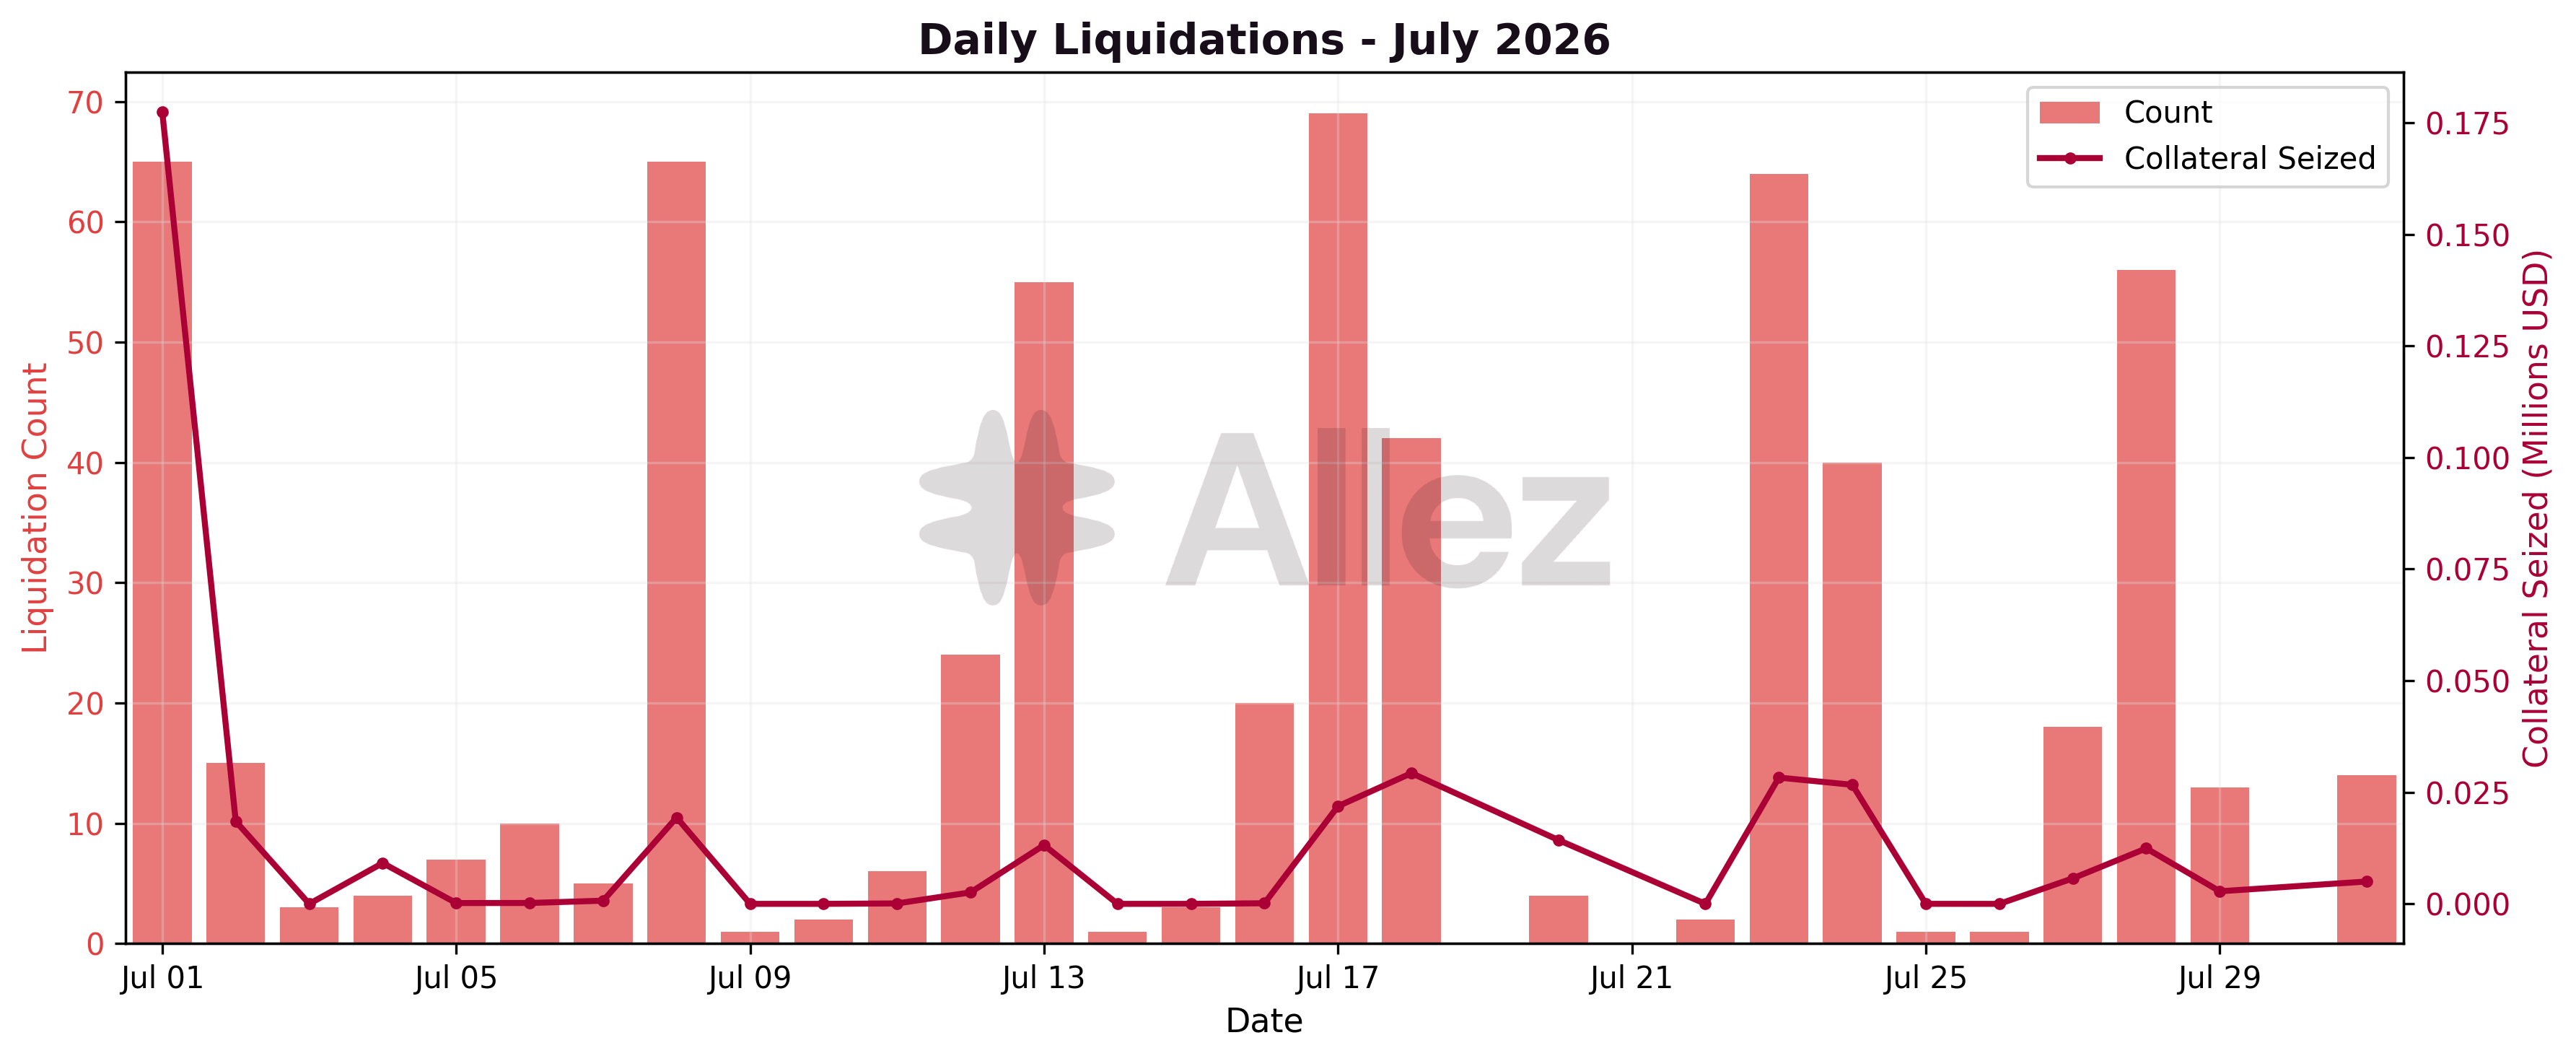
Few liquidations occurred, and total collateral seized was $0.39M. June contained a high-volume, low-value episode of many sub-$1K liquidations, which is also why average size rose from $118 to $636 in a quieter month.
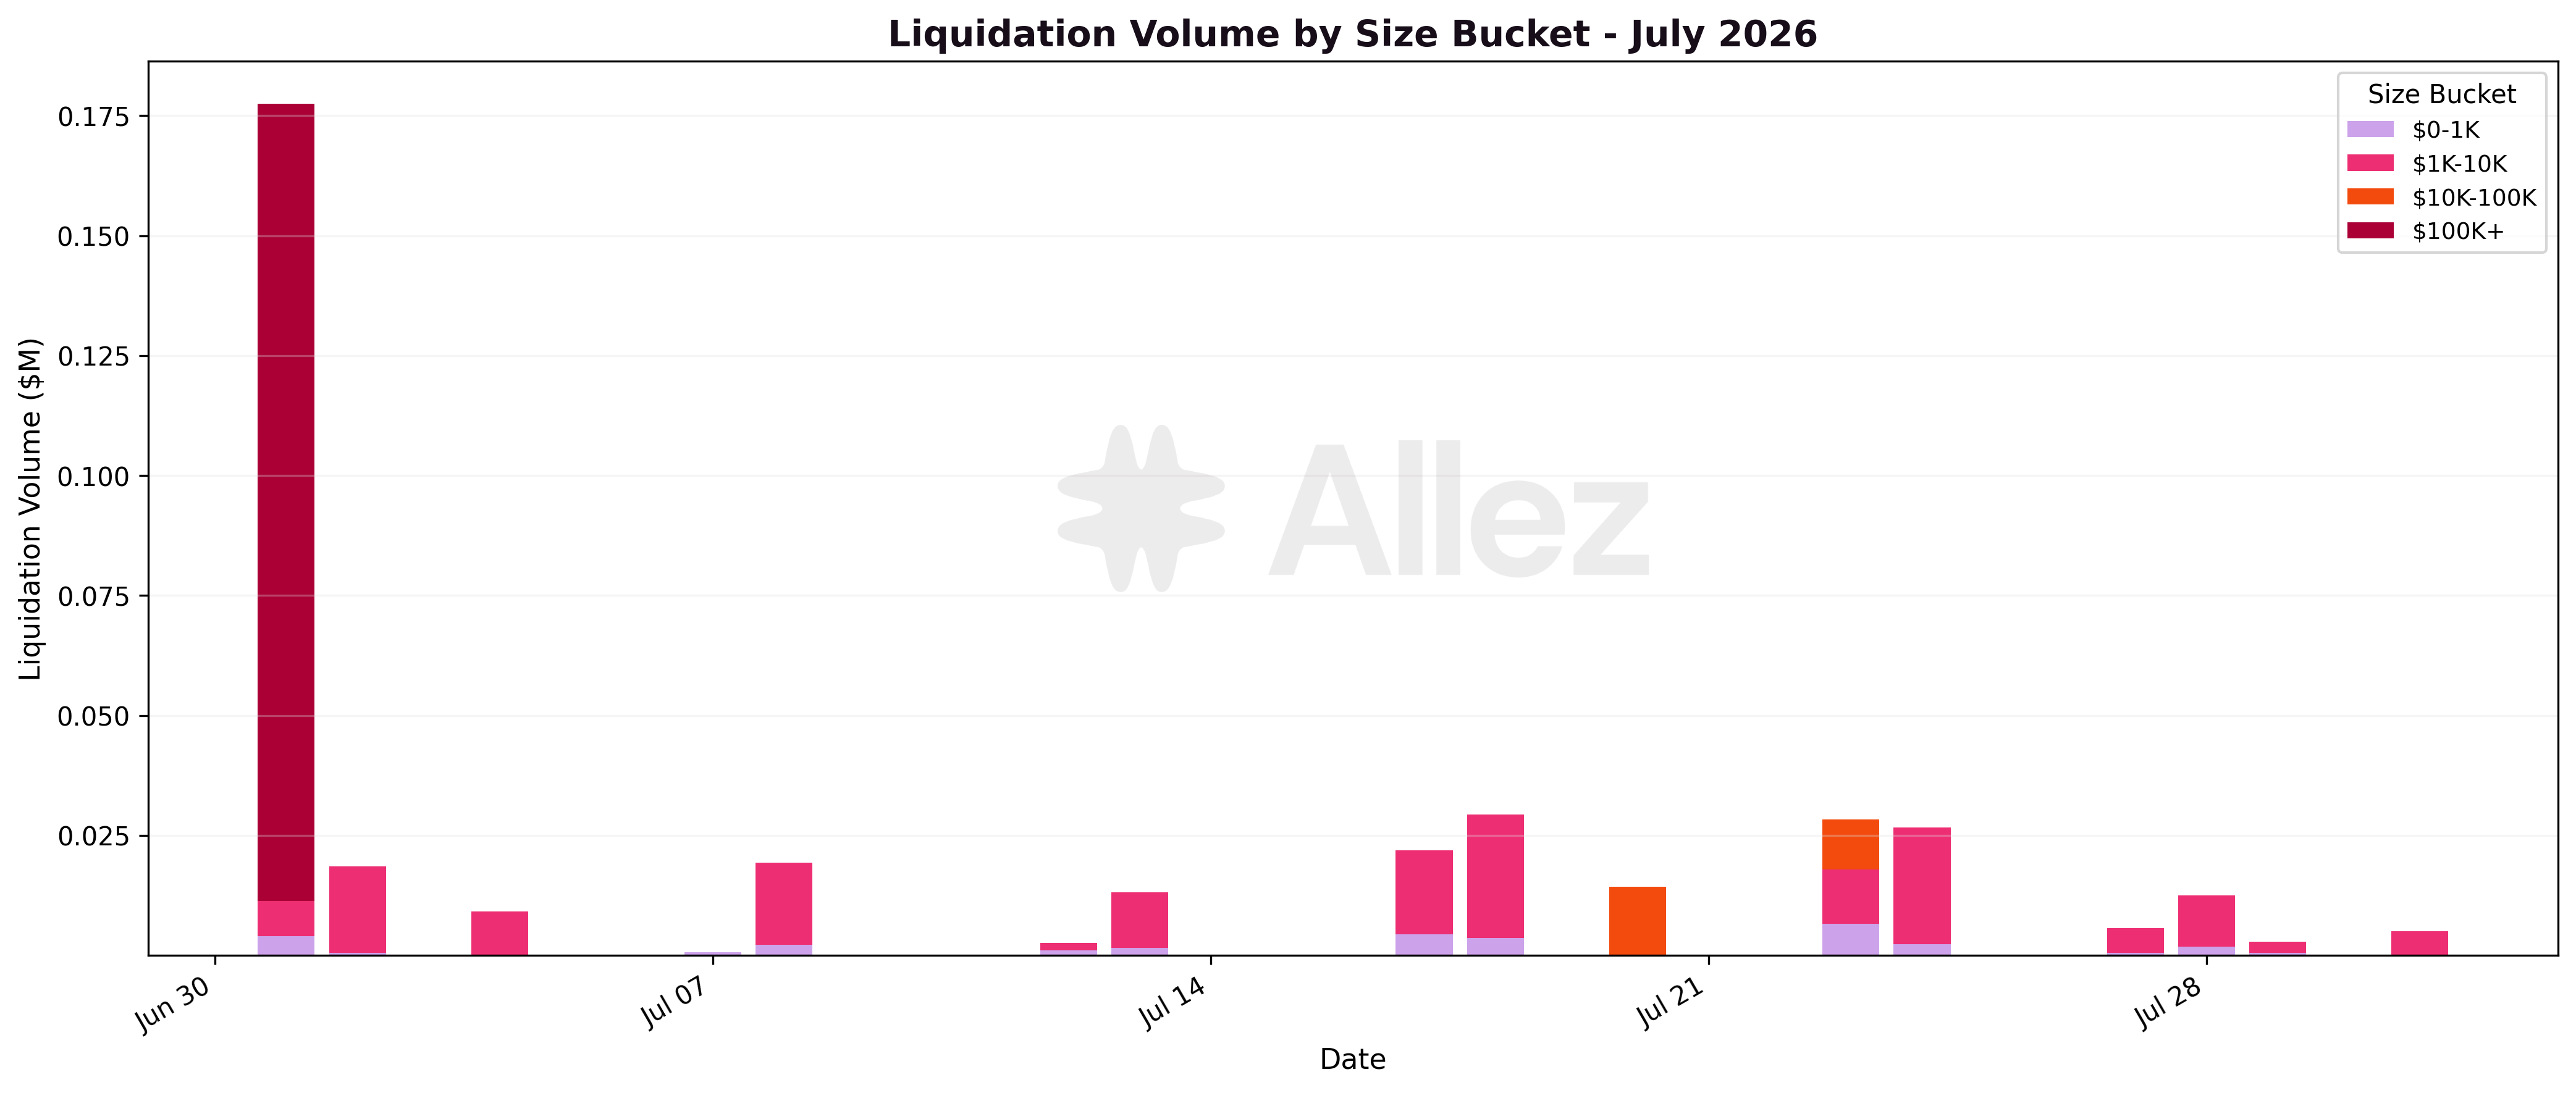
The largest single event was a $166K xBTC-collateral position liquidated against USDC. The rest was small SOL/USDC, BONK/USDC, cbBTC/USDC and TSLAx/USDC positions, none individually material.
| Size bucket | Volume | Events |
|---|---|---|
| $0-1K | $30.6K | 544 |
| $1K-10K | $166.5K | 63 |
| $10K-100K | $24.7K | 2 |
| $100K+ | $166.2K | 1 |
The bucket totals sum to $0.39M, matching the month's total collateral seized.
Stress Testing:
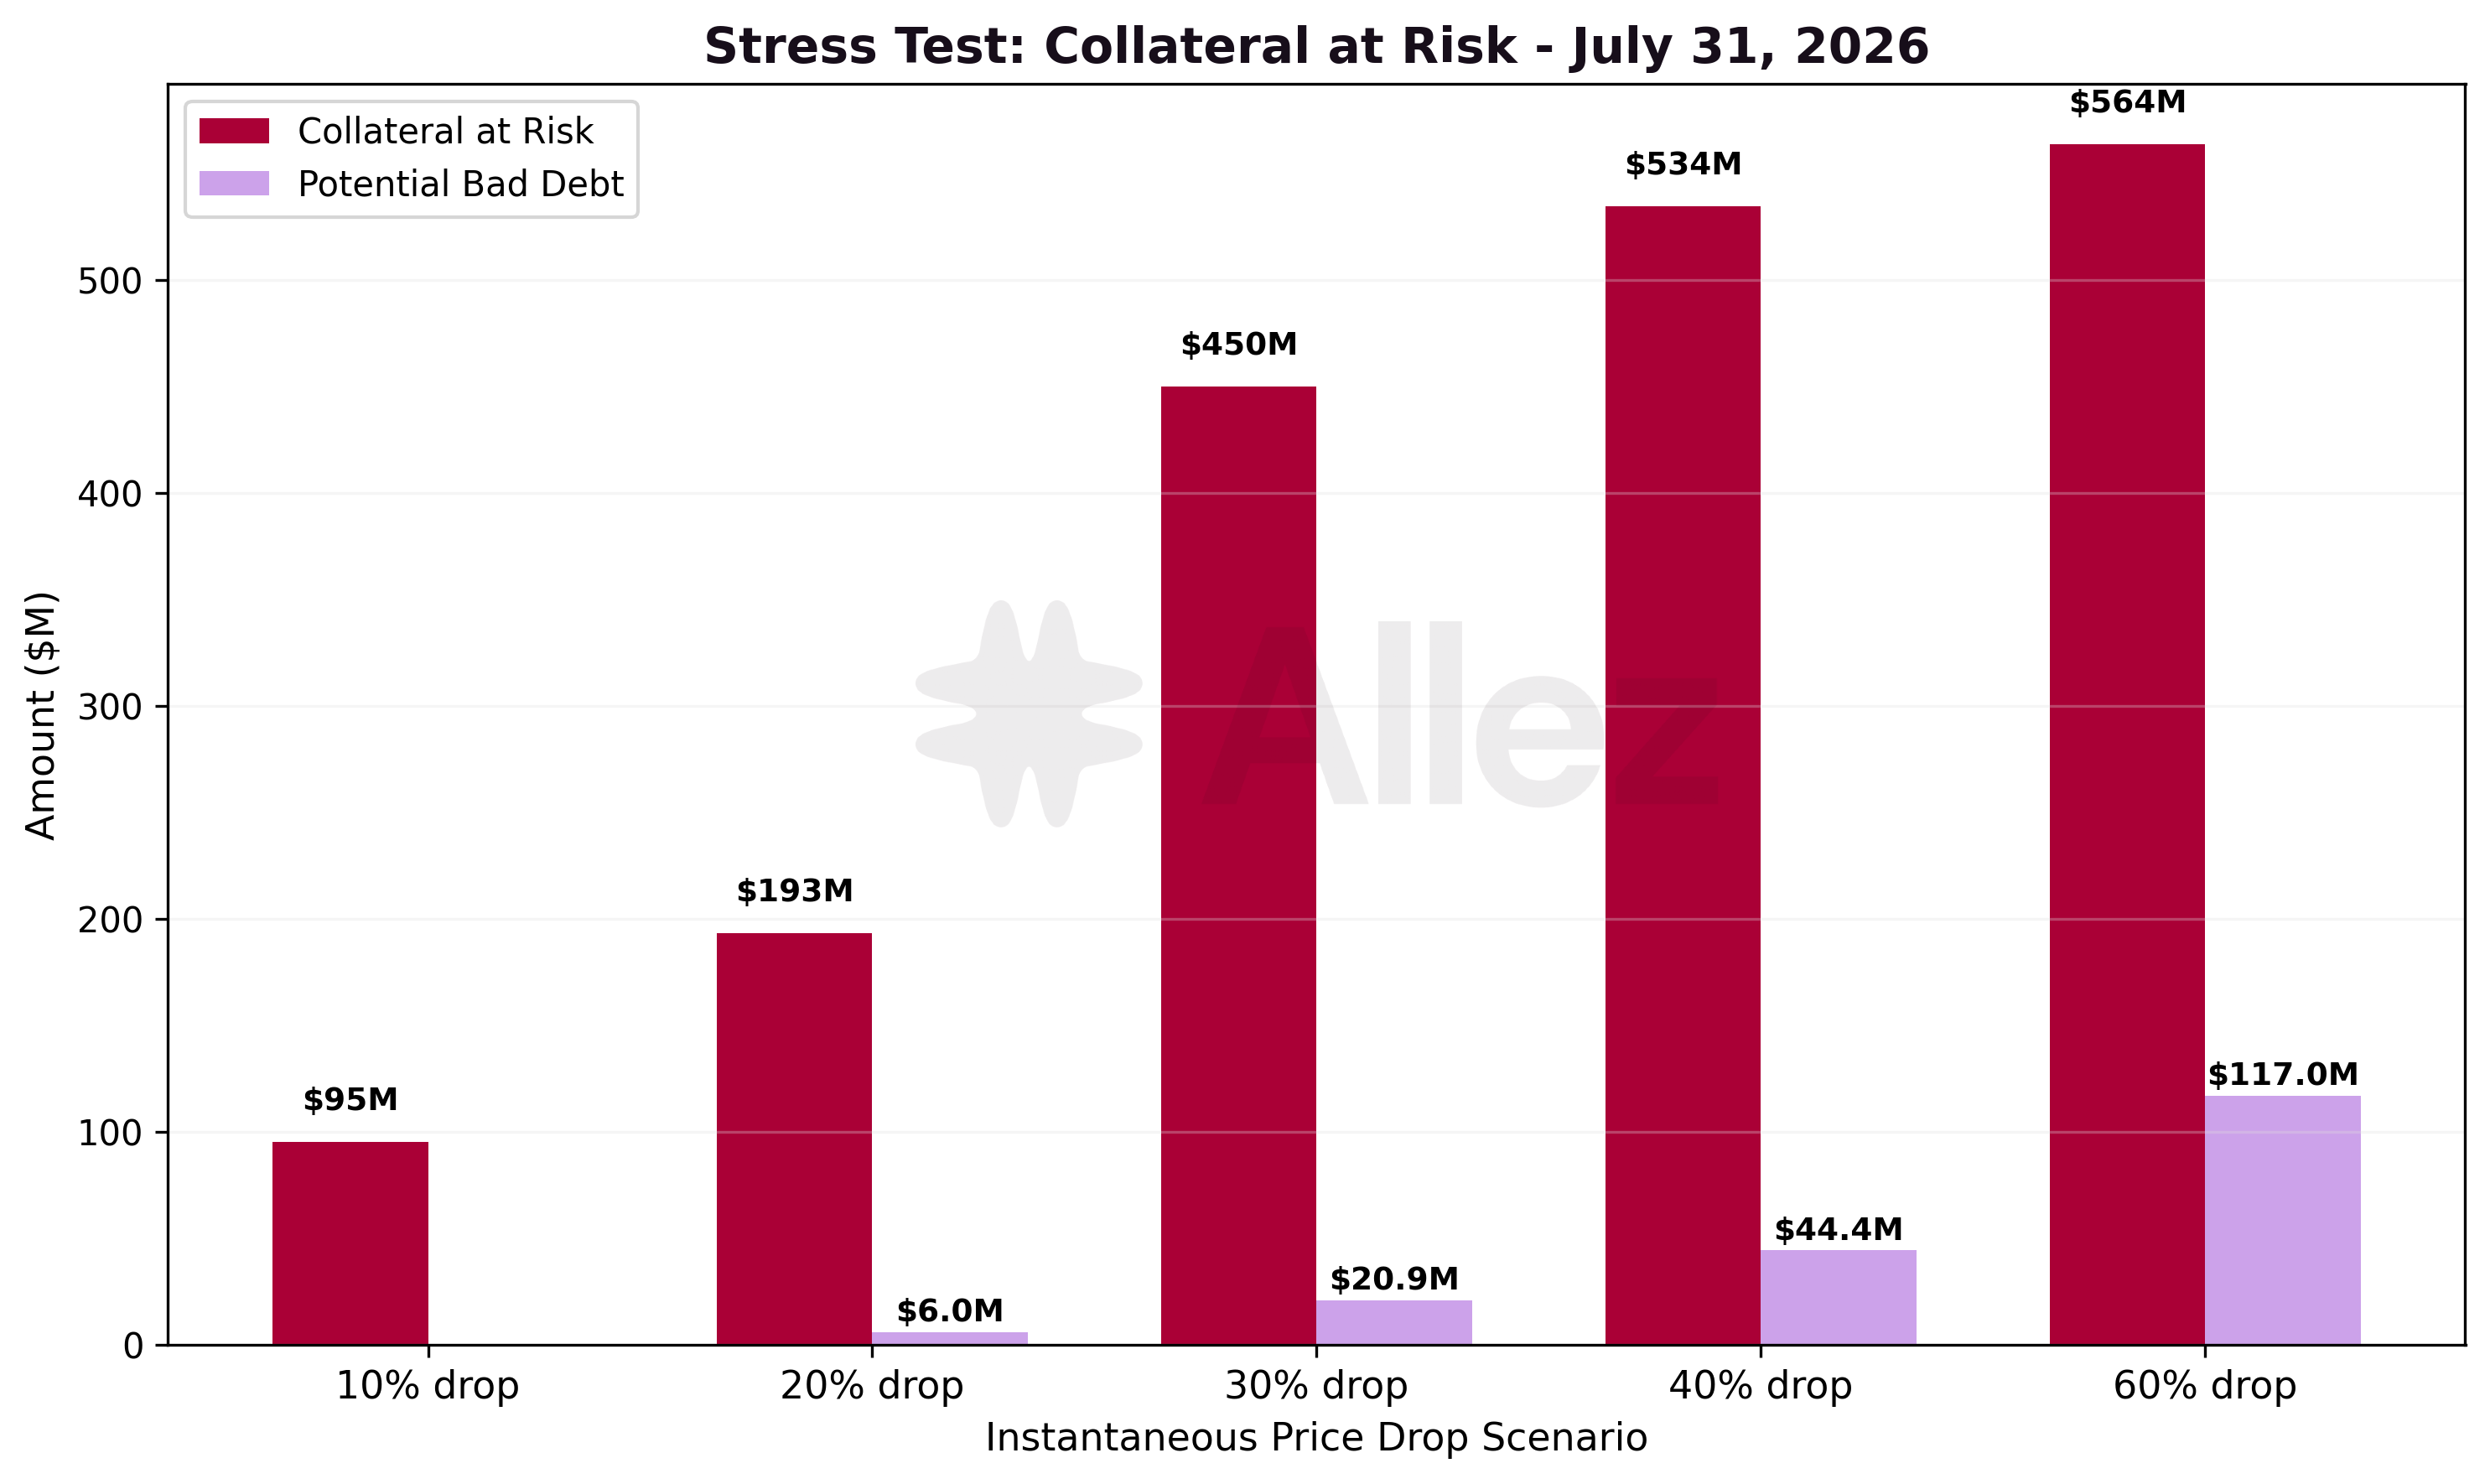
The stress test applies uniform price shocks to all collateral and measures cumulative collateral at risk and theoretical bad debt (per-obligation first-liquidation scenario, carried forward).
| Price shock | Collateral at risk | June | MoM | Potential bad debt | Positions liquidated |
|---|---|---|---|---|---|
| -10% | $95.3M | $163.2M | -41.6% | $0.0M | 575 |
| -20% | $193.4M | $266.3M | -27.4% | $6.0M | 4,030 |
| -30% | $449.9M | $478.6M | -6.0% | $20.9M | 9,101 |
| -40% | $534.4M | $556.0M | -3.9% | $44.4M | 11,280 |
| -60% | $563.8M | $596.5M | -5.5% | $117.0M | 12,971 |
Against June, collateral at risk fell at every shock, most at the shallow -10% level (-41.6%) and least at the deeper end (-3.9% at -40%). The shallow-end drop tracks the high-LTV positions exiting during June's deleveraging, leaving a smaller near-the-money pool, while the deep-end figures scale with overall protocol size.
Liquidation Cascade and On-Chain Exit Depth (SOL)
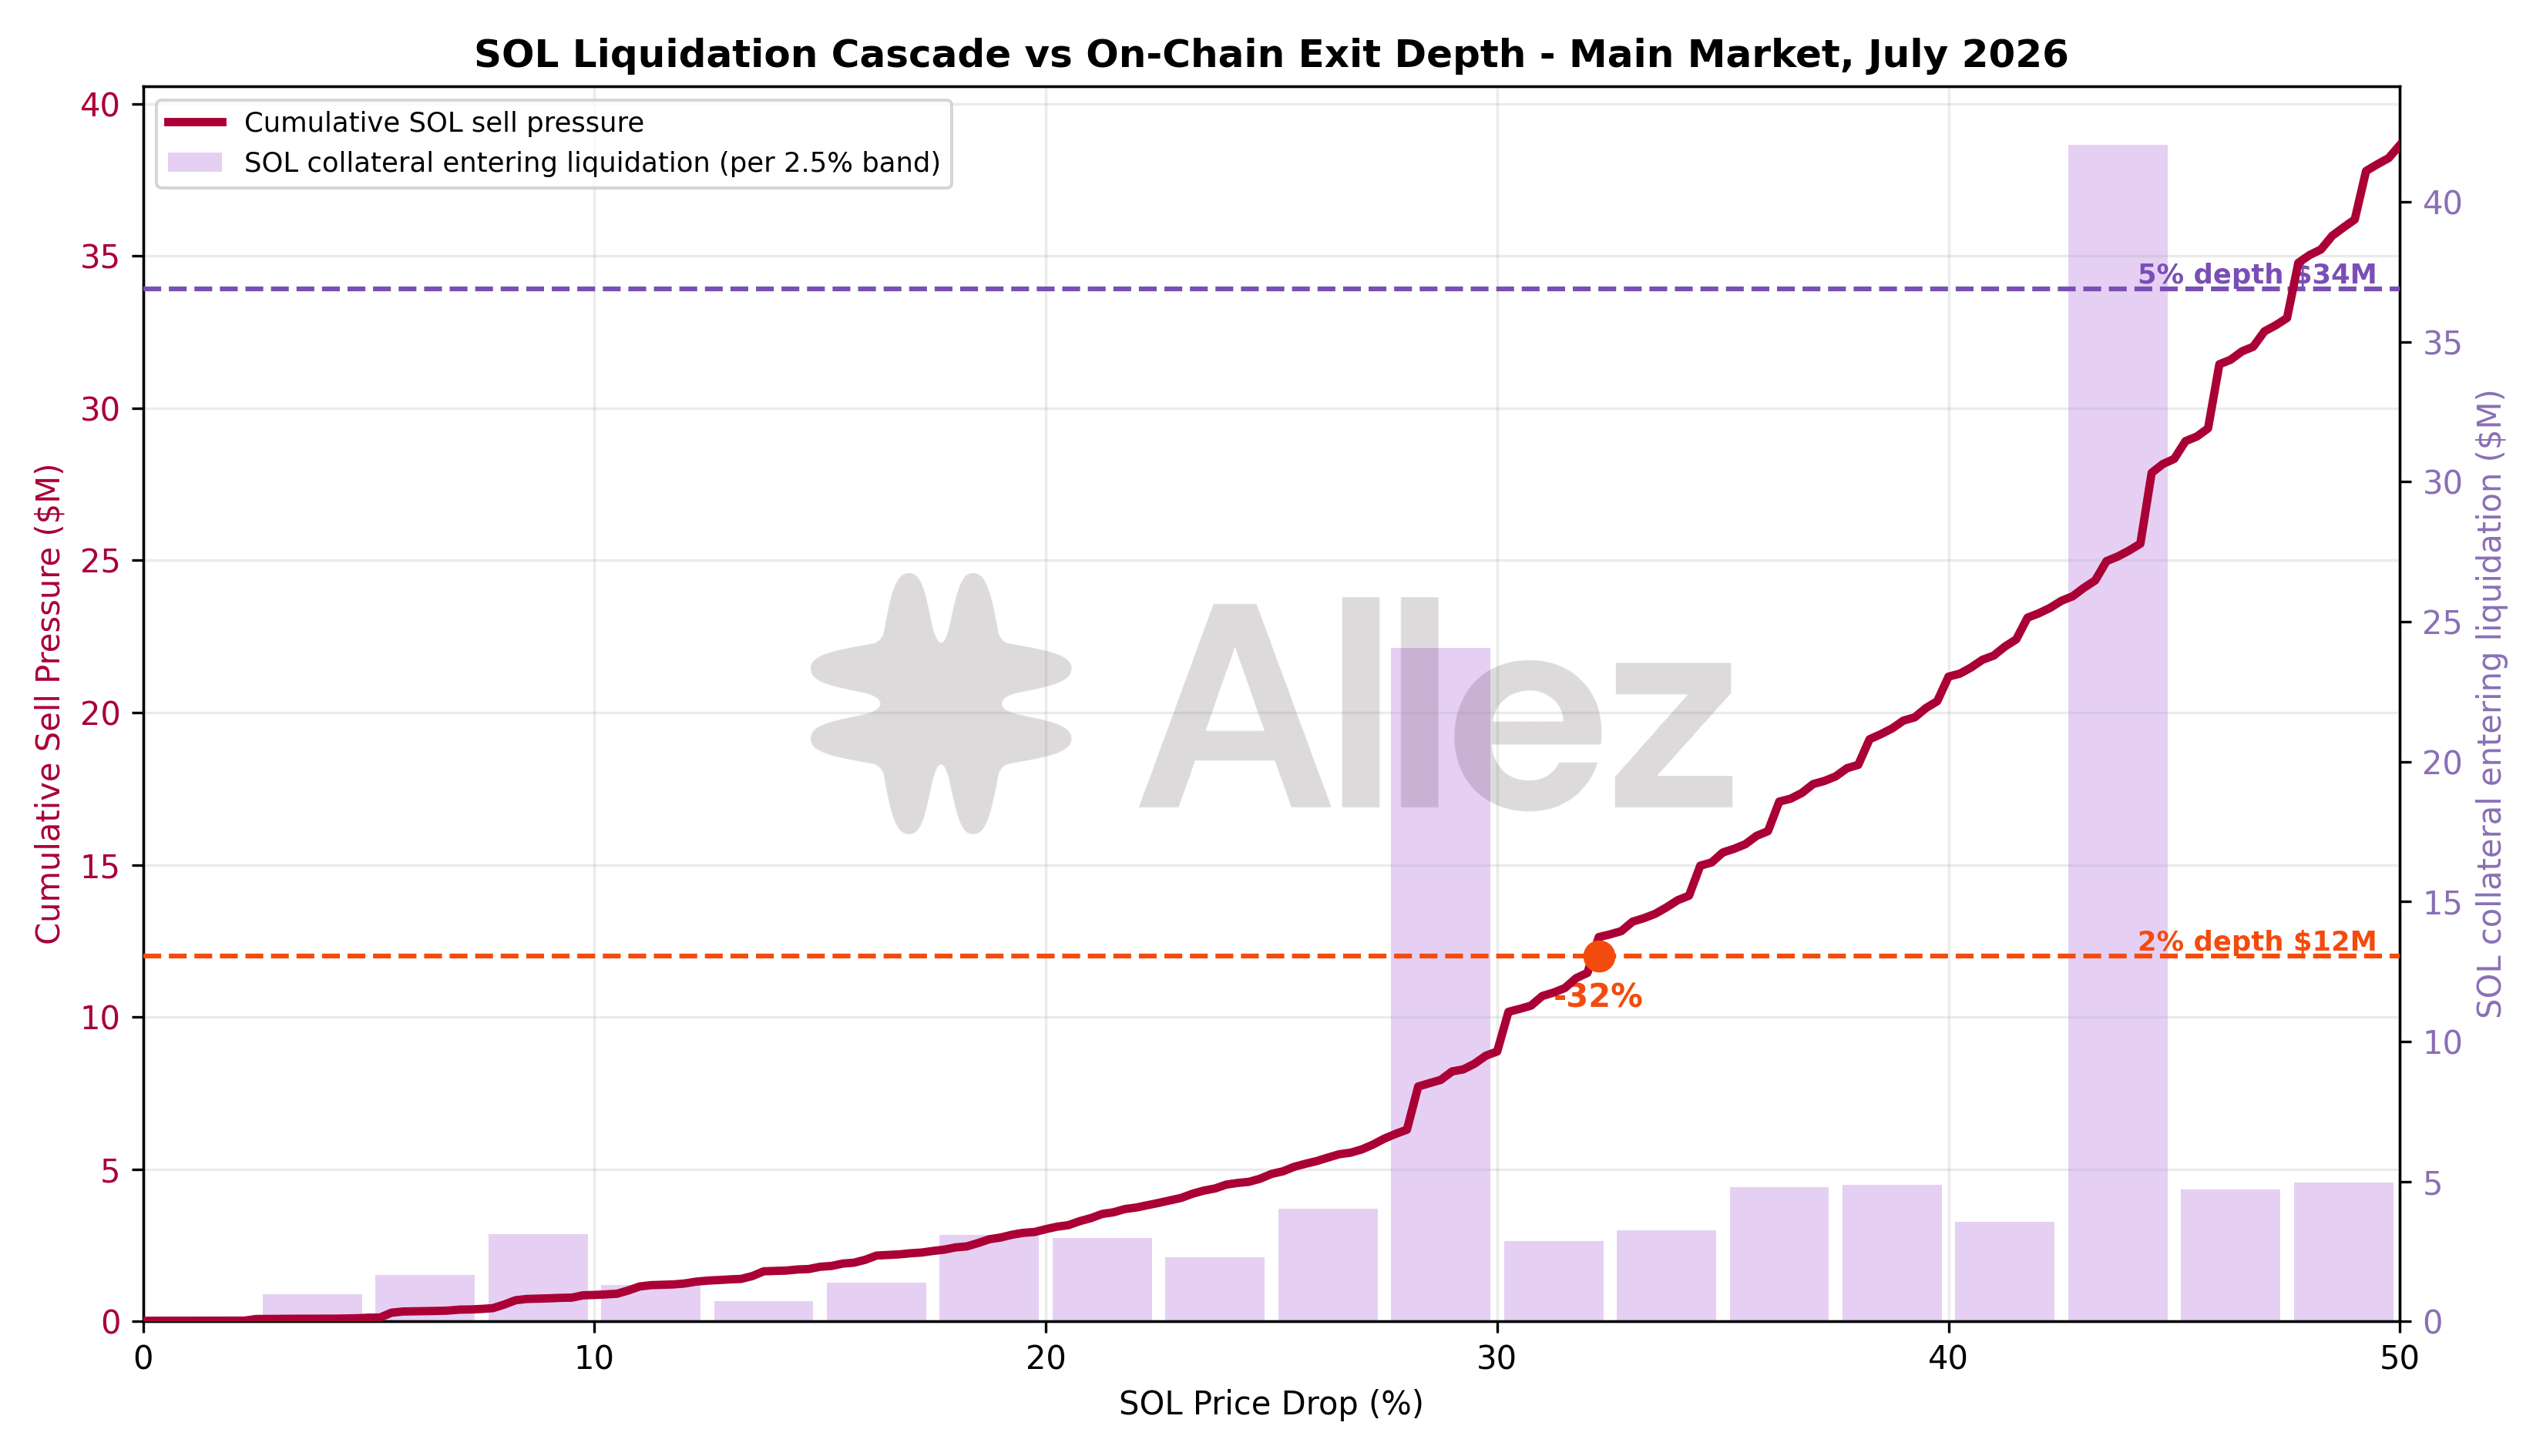
This stress test quantifies collateral that crosses a liquidation threshold. It does not say how much of that reaches the market. This liquidation cascade model does, for SOL, the protocol's largest price-sensitive collateral. It models liquidators seizing and selling in partial waves, and compares results against the depth available to exit SOL into dollars on-chain.
The model steps the SOL price down in 0.25% increments and, at each level, liquidates each position in 10% close-factor waves until it returns below its liquidation threshold, carrying residual collateral and debt forward. Scope is the $154.7M of SOL collateral held by Main-market positions that carry debt, as Main holds essentially all of the protocol's SOL collateral; debt is allocated pro-rata to each position's SOL share, giving $67.4M of SOL-backed debt. The 10% wave matches the Main market's configured close factor and the 10.0% realized on SOL liquidations over the past year (n=101,702). On exit depth: a 2% price impact absorbs $12.0M of SOL selling and a 5% impact absorbs $33.9M, with realizable output flattening near a $35.6M ceiling.
| SOL price drop | Cumulative SOL sell pressure | June | MoM | Price impact to clear | 2% depth coverage | 5% depth coverage |
|---|---|---|---|---|---|---|
| -10% | $0.9M | $0.3M | +200% | 0.09% | 13.9x | 39.1x |
| -20% | $3.0M | $1.6M | +88% | 0.31% | 4.0x | 11.2x |
| -30% | $8.9M | $6.8M | +30% | 1.31% | 1.4x | 3.8x |
| -40% | $21.2M | $20.3M | +4% | 2.75% | 0.6x | 1.6x |
| -50% | $38.6M | $39.8M | -3% | 12.54% | 0.3x | 0.9x |
At the realistic shock range, the sell pressure is negligible against on-chain depth: $0.9M at -10% and $3.0M at -20% clear at 0.09% and 0.31% price impact, covered roughly 14x and 4x by the 2% depth alone. At -30%, the cascade reaches $8.9M, clears at 1.3% price impact and is still covered 1.4x. It crosses the 2% depth around -32%. At -40% it reaches $21.2M, clearing at 2.75% price impact and covered 1.6x by the 5% depth, and stays within the roughly $35.6M realizable ceiling until about -48%. The curve stays flat through the shallow band and accelerates through the -30% to -45% range, where the bulk of the SOL collateral crosses its liquidation threshold.
Against June, the curve is higher at the shallow end and essentially unchanged deeper in. Sell pressure rises from $0.3M to $0.9M at -10% and from $1.6M to $3.0M at -20%: large in percentage terms, trivial in dollars against on-chain depth. By -40% the two months converge ($21.2M vs $20.3M). The shallow-end shift follows from June's deleveraging having cleared the deepest-buffered SOL positions, leaving a book that sits marginally closer to the money. Depth improved over the month (2% depth $10.6M to $12.0M, 5% depth $31.5M to $33.9M), so July's book is at least as well covered as June's despite the higher shallow-end pressure.
Two caveats bound the deep-scenario reading: the depth quoted is an atomic SOL-to-USDC exit at a single instant; a real cascade unfolds over many blocks, during which arbitrage and fresh liquidity refill the pools and liquidators can route into other stablecoin pairs; realizable depth over a liquidation window is larger than any single-instant quote. A 40%-plus SOL move is also an extreme tail. On-chain liquidity absorbs SOL sell pressure through the -30% range; only a fast, deep drawdown would test exit depth.
4. Per-Market Micro Analysis
Month spotlight: OnRe (ONyc). The OnRe market added $43M in July, rising from about $165M to $208M in supply (+26% MoM), the largest gain among established markets. OnRe is a tokenized reinsurance market whose collateral is the ONyc RWA; the $24.3M ONyc inflow in the asset-level data is the collateral side of that growth, with USDG and USDC the borrowable stablecoins. It scaled steadily through the month. June's parameter change raised ONyc loan-to-value to 66% (enabling up to roughly 2.9x looping) alongside the PT-ONyc launch, which widened the market's leverage capacity ahead of July's inflows (Kamino, June 17).
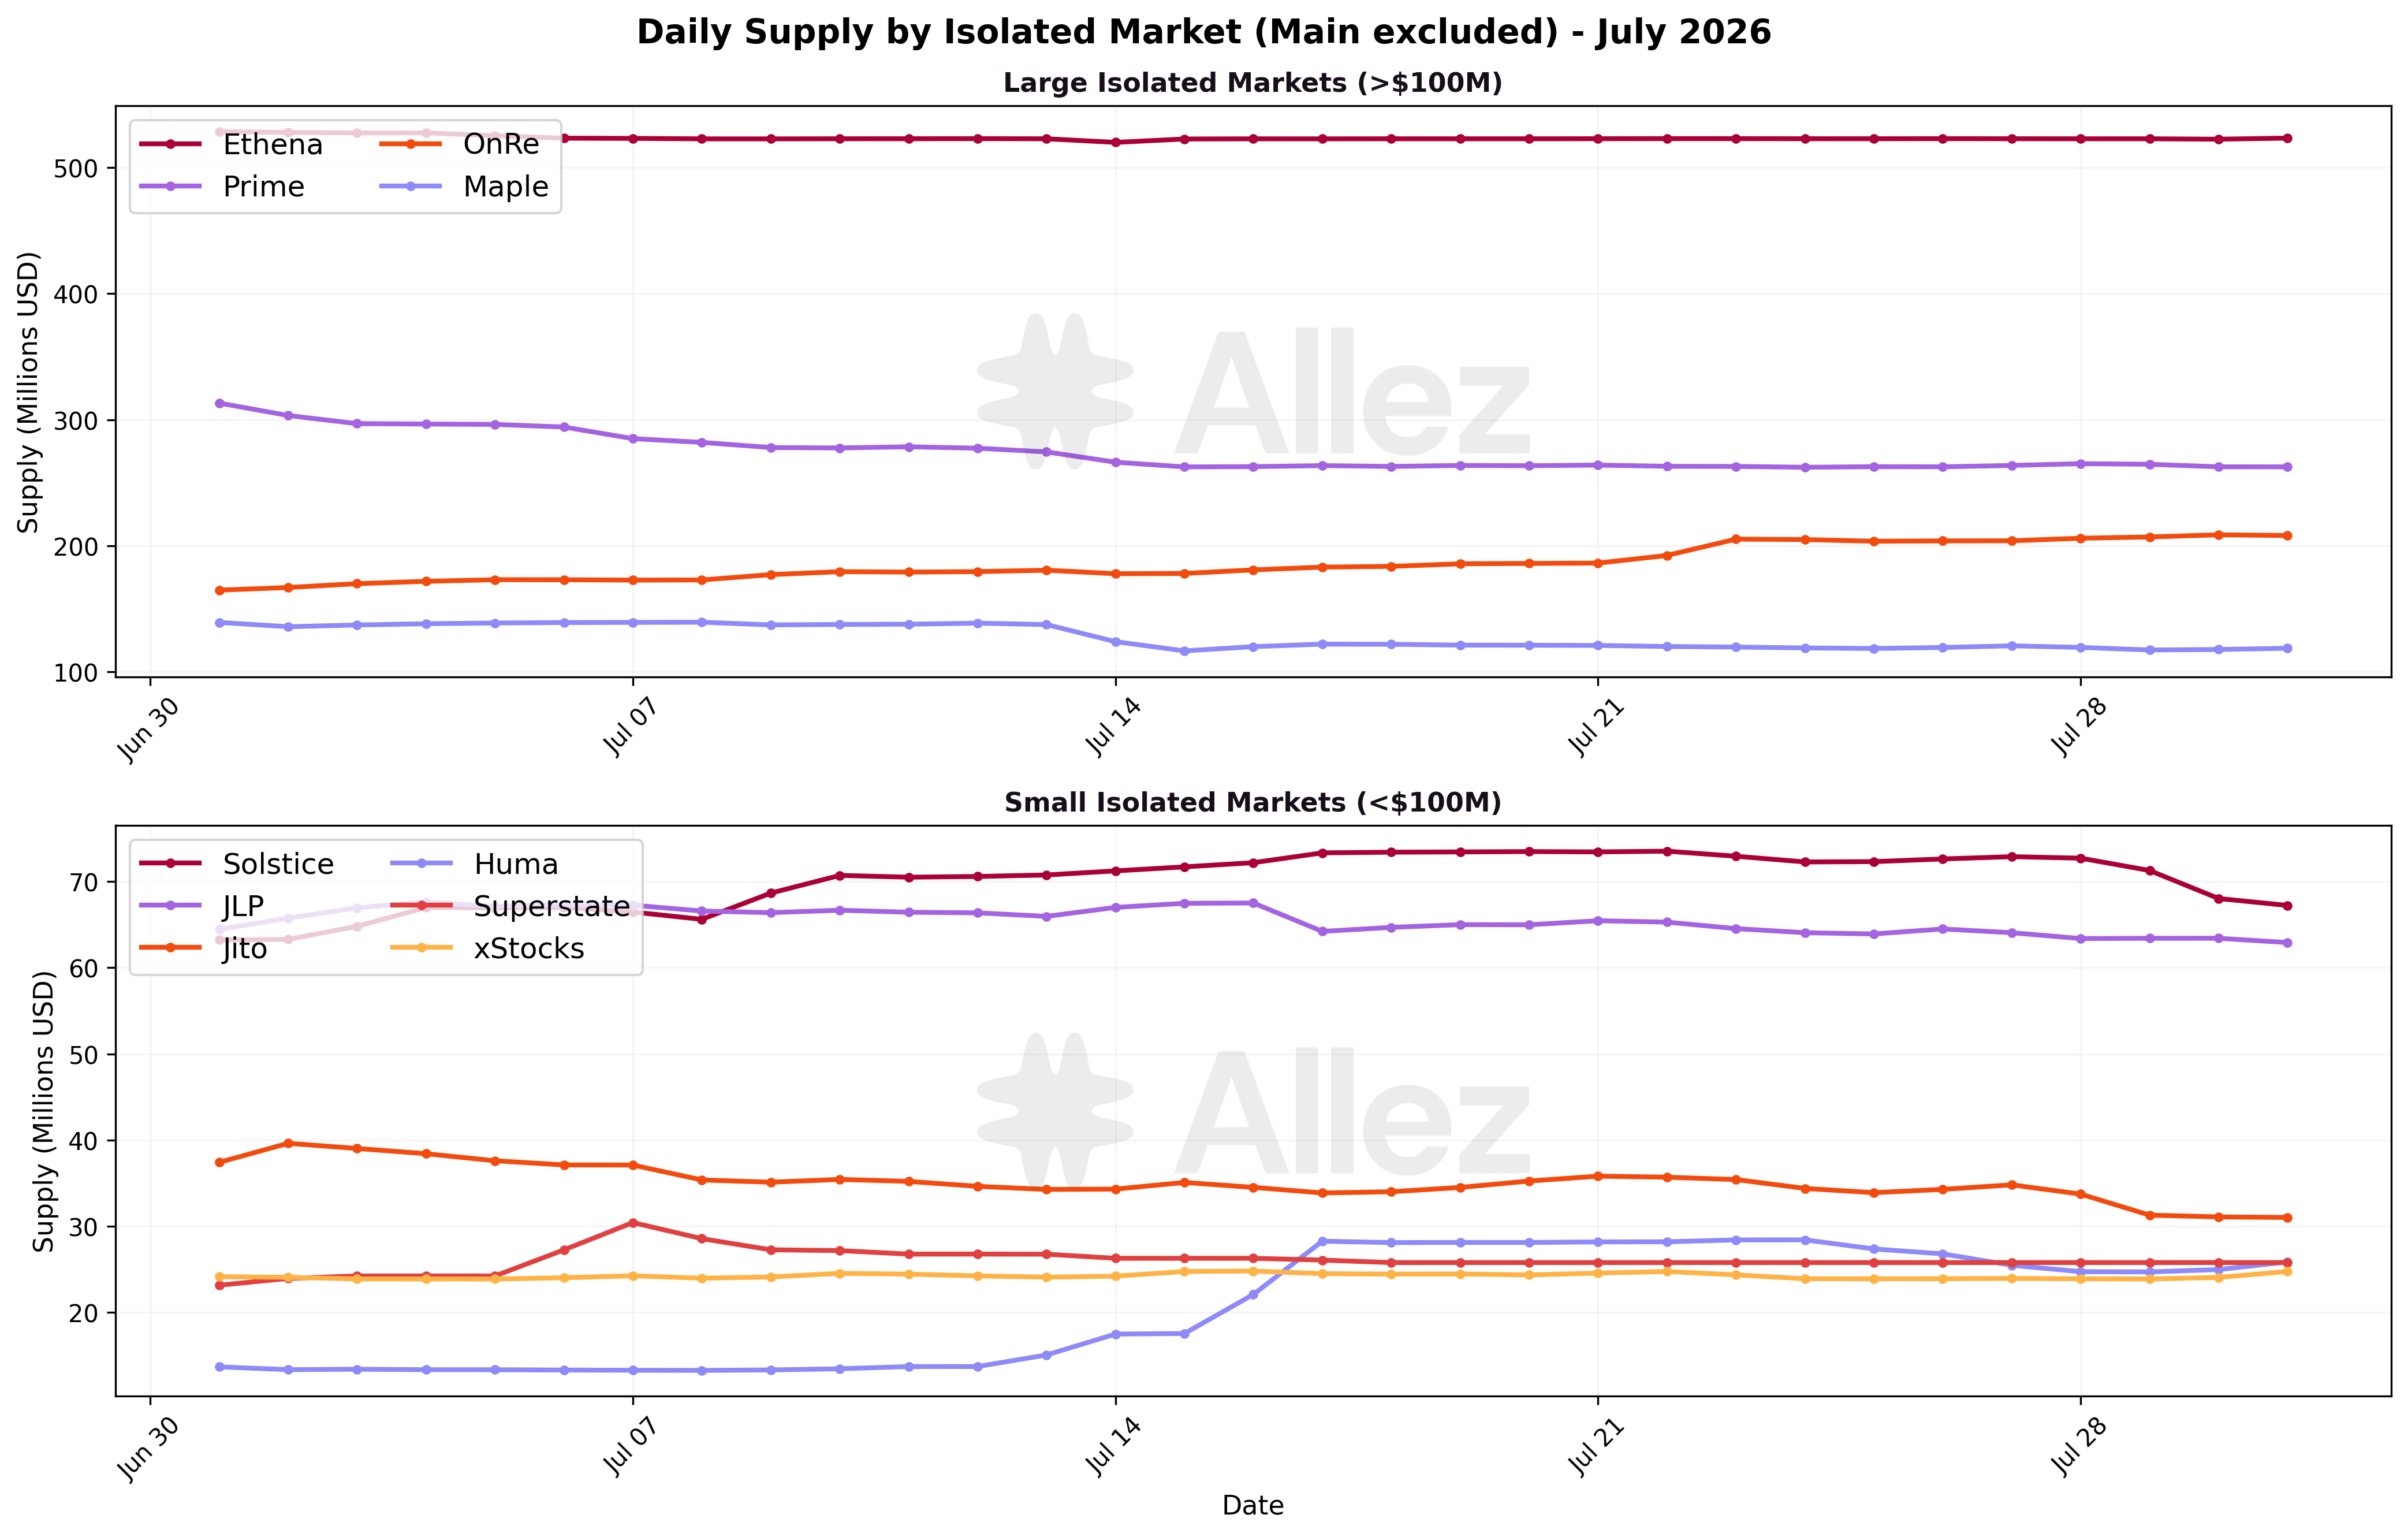
Growing markets: OnRe (+26% to $208M), Huma (+88% to $25.8M, off a small base), SolBlaze (+48% to $12.6M), Solstice (+7% to $67.2M).
Contracting markets: Prime (-19% to $262.6M), Maple (-15% to $118.7M), Jito (-15% to $31.0M), Main (-5% to $844.1M).
The contraction was concentrated in the two large private-credit markets, Prime and Maple, which together shed about $84M of supply. Their outflows drove the PRIME and syrupUSDC token outflows. The Main market eased 5% but remained the anchor of the protocol.
Market snapshot (month-end):
| Market | Supply | Supply MoM | Debt | Debt MoM | Util |
|---|---|---|---|---|---|
| Main | $844.1M | -5% | $344.4M | -6% | 41% |
| Ethena | $523.3M | -1% | $237.0M | -1% | 45% |
| Prime | $262.6M | -19% | $113.9M | -16% | 43% |
| OnRe | $208.1M | +26% | $71.3M | +25% | 34% |
| Maple | $118.7M | -15% | $48.6M | -12% | 41% |
| Solstice | $67.2M | +7% | $25.2M | +14% | 38% |
| JLP | $62.9M | -3% | $22.4M | -4% | 36% |
| Jito | $31.0M | -15% | $14.0M | -13% | 45% |
| Huma | $25.8M | +88% | $8.2M | +48% | 32% |
| Superstate | $25.8M | +11% | $7.1M | -11% | 28% |
| xStocks | $24.7M | +3% | $5.8M | +5% | 24% |
| SolBlaze | $12.6M | +48% | $5.7M | +51% | 45% |
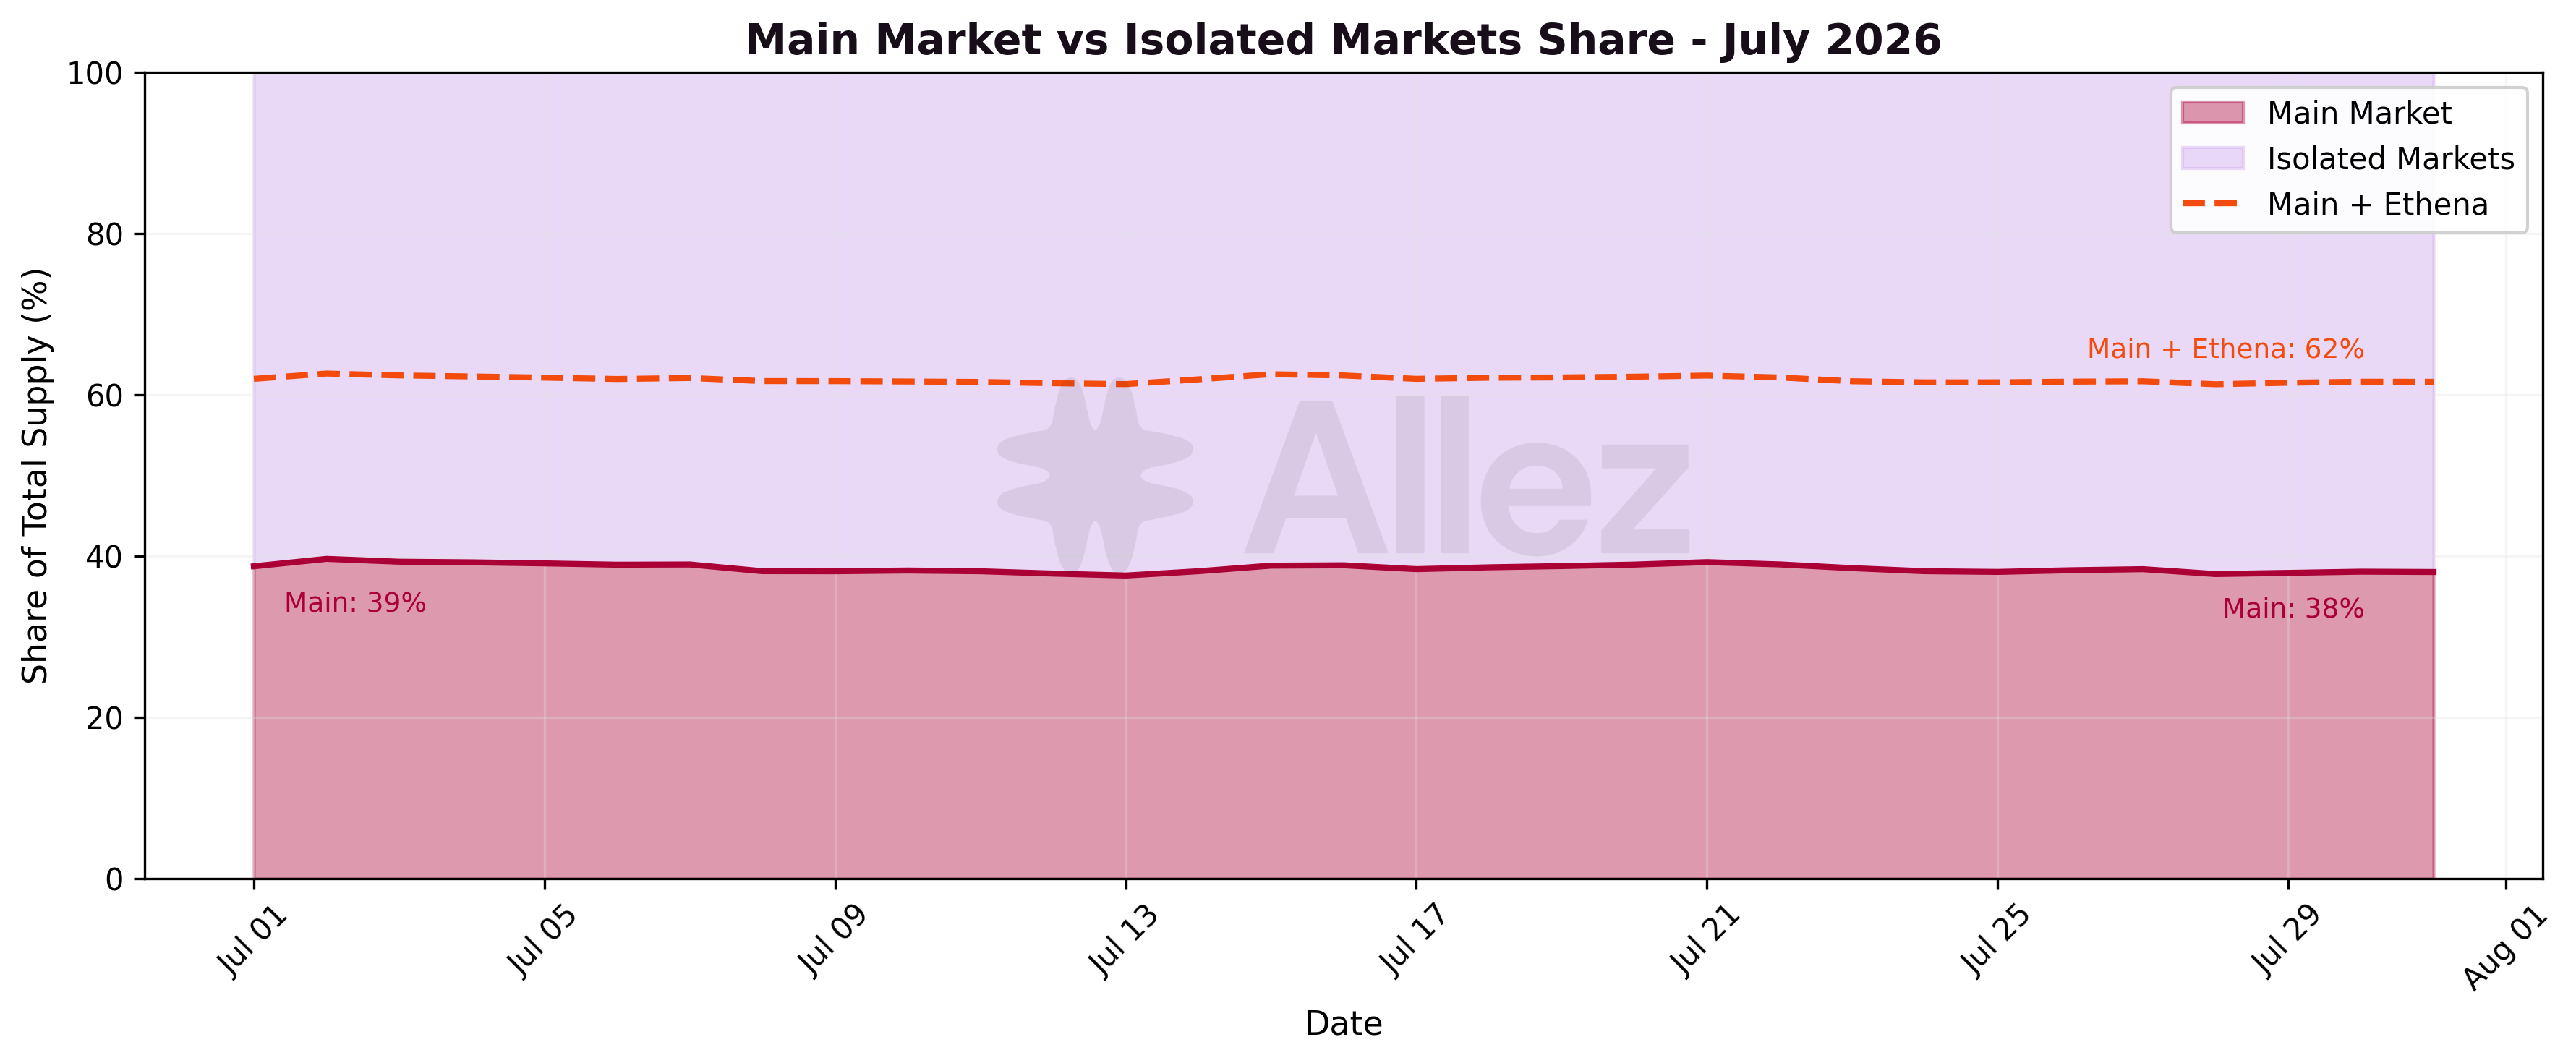
Main held at 38.0% of protocol supply. Ethena remained the second-largest market at $523.3M (23.6% of supply), roughly flat. June's headline event was the Ethena market switching its borrowed stablecoin from USDG to PYUSD; July was the new PYUSD leg's first full month. It held its balance without unwinding. Main and Ethena together account for about 62% of protocol supply, with the remainder split across the smaller RWA, credit and LST markets.
5. Kamino Lending Vaults
| Vault | Token | Deposits | MoM | Net APY |
|---|---|---|---|---|
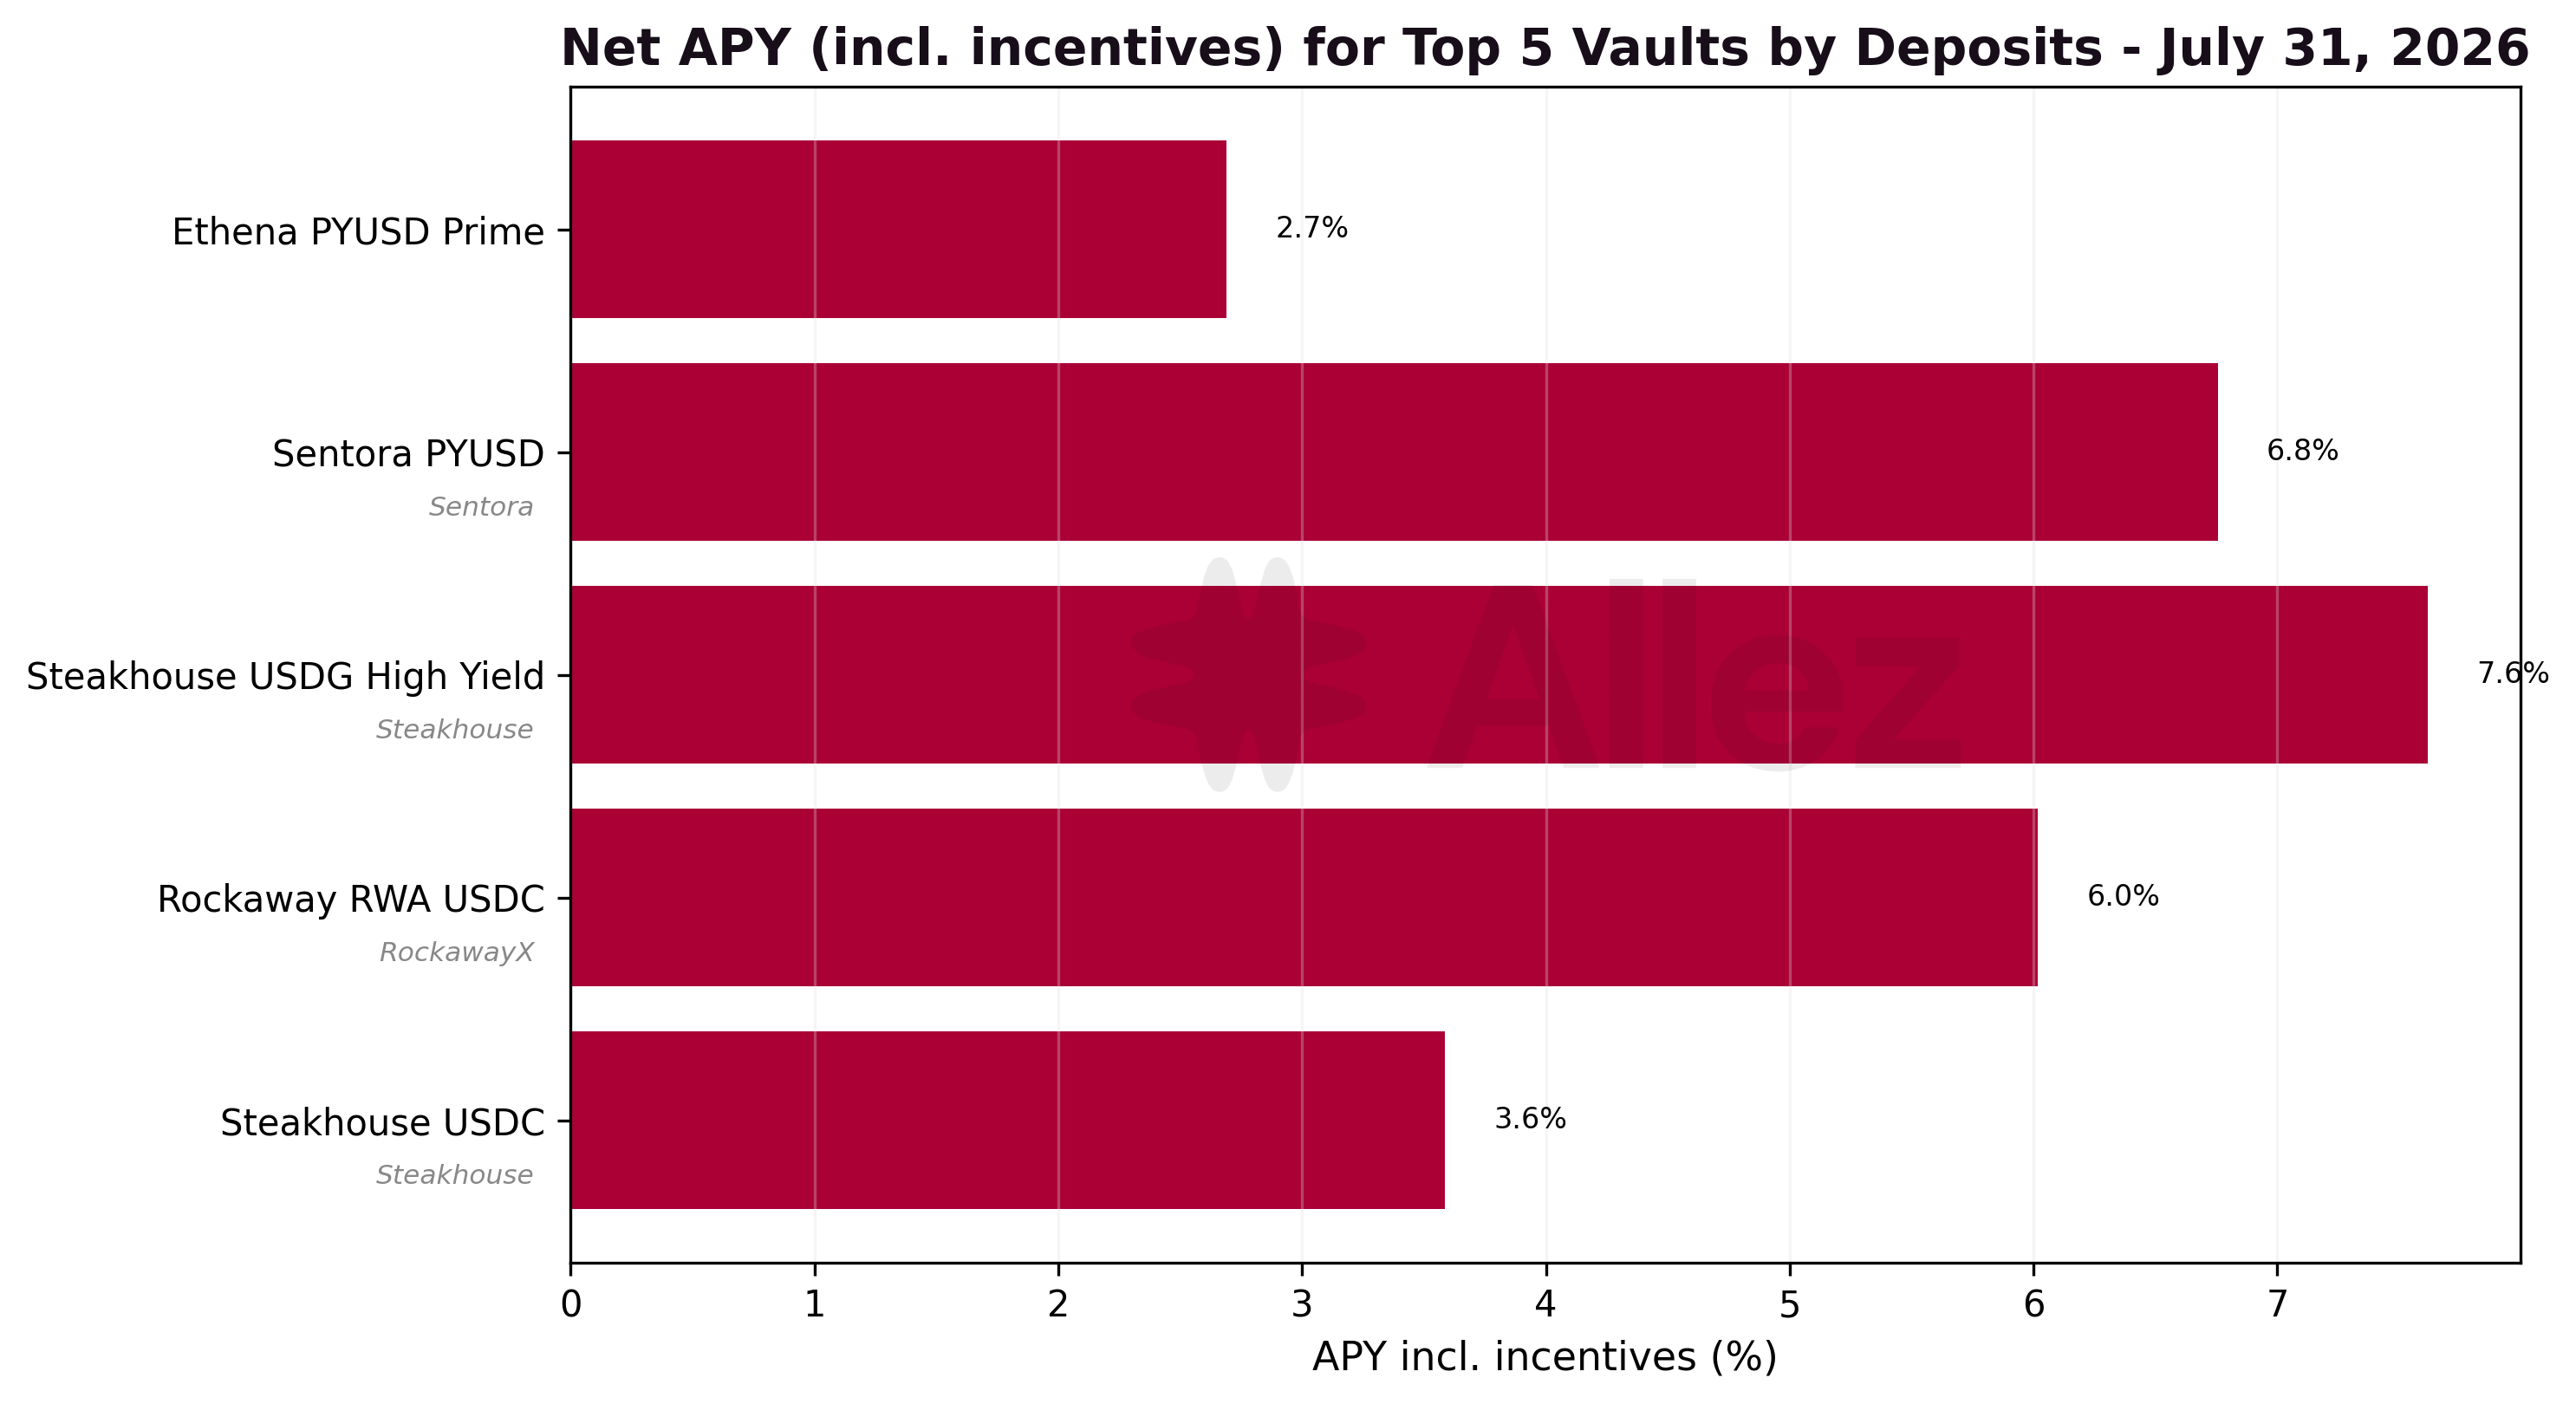
| Ethena PYUSD Prime | PYUSD | $250.6M | +0.1% | 2.69% |
| Sentora PYUSD | PYUSD | $115.1M | -19.1% | 6.76% |
| Steakhouse USDG High Yield | USDG | $33.9M | +799% | 7.62% |
| Rockaway RWA USDC | USDC | $27.6M | +6.4% | 6.02% |
| Steakhouse USDC | USDC | $20.1M | -10.7% | 3.59% |
| Allez USDC | USDC | $15.6M | -2.4% | 5.50% |
| Kamino Private Credit USDC | USDC | $7.3M | -6.2% | 7.36% |
| CASH Earn | CASH | $7.2M | -0.9% | 3.79% |
| Allez SOL | SOL | $6.4M | +28.4% | 5.14% |
| Elemental USDC Optimizer | USDC | $5.7M | +37.4% | 7.62% |
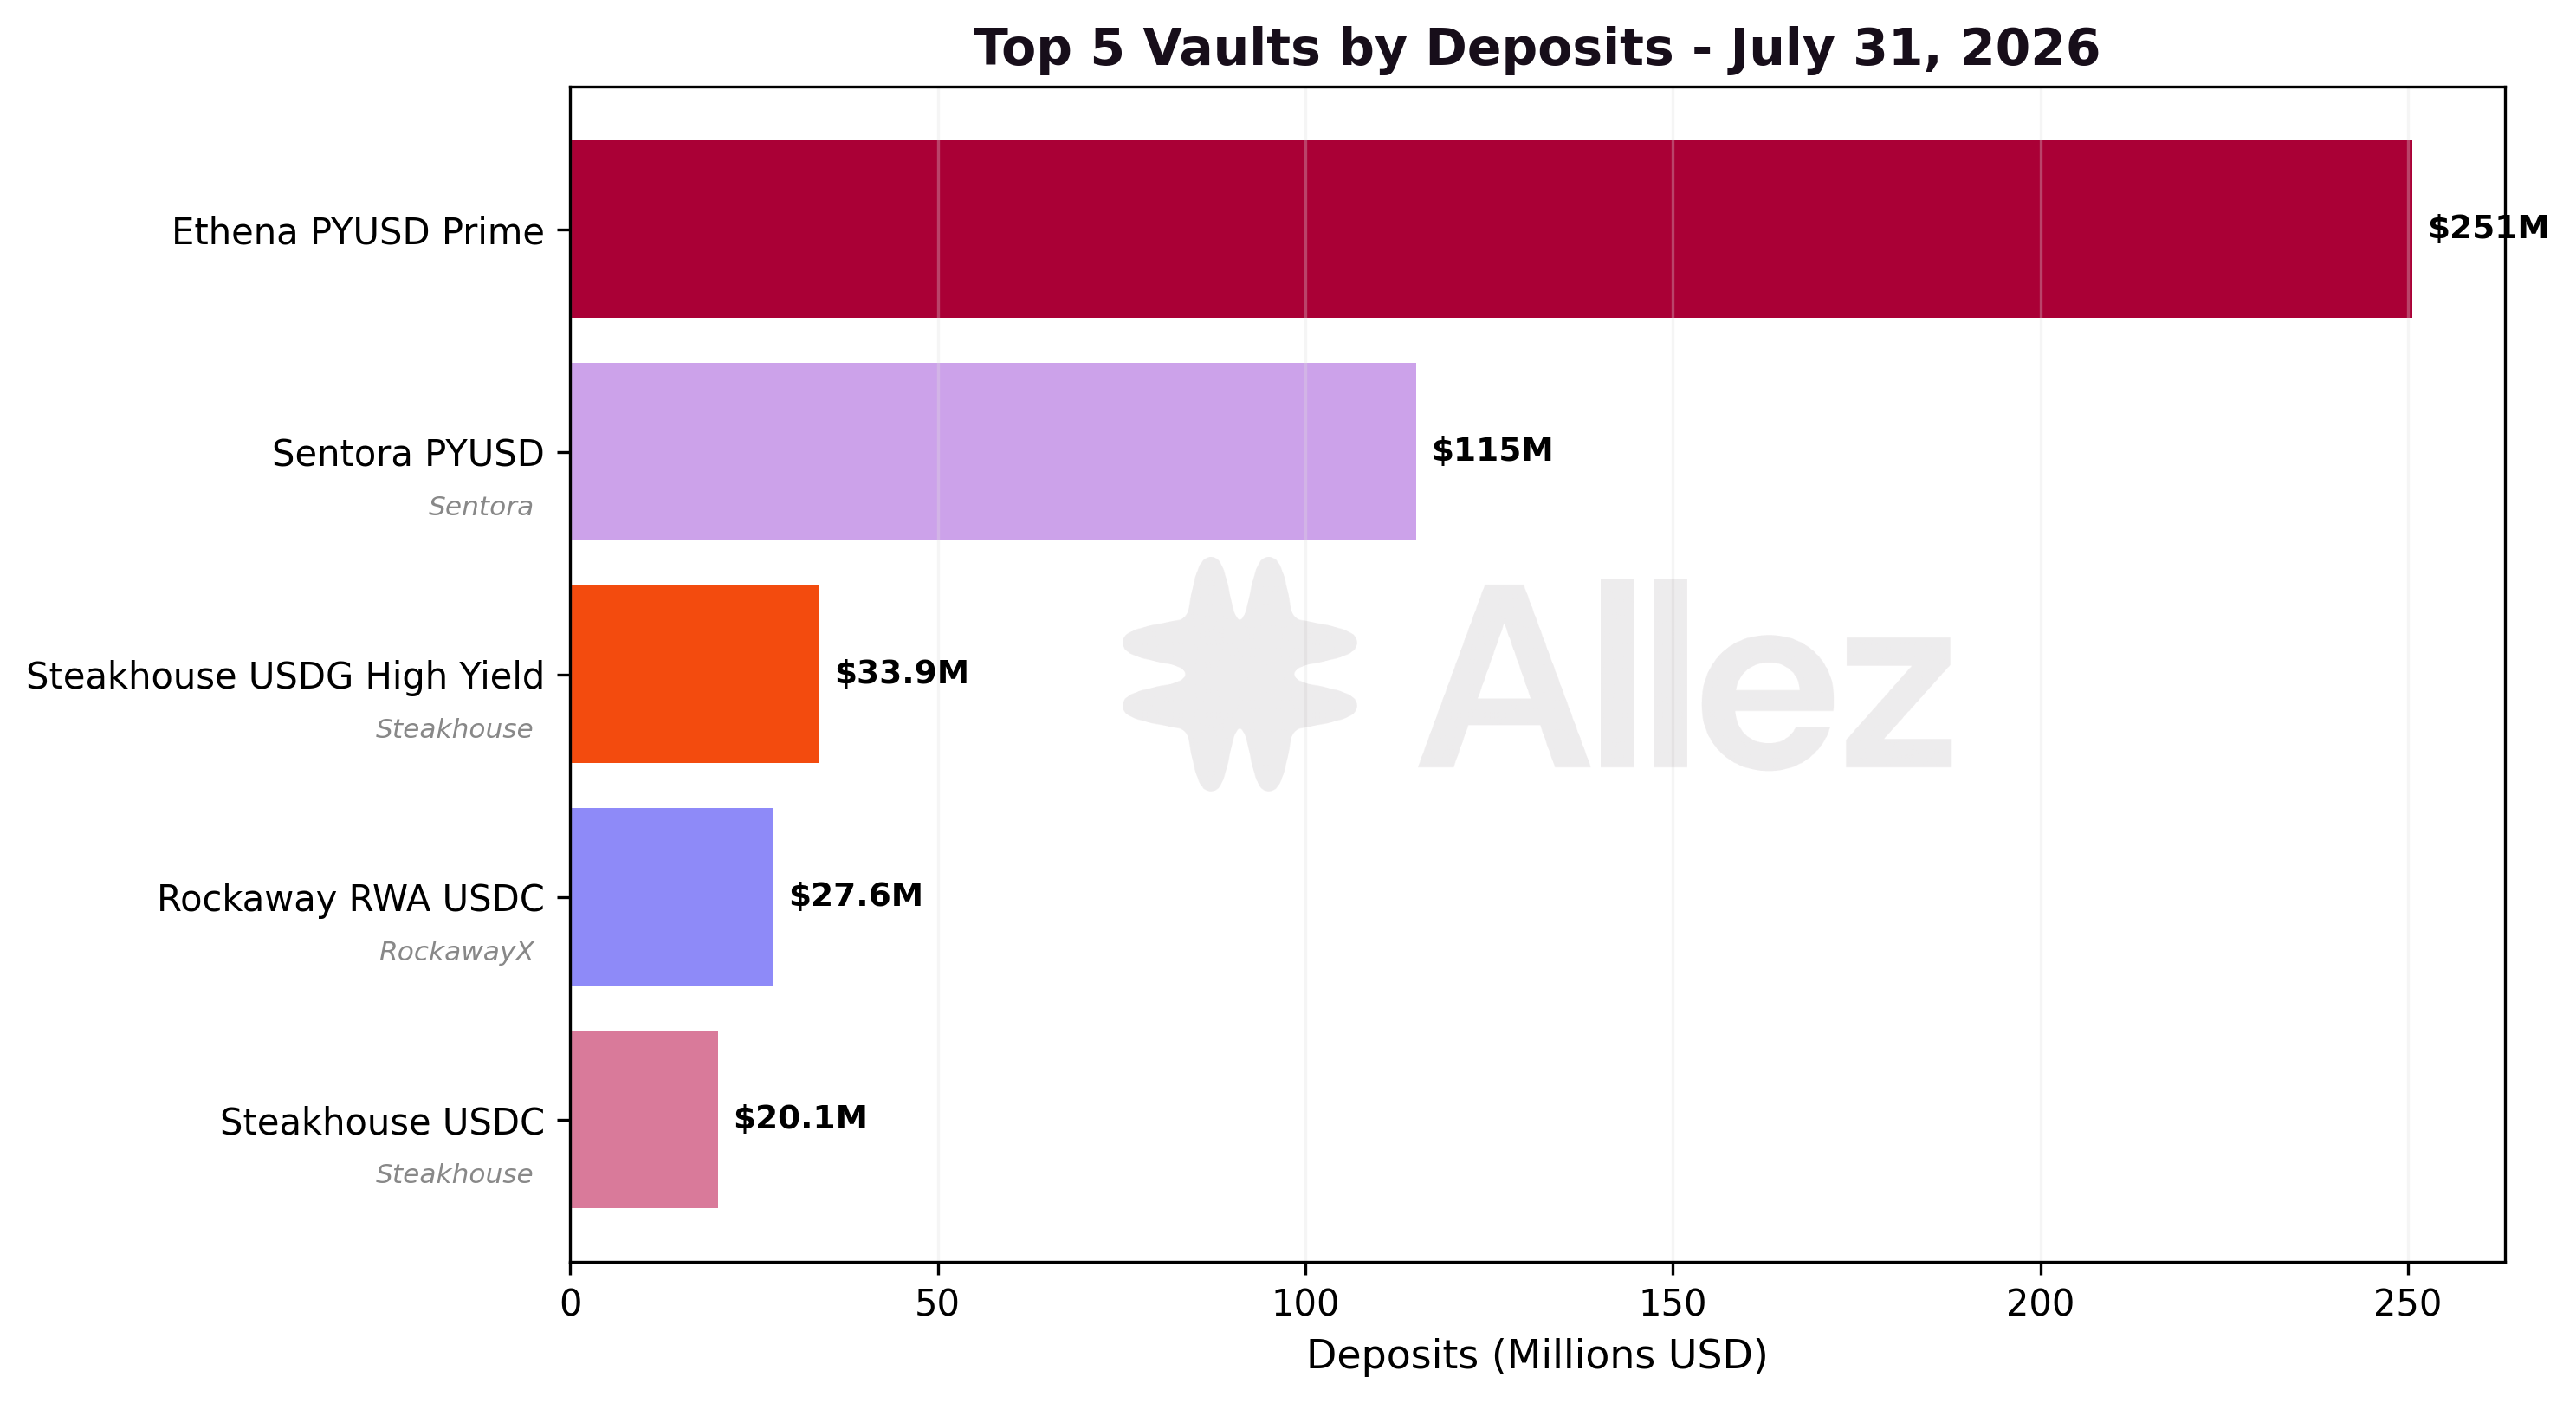
Ethena PYUSD Prime, the largest vault, held $250.6M essentially flat. The month's notable moves were the Steakhouse USDG High Yield vault, which ramped from a small base to $33.9M, and the Sentora PYUSD vault, which fell 19% to $115.1M. Net APYs (median over the month-end day, including incentives) ran from about 2.7% on the large Ethena PYUSD vault to about 7.6% on the higher-yield USDG and USDC optimizer vaults.
6. Transaction Volume
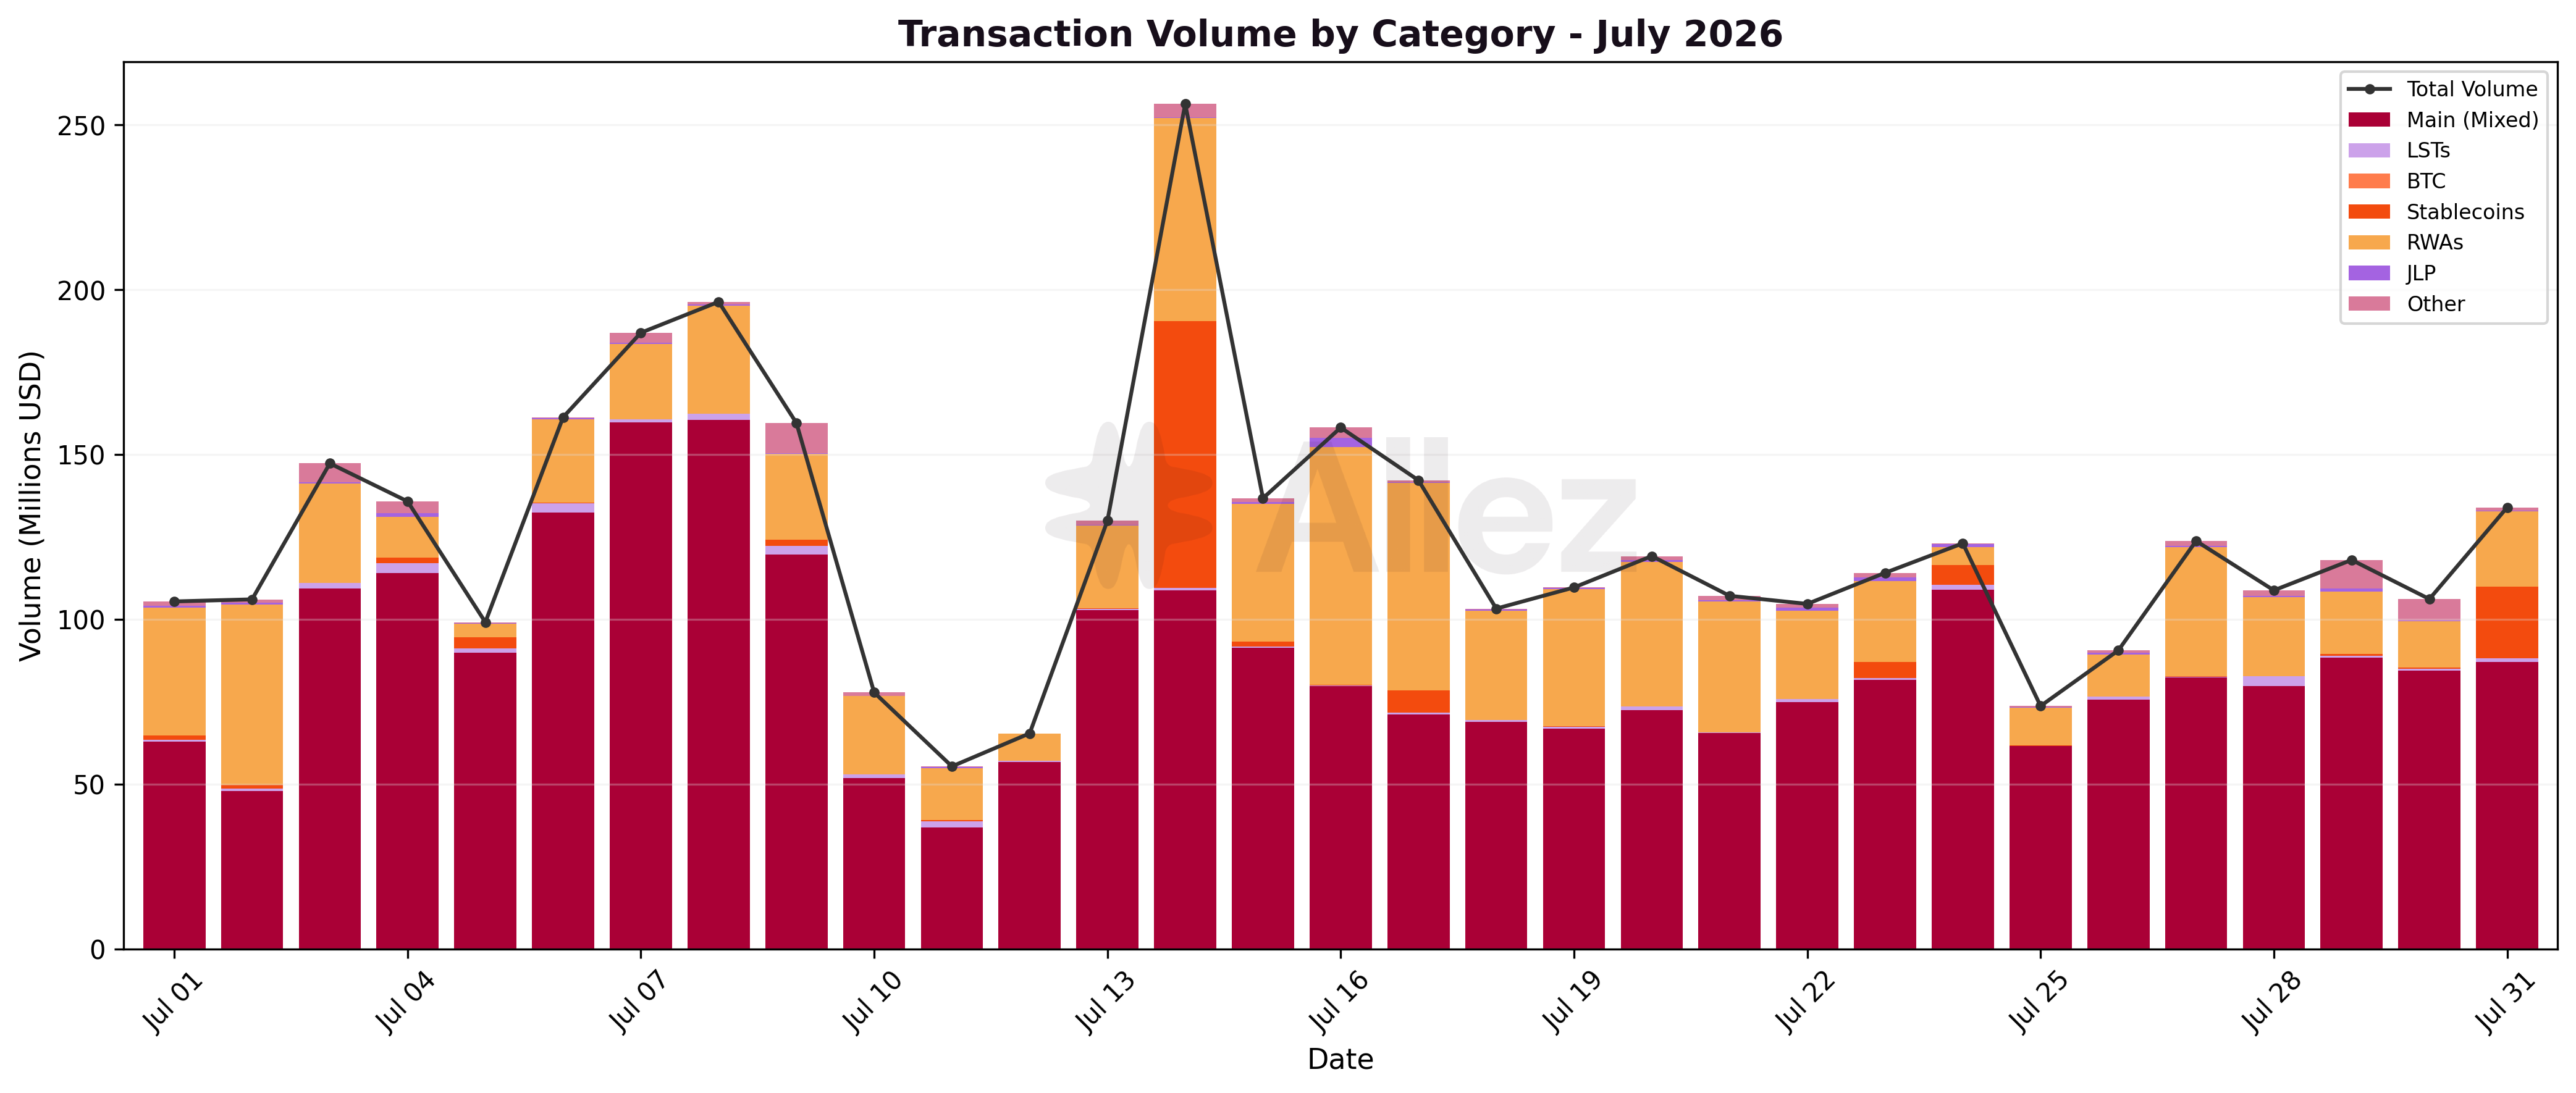
Total transaction volume was $3.86B, down 20.4% from June's $4.84B, the pullback was concentrated in large-ticket flows.
Volume by type:
| Type | Volume | MoM |
|---|---|---|
| Withdraw | $1.59B | -16.5% |
| Deposit | $1.58B | -6.9% |
| Repay | $0.38B | -44.0% |
| Borrow | $0.30B | -45.5% |
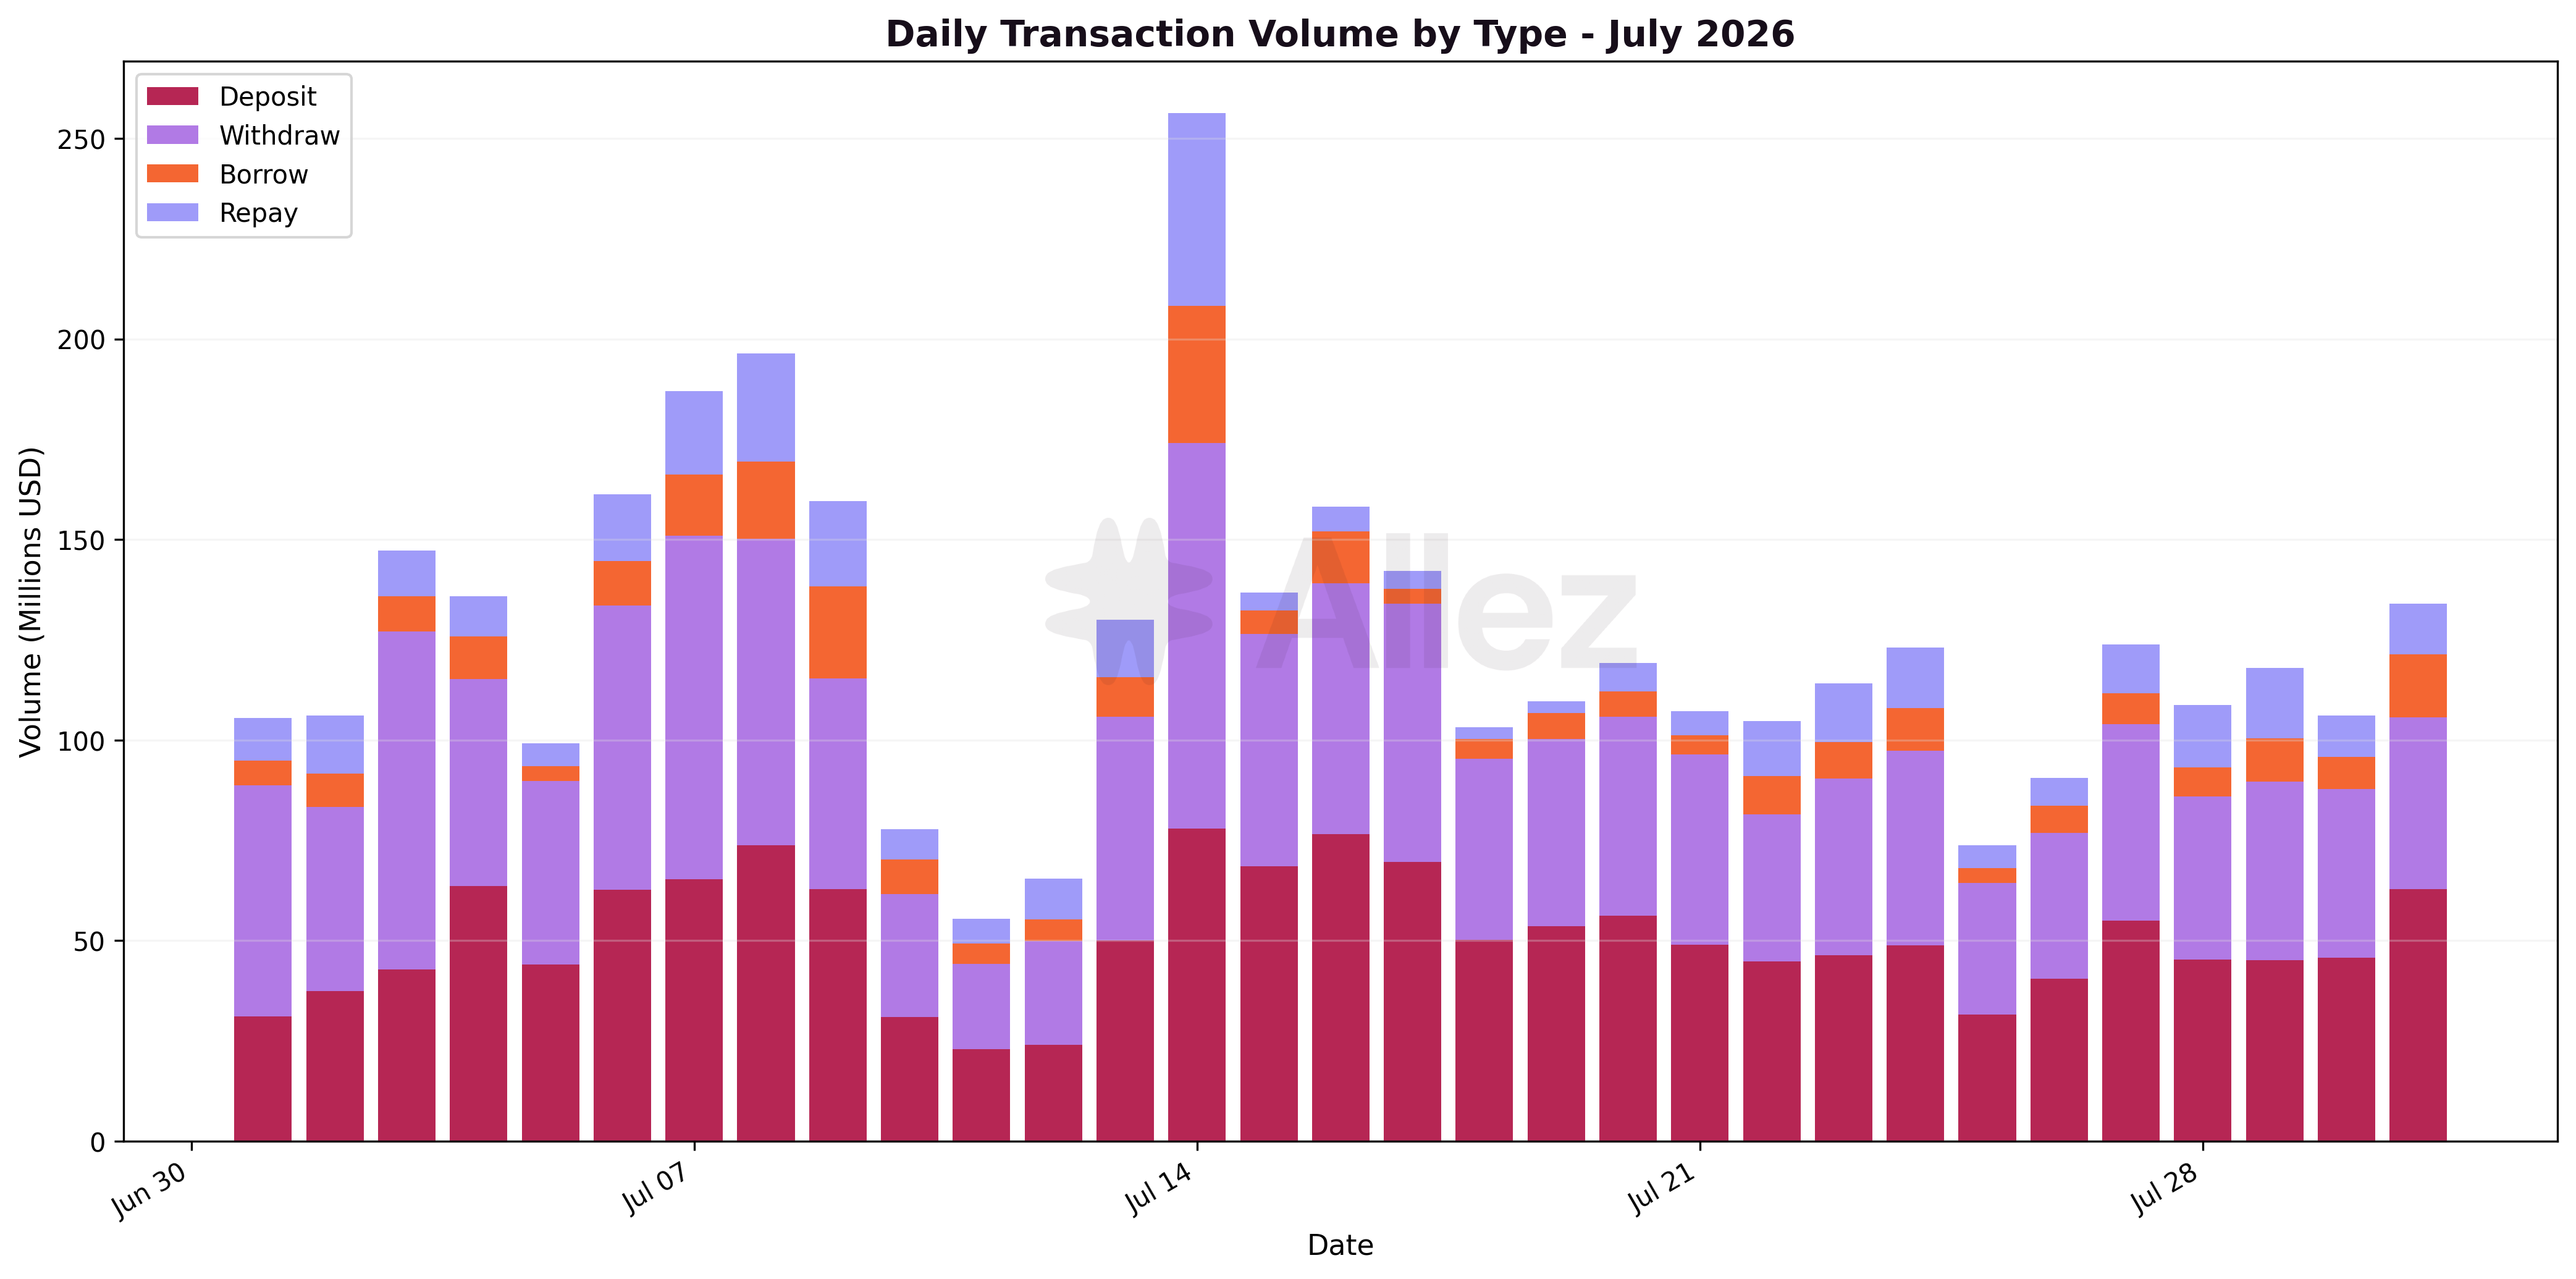
As noted in Section 1, deposit and withdrawal volumes were closely matched. Repay volume exceeded borrow volume, consistent with the reduction in outstanding debt.
| Size bucket | Volume | MoM |
|---|---|---|
| $1M+ | $2.10B | -19.0% |
| $100K-1M | $1.14B | -21.2% |
| $10K-100K | $0.43B | -35.7% |
| $1K-10K | $0.13B | +16.0% |
| $0-1K | $0.06B | +102.4% |
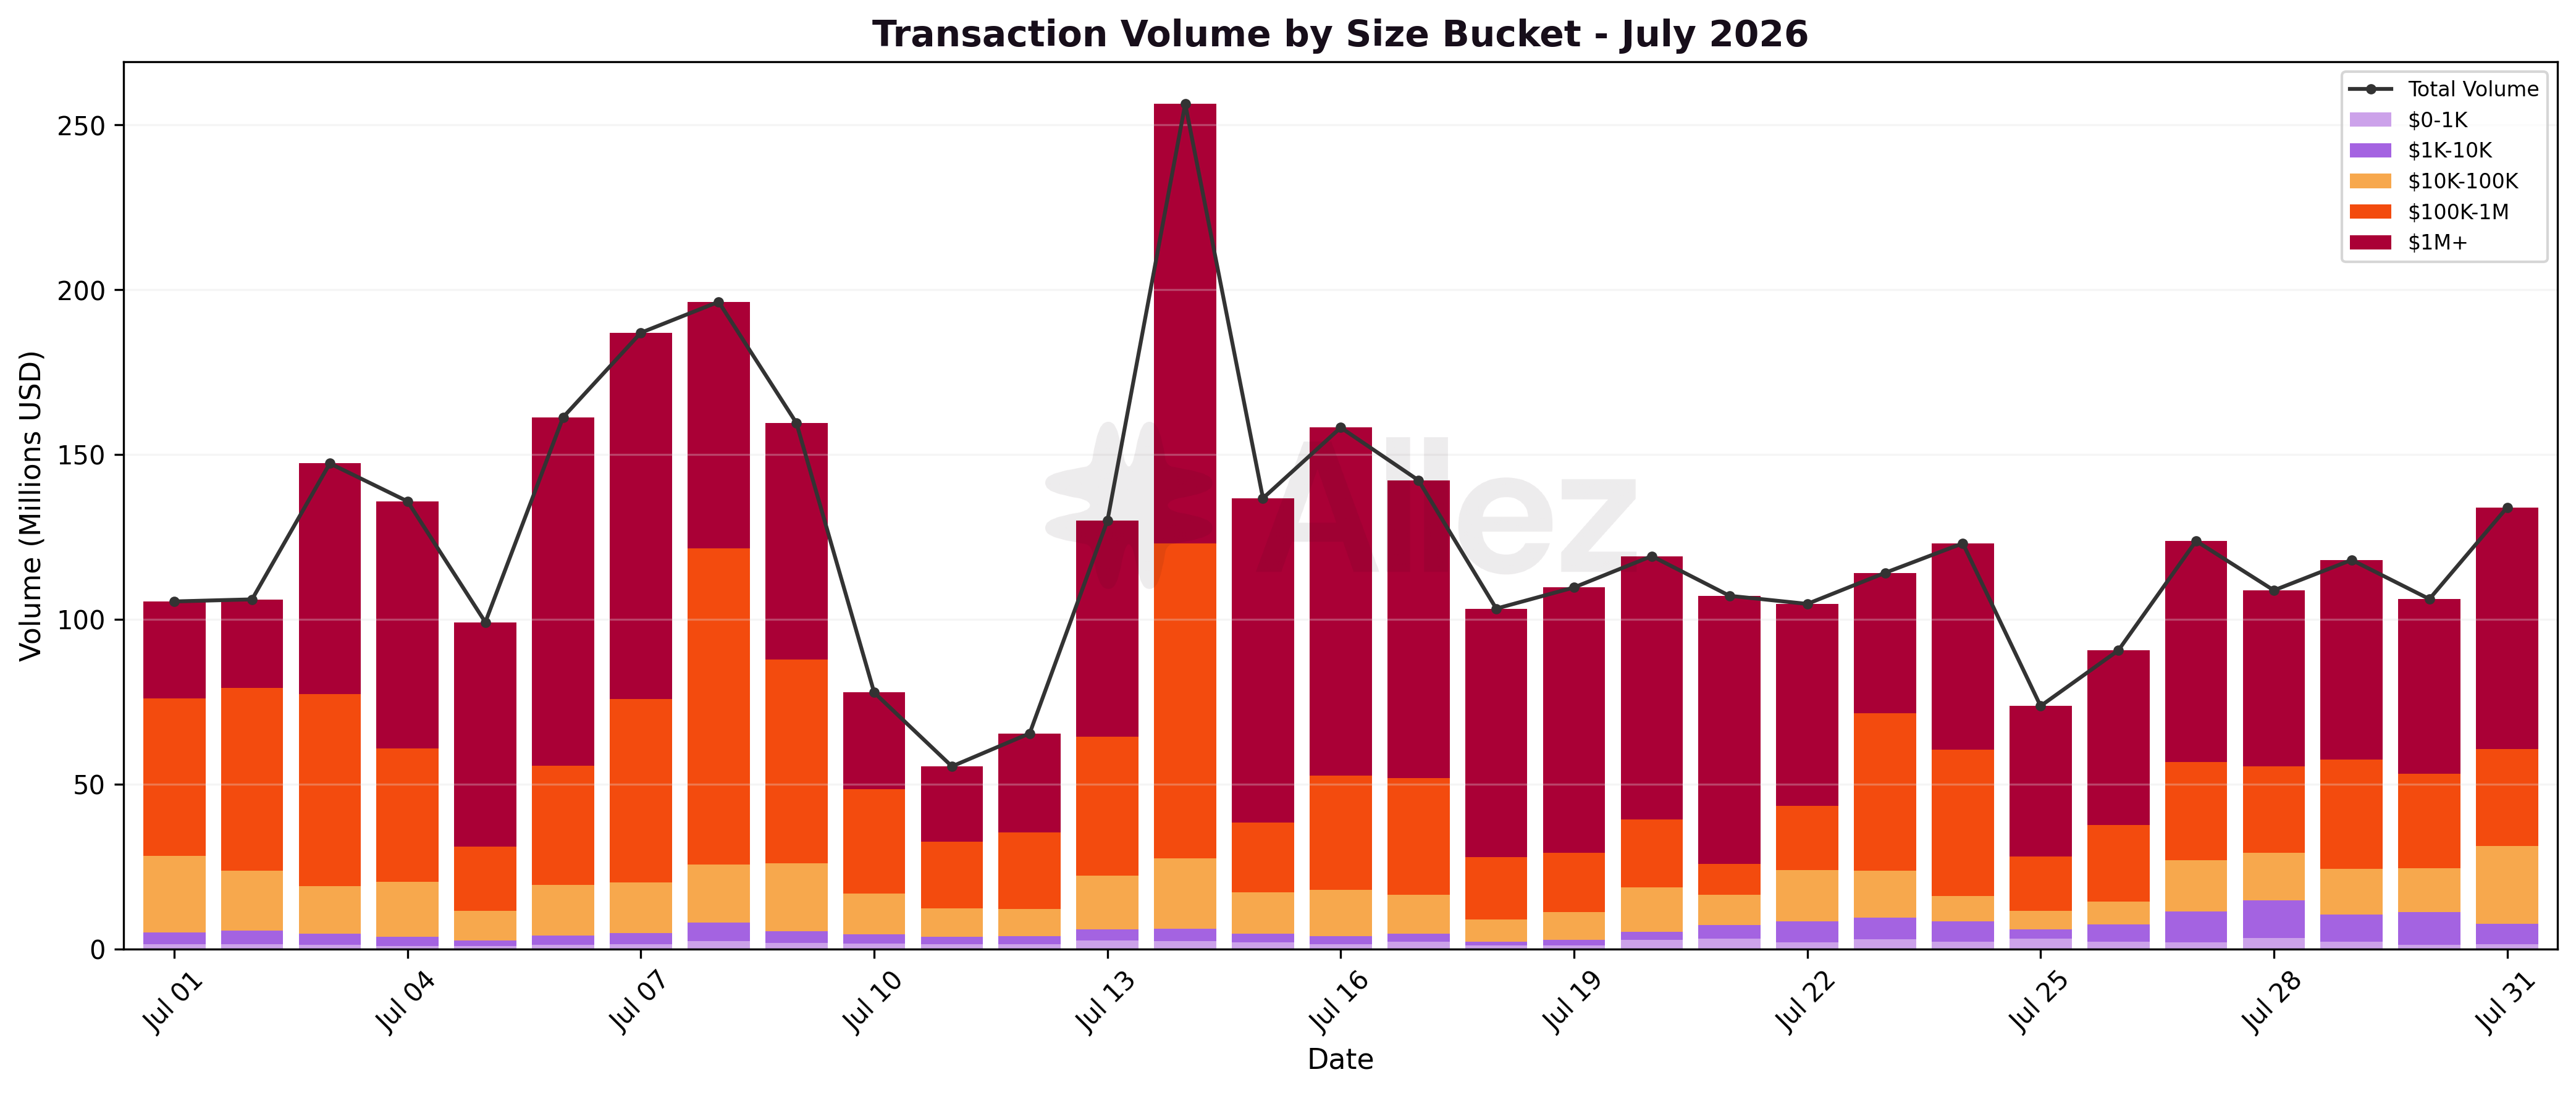
Large tickets still dominate: the $1M+ and $100K-1M buckets together accounted for $3.24B, about 84% of total volume. The decline sat there too, both down about 20%, with the $10K-100K bucket off 36%, while the two smallest buckets grew ($1K-10K +16%, $0-1K +102%). The lower total was a pullback in large-ticket flow rather than a broad-based drop in activity.
One reserve explains the month's high interest: the Main-market SOL reserve, about 21% of protocol debt ($180-184M), saw its borrow APR climb from 7.1% to 9.7% as utilization rose from 90.0% to 91.4%, past the kink on the steep part of its rate curve, so a small utilization increase produced a large rate move, and because SOL is a large share of borrowing it lifted the whole blended rate. Interest paid rose 10.0% ($4.11M to $4.53M) even though average daily debt fell 3.8% ($959.6M to $922.7M), so the implied blended borrow rate rose about 11% (5.22% to 5.78%). Debt mix did not cause this shift; it drifted toward lower-rate stablecoins.
7. Conclusions and Forward Look
July was a low-risk month: $0.39M of collateral seized across 610 events, all but one below six figures, and the uncorrelated borrow book kept 89% of its value in the two safest tiers.
The 3.2% supply and 3.4% debt easing was orderly, with deposits and withdrawals staying close to balanced. The largest offsetting moves were outflows from the Prime and Maple private-credit markets (together -$84M) alongside inflows to the OnRe insurance market (+$43M) and stablecoin curator vaults such as Steakhouse USDG.
The interest result is the one figure that moved against the headline direction: interest paid rose 10% while debt fell, so the blended borrow rate rose about 11%. This reflects the Main-market SOL reserve moving further up its rate curve on higher utilization.
Outlook
July resolved two of June's three questions: The SOL-driven deleveraging stabilized, with the -14.4% June contraction easing to -3.2%. The Ethena market's new PYUSD borrow leg held flat through its first full month. The third question stays open: whether Prime and Maple stabilize or continue to unwind, since they drove most of July's contraction. Growth is coming from OnRe and the stablecoin curator vaults. With SOL flat and liquidations minimal, the near-term watch item is RWA-market flows.
Appendix: Asset Category Classification
| Category | Month-end Supply | Share | Supply MoM | Representative assets |
|---|---|---|---|---|
| Stablecoins | $1,078.7M | 48.6% | -1.5% | USDC, PYUSD, USDG, USDT, USDS, USX, CASH |
| RWAs | $418.1M | 18.8% | +1.0% | PRIME, ONyc, PST, syrupUSDC, FWDI, tokenized stocks, eUSX |
| LSTs | $399.3M | 18.0% | -9.4% | JitoSOL, jupSOL, mSOL, fwdSOL, dfdvSOL, INF |
| SOL | $212.9M | 9.6% | -10.7% | SOL |
| BTC | $62.9M | 2.8% | +9.0% | cbBTC, xBTC, WBTC, zBTC |
| Other | $47.6M | 2.1% | +1.0% | ETH, JLP, BONK, JUP, KMNO |
Classification notes: LSTs are Solana liquid-staking tokens representing staked SOL (such as JitoSOL, mSOL, and INF); this covers tokens ending in SOL other than SOL itself, plus INF. RWAs are tokenized real-world assets, including private-credit tokens (PRIME, syrupUSDC), insurance tokens (ONyc), and tokenized equities; syrupUSDC is a Maple credit token classified as an RWA despite its USDC suffix. Stablecoins are USD-pegged tokens. Pendle PT tokens are classified under the category of their underlying.
This report represents independent risk analysis by Allez Labs for the Kamino Finance community.
Prepared by: Allez Labs Risk Team
Report Date: July 31, 2026
Next Report: August 2026 Monthly Report published in September 2026