February was defined by a sharp SOL correction: from an opening price of ~$104, SOL fell to an intraday low of $68 between February 3 and 6, triggering 66,848 liquidations in three days and $23.5M in collateral seized. Liquidation activity increased nearly 5x relative to January's monthly count (14,355 events), confirming the robustness of Kamino's liquidation infrastructure under stress. Despite the sell-off, the protocol's structural diversification continued. Prime deposits grew +51% to $575M, cbBTC supply nearly doubled (+$96M), and Superstate grew +222%. Total supply closed at $2.87B (-13.7%), as SOL price depreciation drove the headline decline while USD-denominated markets continued to expand.
1. Market Context & SOL Price
The 13.7% supply decline is primarily attributable to SOL's 27.6% price drop, which mechanically reduced the USD value of SOL and LST-denominated positions. Debt contracted faster (-18.4%) than supply, indicating deleveraging across the protocol as users reduced exposure during the correction. Interest revenue declined 24% as lower outstanding debt reduced fee generation.
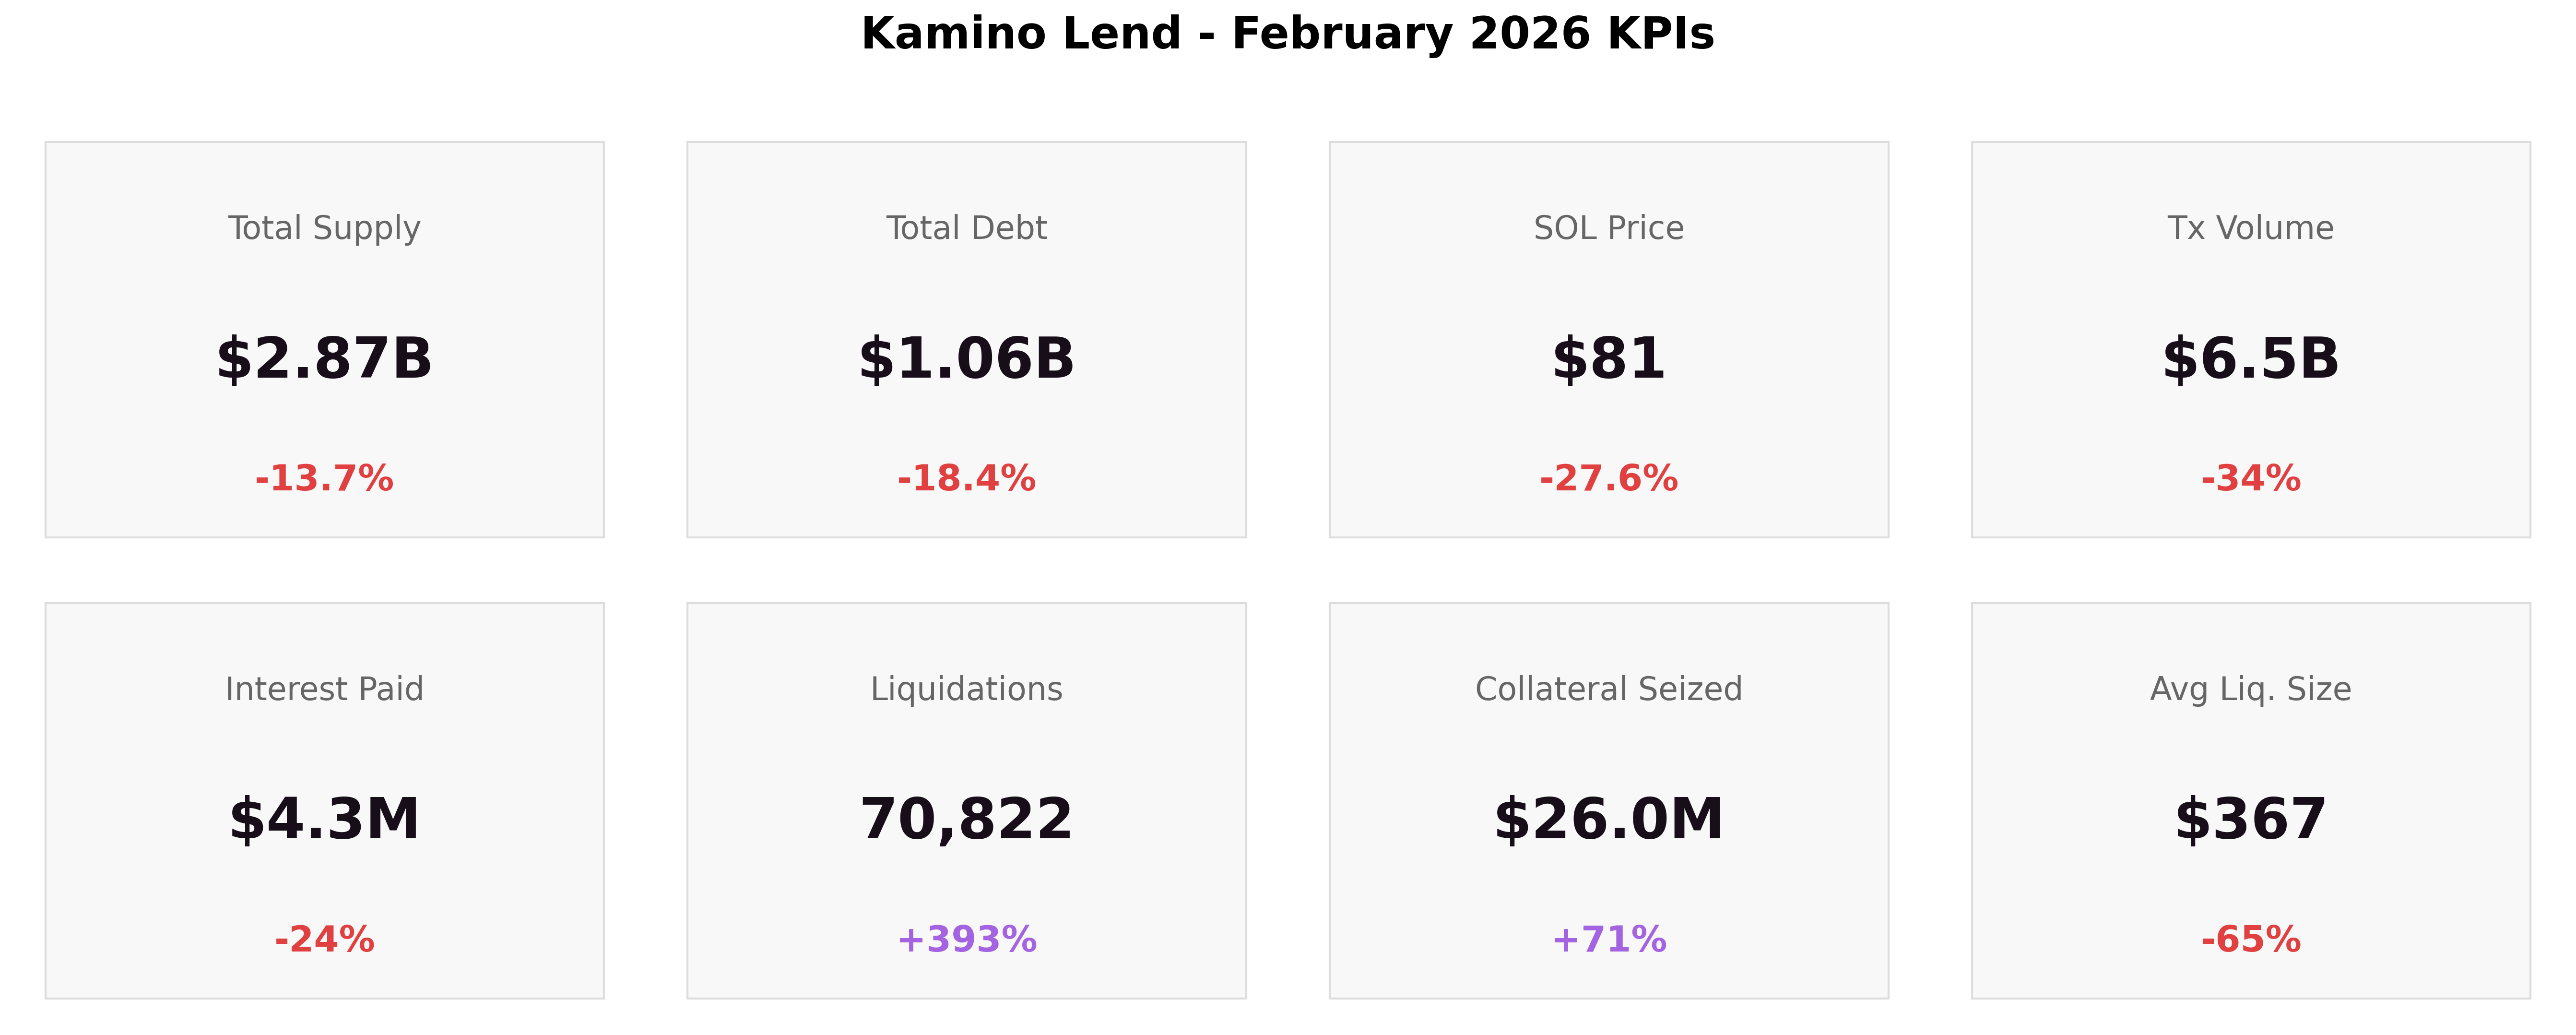
Kamino closed February 28 with:
-
Total Supply: $2.87B (-13.7%)
-
Total Debt: $1.06B (-18.4%)
-
SOL Price: $81 (-27.6%)
-
Transaction Volume: $6.5B (-34%)
-
Interest Paid: $4.3M (-24%)
-
Liquidations: 70,822 (+393%)
-
Collateral Seized: $26.0M (+71%)
-
Avg Liquidation Size: $367 (-65%)
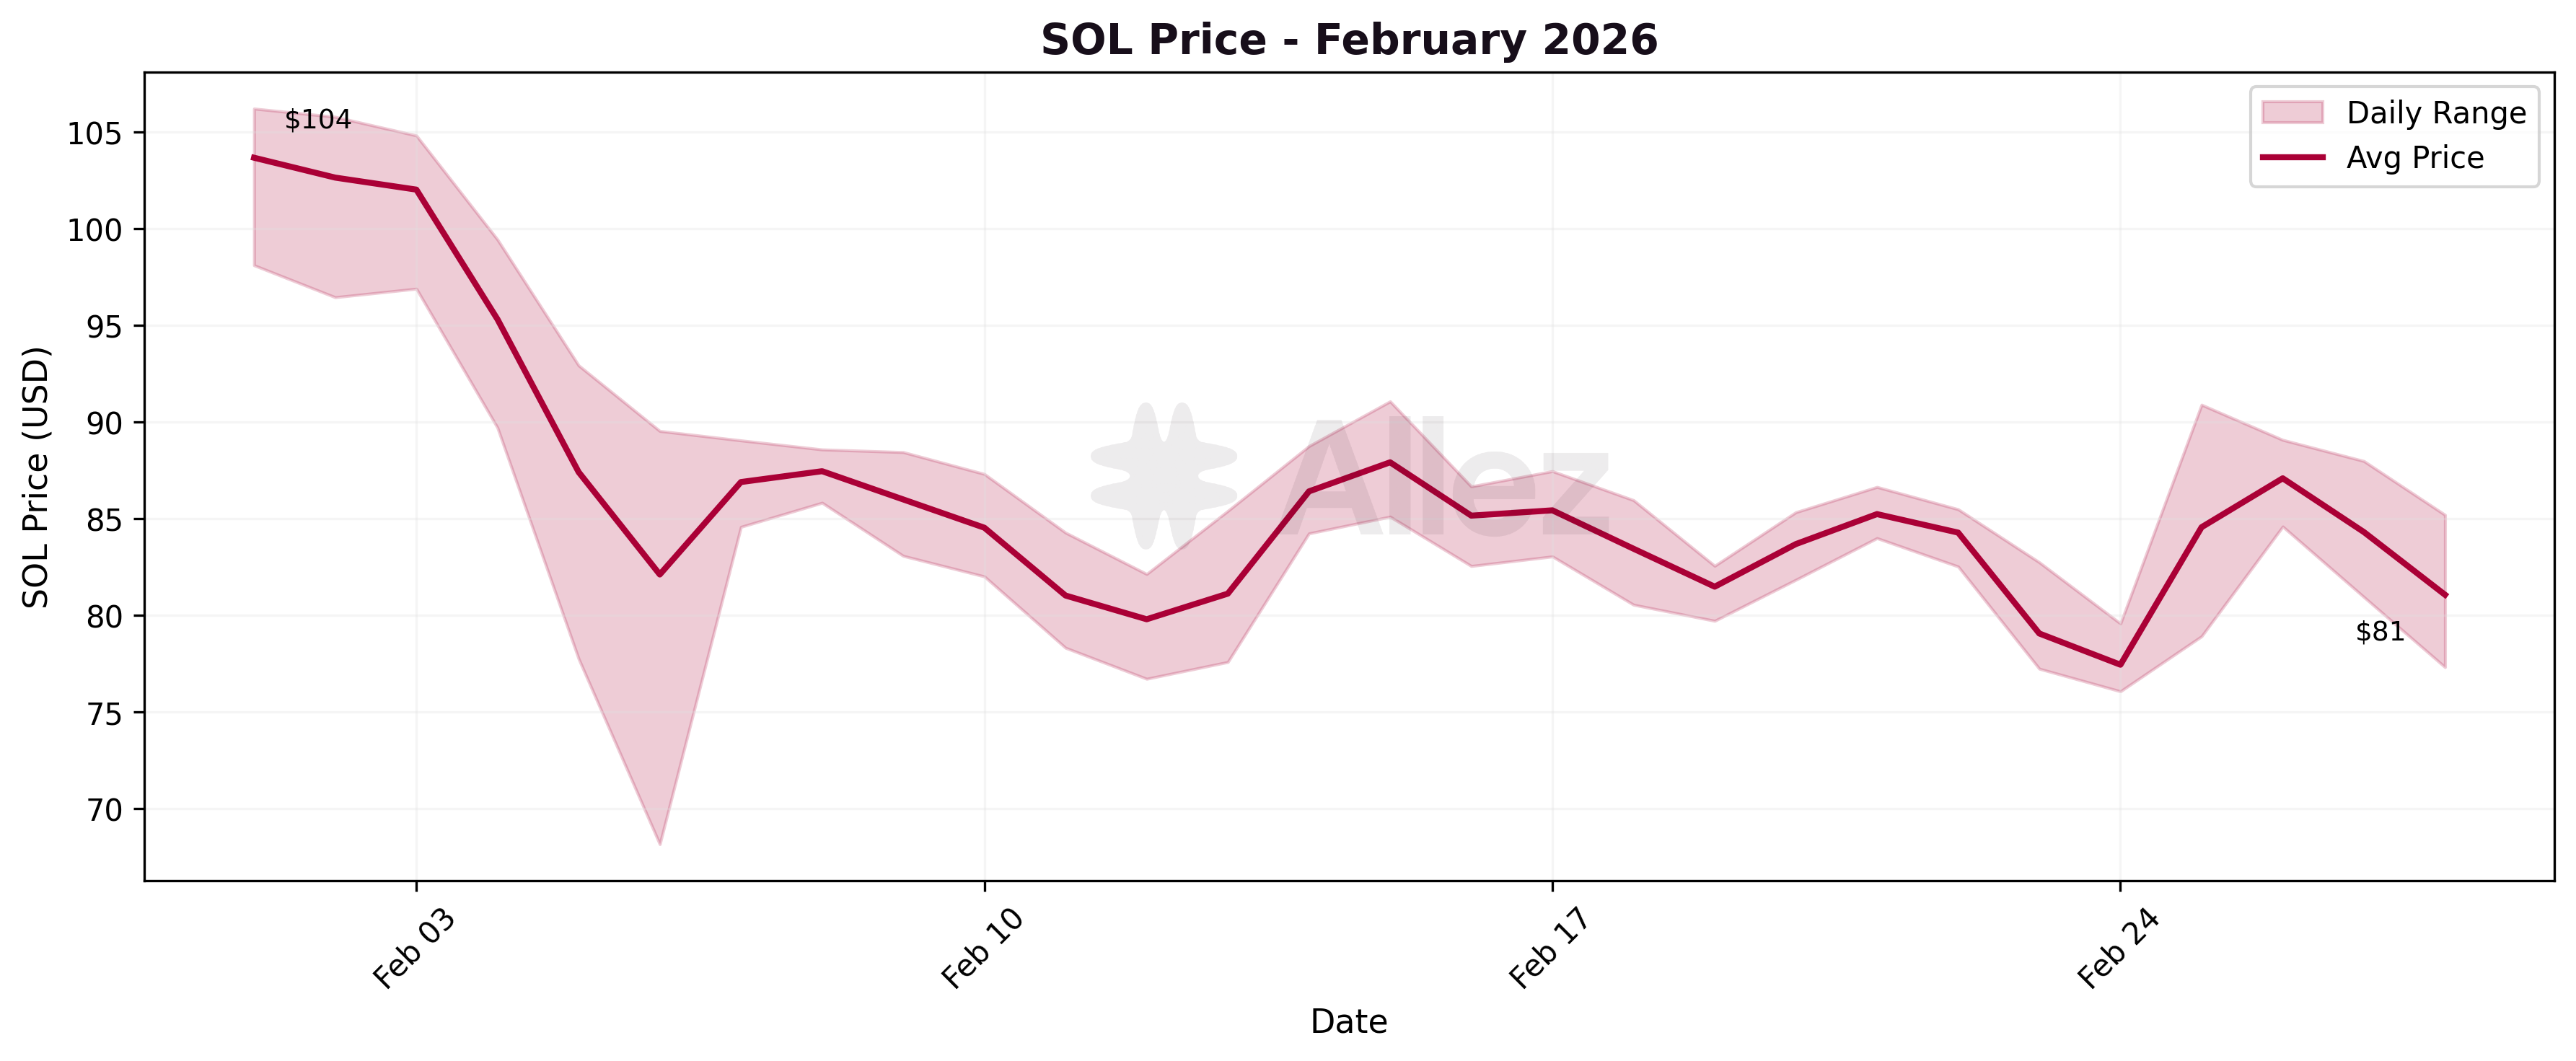
SOL opened February near $104 and immediately came under pressure. After a brief hold around $102, prices entered a steep decline on February 4, crashing to an intraday low of $68.17 on February 6 - a 35% drawdown from the month's open. The recovery was gradual: SOL stabilized around $85-87 by mid-February, rallied briefly to $91 on February 15, then sold off again to $77 on February 24 before closing at $81 at month-end. The two-phase correction (early-month crash + late-month retest) created sustained stress on leveraged positions throughout the entire period.
Kamino Ecosystem Updates:
February saw several product launches and integrations that directly shaped the protocol's activity:
-
RWA $1B Milestone: Total RWA supply across Kamino markets crossed $1B, driven by Prime ($575M), Maple, OnRe, and Superstate. OnRe alone surpassed $55M in deposits with reinsurance-backed yield.
-
Tri-Party Institutional Lending: Kamino, Anchorage Digital, and Solana Company (NASDAQ: HSDT) launched a tri-party custody model, delivering on the "Custody-Integrated Borrowing" primitive from the December Breakpoint roadmap. Institutions can borrow on-chain against natively staked SOL held in Anchorage's qualified custody, with a Chainlink-powered verification system mirroring custodied assets as on-chain collateral tokens.
-
Multiply Expansion:
-
Kamino enabled directional leverage on tokenized equities (SPYx, QQQx, TSLAx) through the Multiply product, offering up to 3.5x multiplier and up to 13% APY. This drove activity on the xStocks isolated market.
-
Multiply added stablecoin-to-stablecoin looping, allowing users to capture rate spreads between USDC and PYUSD. This contributed to stablecoin utilization across lending markets.
-
2. Macro View: Liquidity by Category
Composition split (February 28 vs January 31):
| Category | Supply | Share | MoM Share | Debt | Debt Share | MoM Debt Share |
|---|---|---|---|---|---|---|
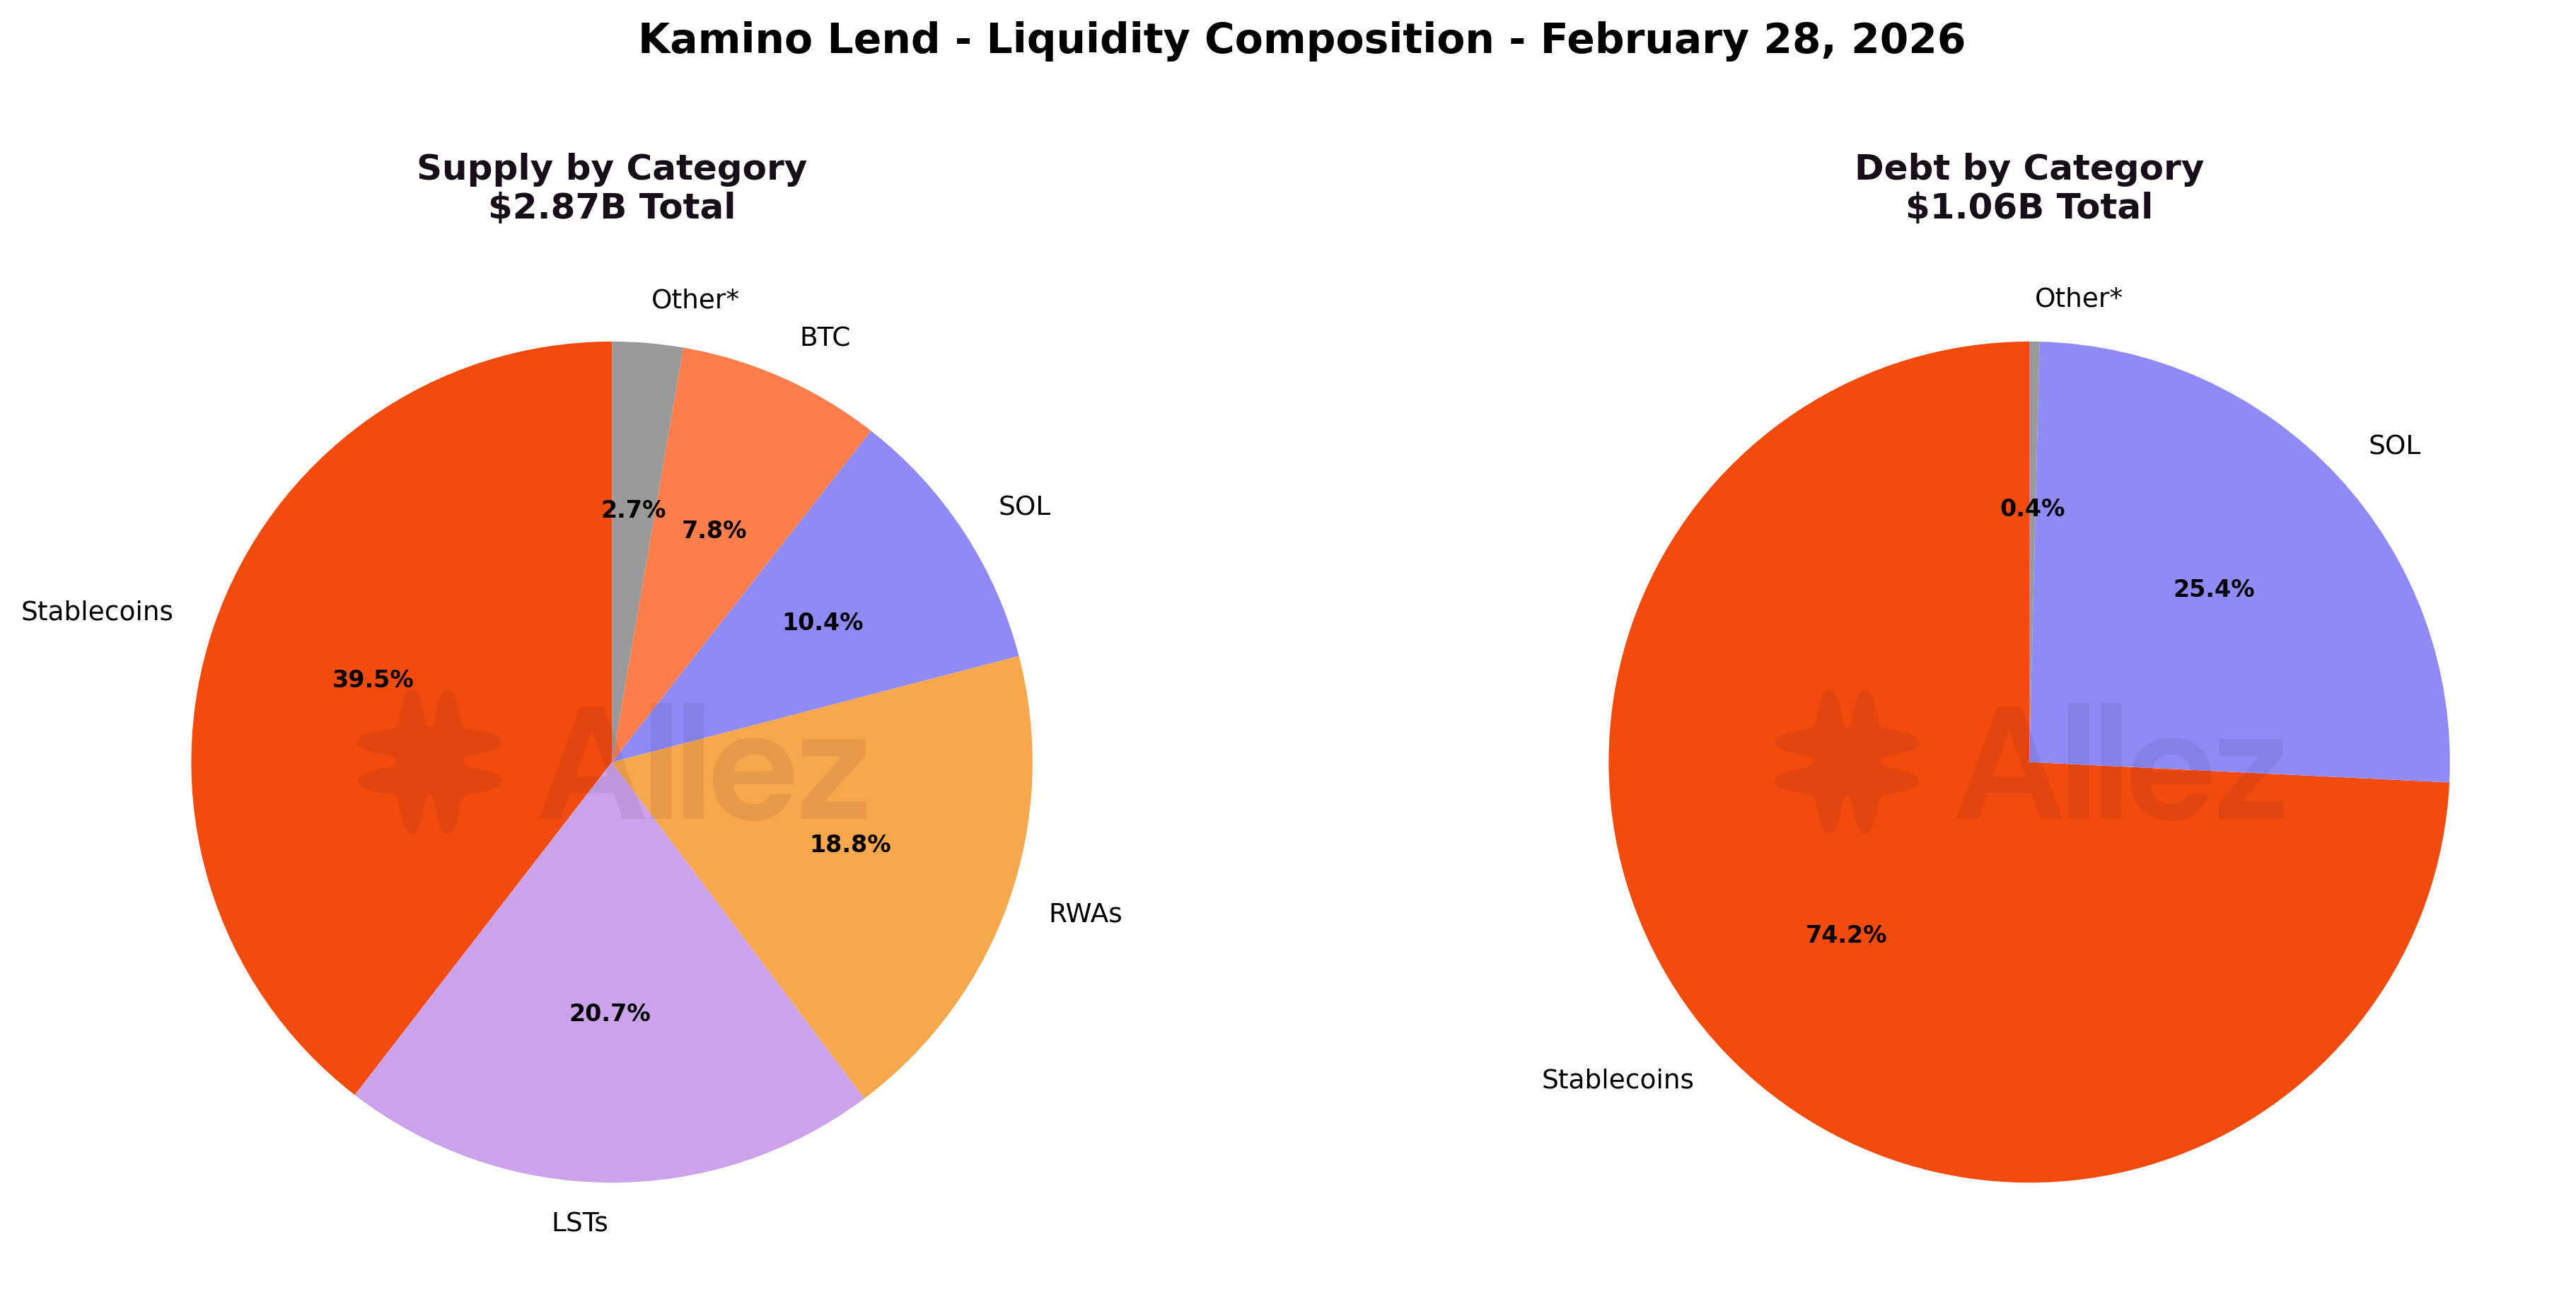
| Stablecoins | $1,135M | 39.5% | +4.5pp | $787M | 74.2% | +5.5pp |
| LSTs | $595M | 20.7% | -6.8pp | $2.2M | 0.2% | -0.1pp |
| RWAs | $540M | 18.8% | +6.0pp | $0.01M | <0.1% | - |
| SOL | $298M | 10.4% | -3.9pp | $269M | 25.4% | -5.4pp |
| BTC | $225M | 7.8% | +3.0pp | $1.2M | 0.1% | - |
| Other (JLP, ETH, memes, governance) | $78M | 2.7% | -2.7pp | $0.8M | 0.1% | - |
The category breakdown continues to shift through February. SOL + LSTs declined from 42% to 31% of supply as price depreciation reduced USD values, while RWAs grew from 13% to 19% and BTC from 5% to 8%. Stablecoins remain the dominant category at 40%, and account for 74% of all borrowing. The continued growth of USD-denominated supply (stablecoins + RWAs = 58%) confirms the structural diversification trend, with the protocol increasingly anchored to stable-value assets rather than SOL price exposure.
In SOL-denominated terms, the decline was more moderate: native SOL supply fell 14.3% (4.29M to 3.67M SOL), while total LST supply declined only 1.8% (5.14M to 5.05M tokens). The LST headline USD decline of -34.9% was therefore almost entirely driven by SOL price depreciation rather than actual user withdrawals. SOL debt contracted 7.2% in native terms (3.58M to 3.32M SOL), less than the 32.8% USD figure suggests.
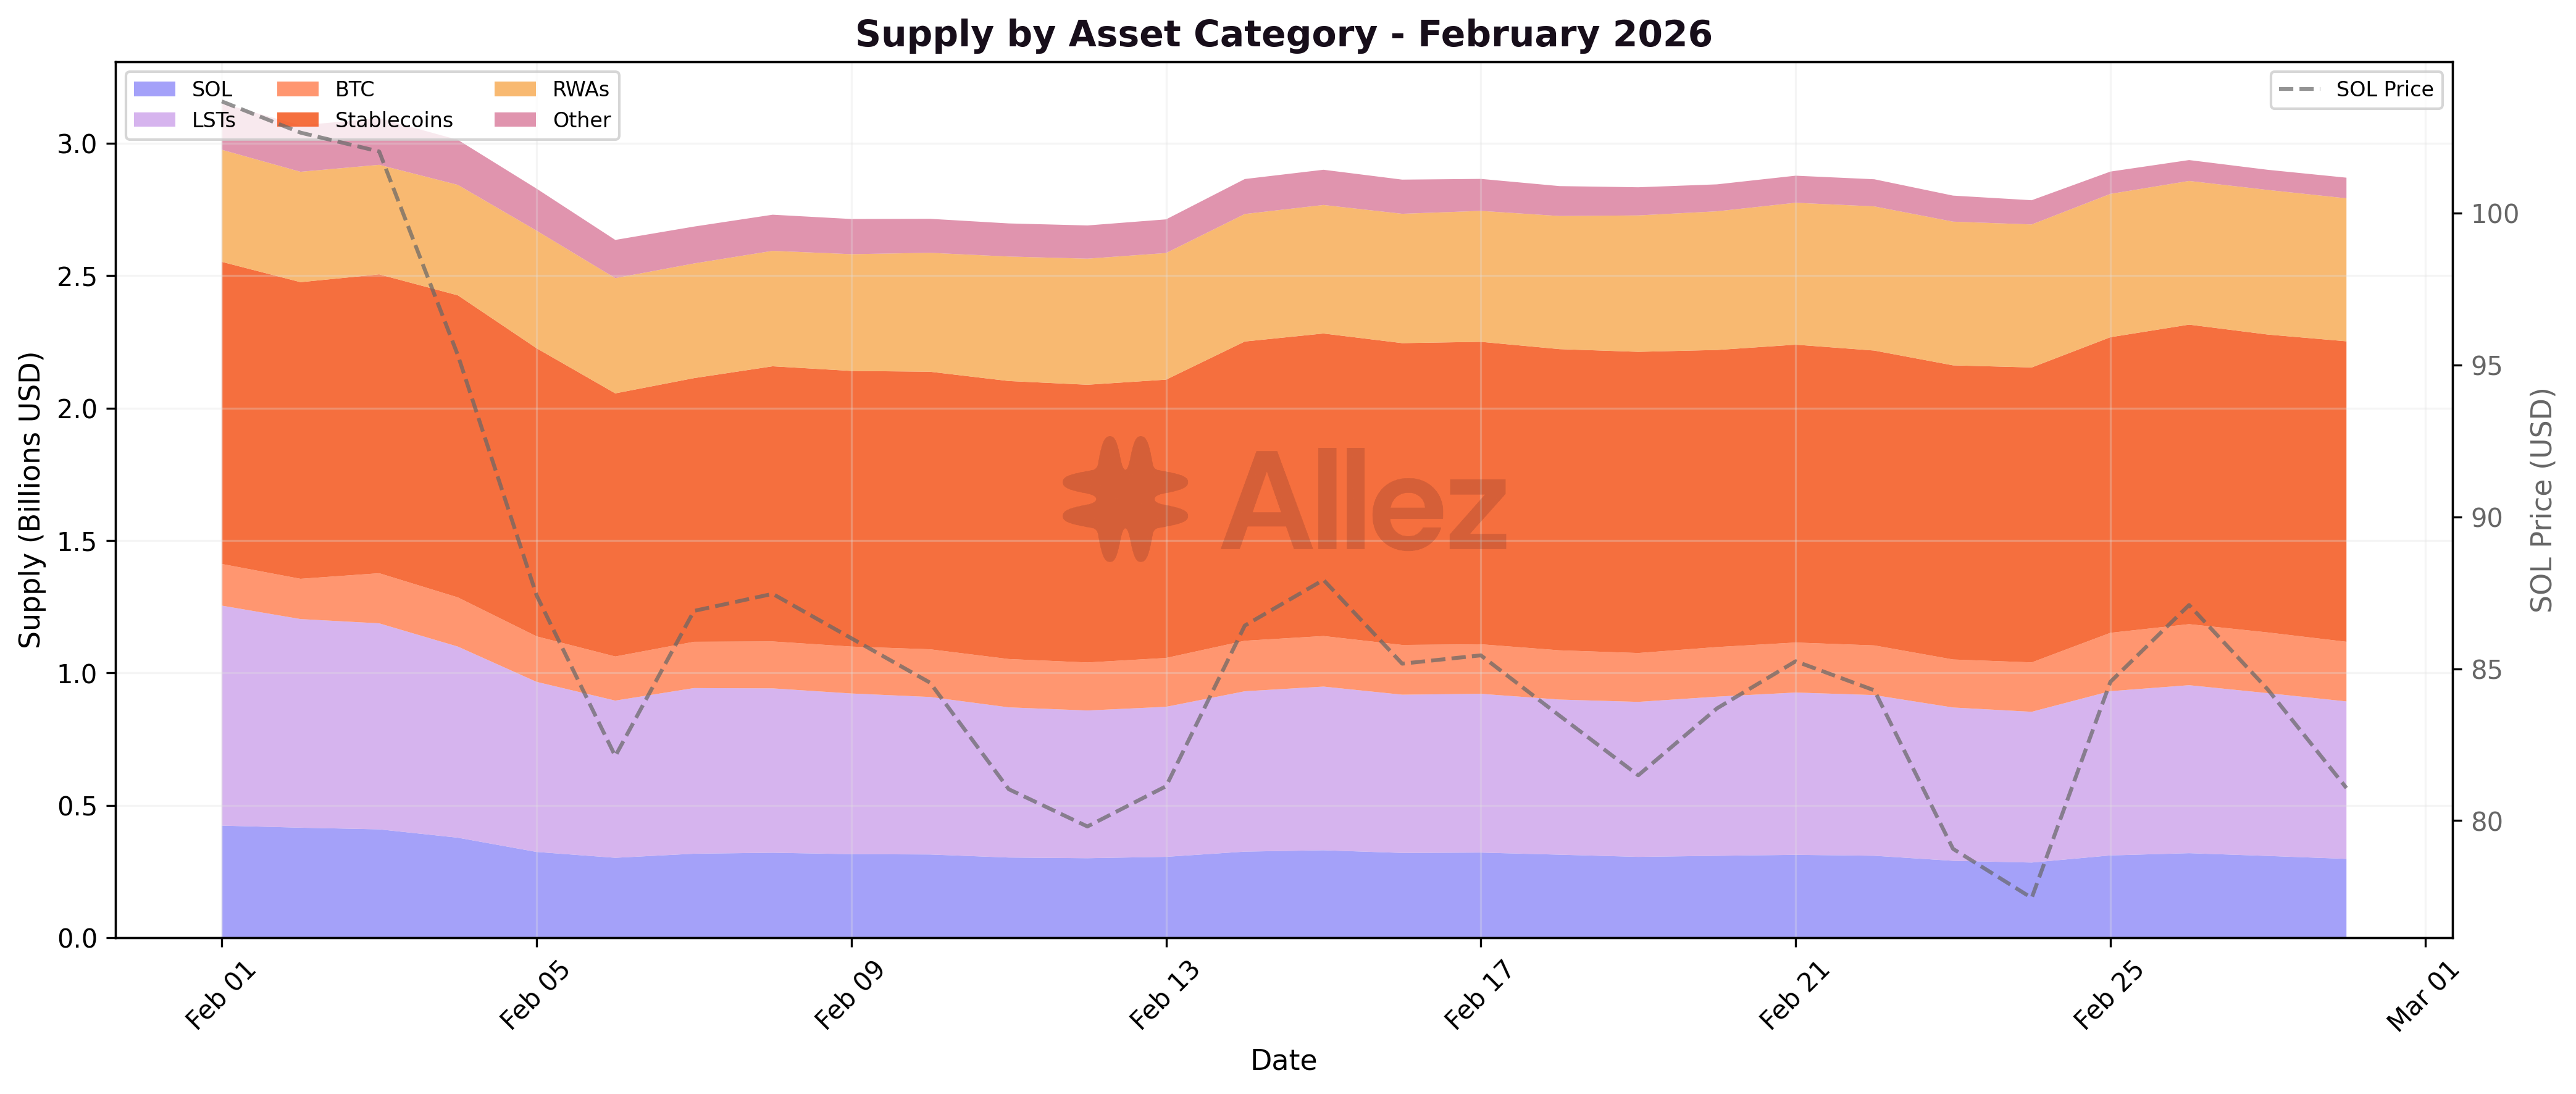
Daily category trends show a sharp step-down in SOL and LST supply on February 4-6, directly mirroring the price crash. RWA and BTC supply held steady or grew through the correction, demonstrating the countercyclical behavior of these asset classes. Stablecoin supply was essentially flat throughout.
Monthly supply changes by category:
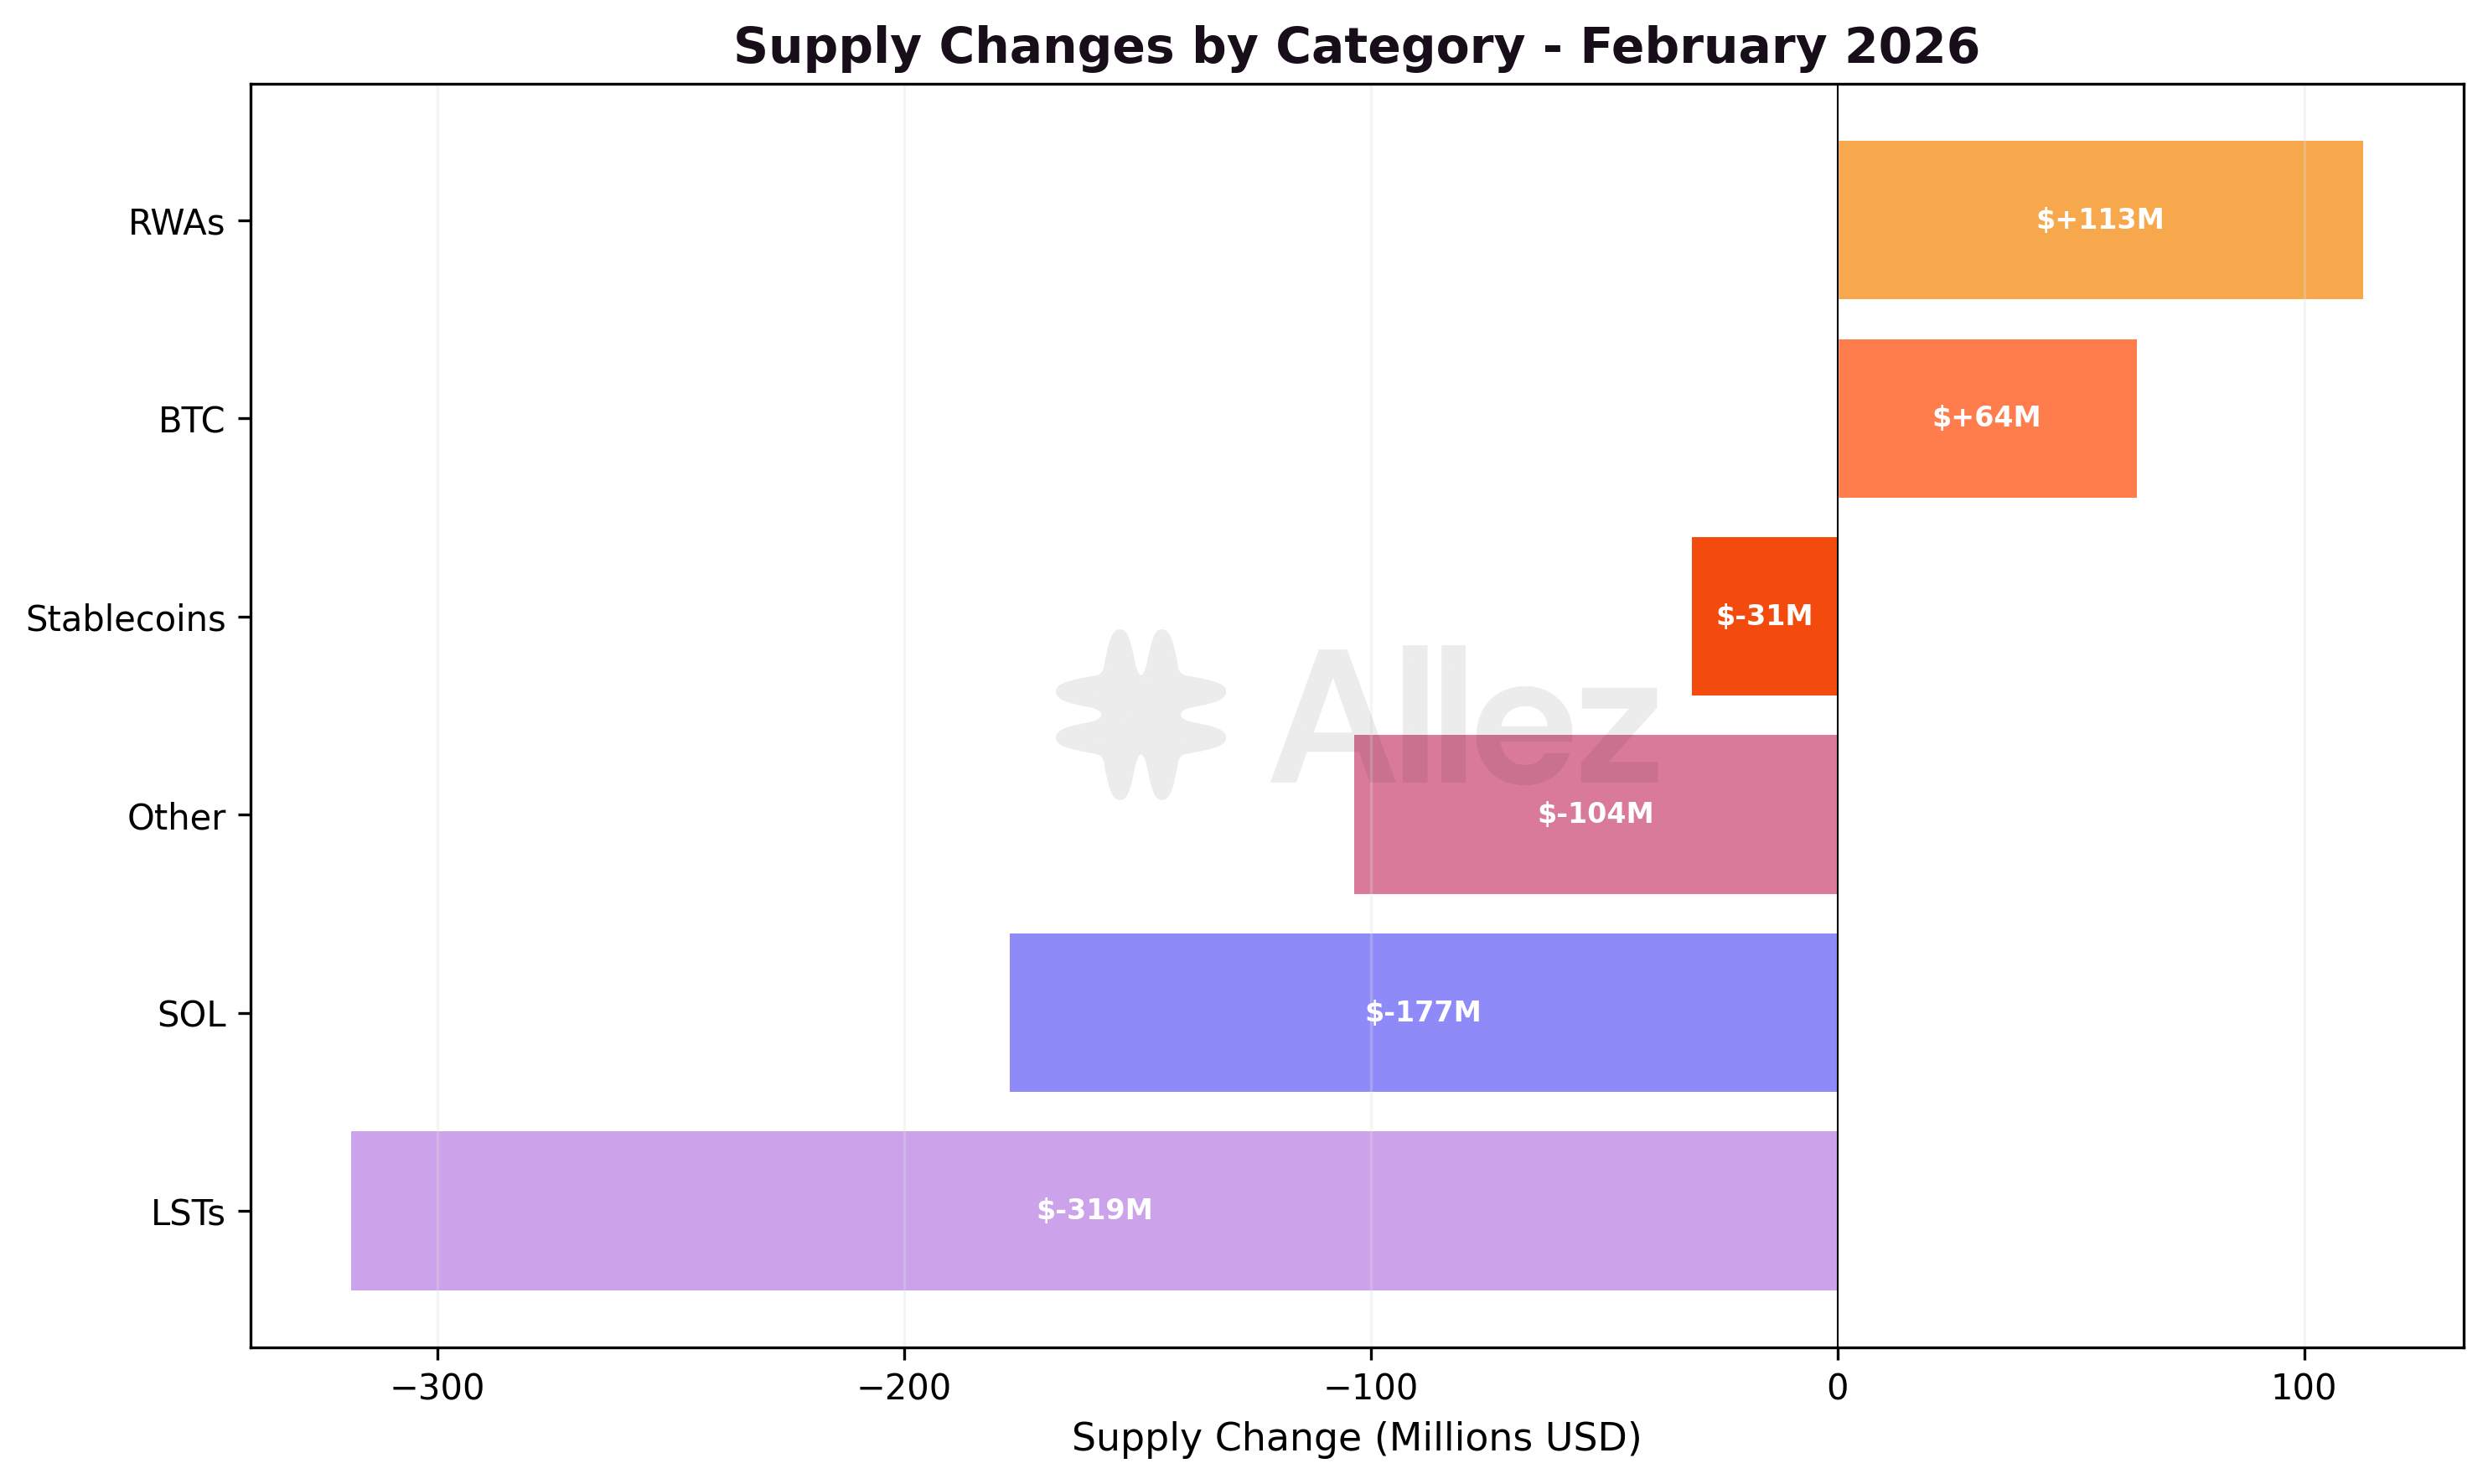
Key category-level movements (USD totals include both token flows and price effects):
-
SOL: USD supply fell $177M (-37.3%), largely driven by the 27.6% price drop which mechanically reduced USD values. In nominal terms (SOL-denominated), supply declined 14.3% from 4.29M to 3.67M SOL, and debt fell 7.2% from 3.58M to 3.32M SOL. The gap between the -37.3% USD and -14.3% nominal decline reflects the price effect. Net token outflows were $49M as users withdrew positions during the crash, while the remaining $128M USD decline was purely mechanical.
-
LSTs: USD supply fell $319M (-34.9%), the largest absolute decline. In nominal terms, total LST supply declined only 1.8% (5.14M to 5.05M tokens), meaning SOL price depreciation accounted for nearly all of the USD decline. Within LSTs, significant rotation occurred: JitoSOL -39.8%, mSOL -53.0%, and bSOL -40.0% in token terms, while dSOL +39.7%, fwdSOL +480%, and hSOL grew from near-zero to 228K tokens. This indicates rotation toward newer LSTs alongside net exits from legacy staking derivatives.
-
RWAs: Continued strong growth at +26.4%. PRIME (+$109M) was the single largest inflow across the protocol, driving Prime market to $575M. ONyc (+$16M) and USCC (+$19M, new entrant) also contributed. RWA supply is entirely decoupled from SOL price action.
-
BTC: Strongest relative growth at +39.8%. cbBTC supply nearly doubled (+$96M in token inflows to $194M), reflecting growing bitcoin collateral demand on Solana.
-
Stablecoins: Supply declined modestly (-2.6%). PYUSD (-$27M) and CASH (-$18M) continued their contraction, while USDC (+$28M), USDG (+$18M), and USDS (+$13M) grew. On the debt side, stablecoin borrowing declined notably: USDC debt -$49M, PYUSD debt -$17M, CASH debt -$19M, consistent with broad deleveraging.
-
Other: JLP token supply fell sharply (-$68M in outflows) as the leveraged perpetual market contracted following the February crash. The JLP market total (all assets) closed at $131M, while JLP token supply primarily drove the category's -57.0% USD decline.
Asset-level flows:
Note: Per-asset figures below reflect token quantity changes valued at current prices, isolating user deposit/withdrawal behavior. Category-level USD totals above also include the effect of price movements on existing positions.
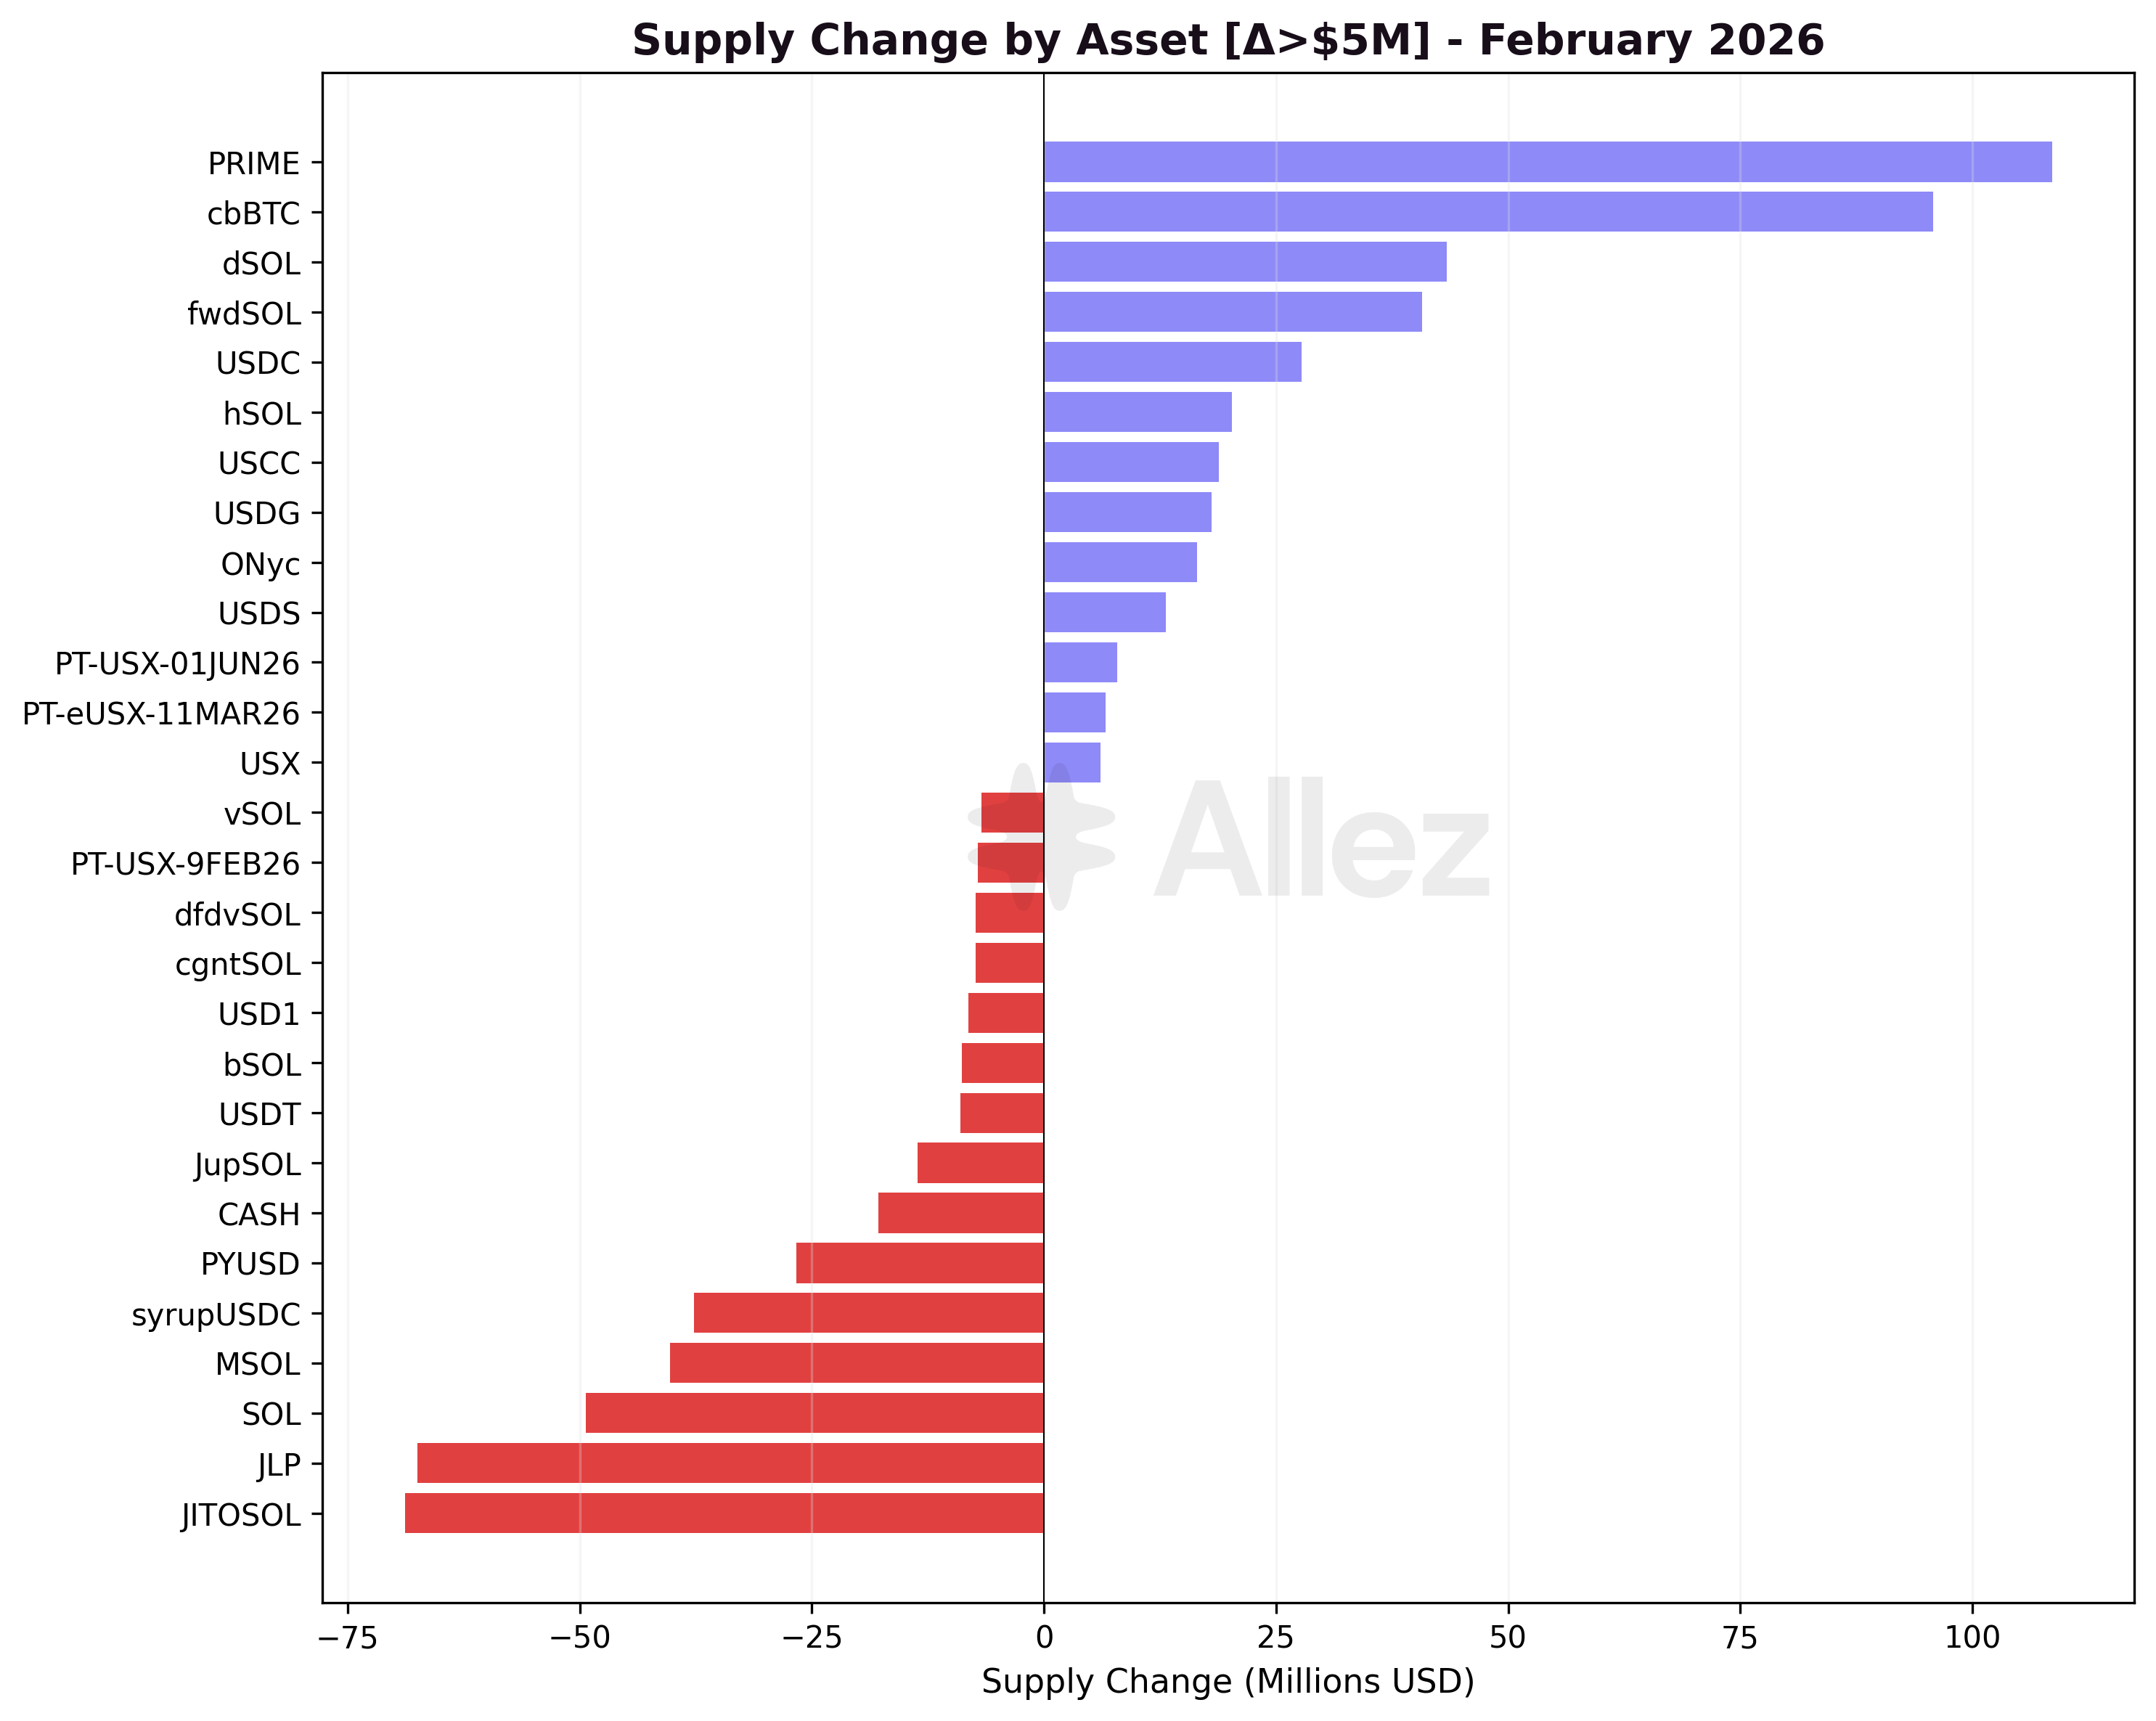
Major Inflows:
-
PRIME: +$109M supply - Strongest inflow; Prime market at $575M
-
cbBTC: +$96M supply - Bitcoin collateral demand nearly doubled
-
dSOL: +$43M supply - Growing as a staking derivative
-
fwdSOL: +$41M supply - New LST gaining traction
-
USDC: +$28M supply - Stablecoin rotation into USDC
-
hSOL: +$20M supply - New LST entrant
-
USCC: +$19M supply - New RWA entrant (tokenized credit)
Major Outflows:
-
JitoSOL: -$69M supply - LST deleveraging during crash
-
JLP: -$68M supply - Leveraged perp strategy unwind
-
SOL: -$49M supply - Withdrawals during crash
-
mSOL: -$40M supply - LST outflows
-
syrupUSDC: -$38M supply - Maple credit market contraction
-
PYUSD: -$27M supply - Continued rotation out
-
CASH: -$18M supply - Normalization continues
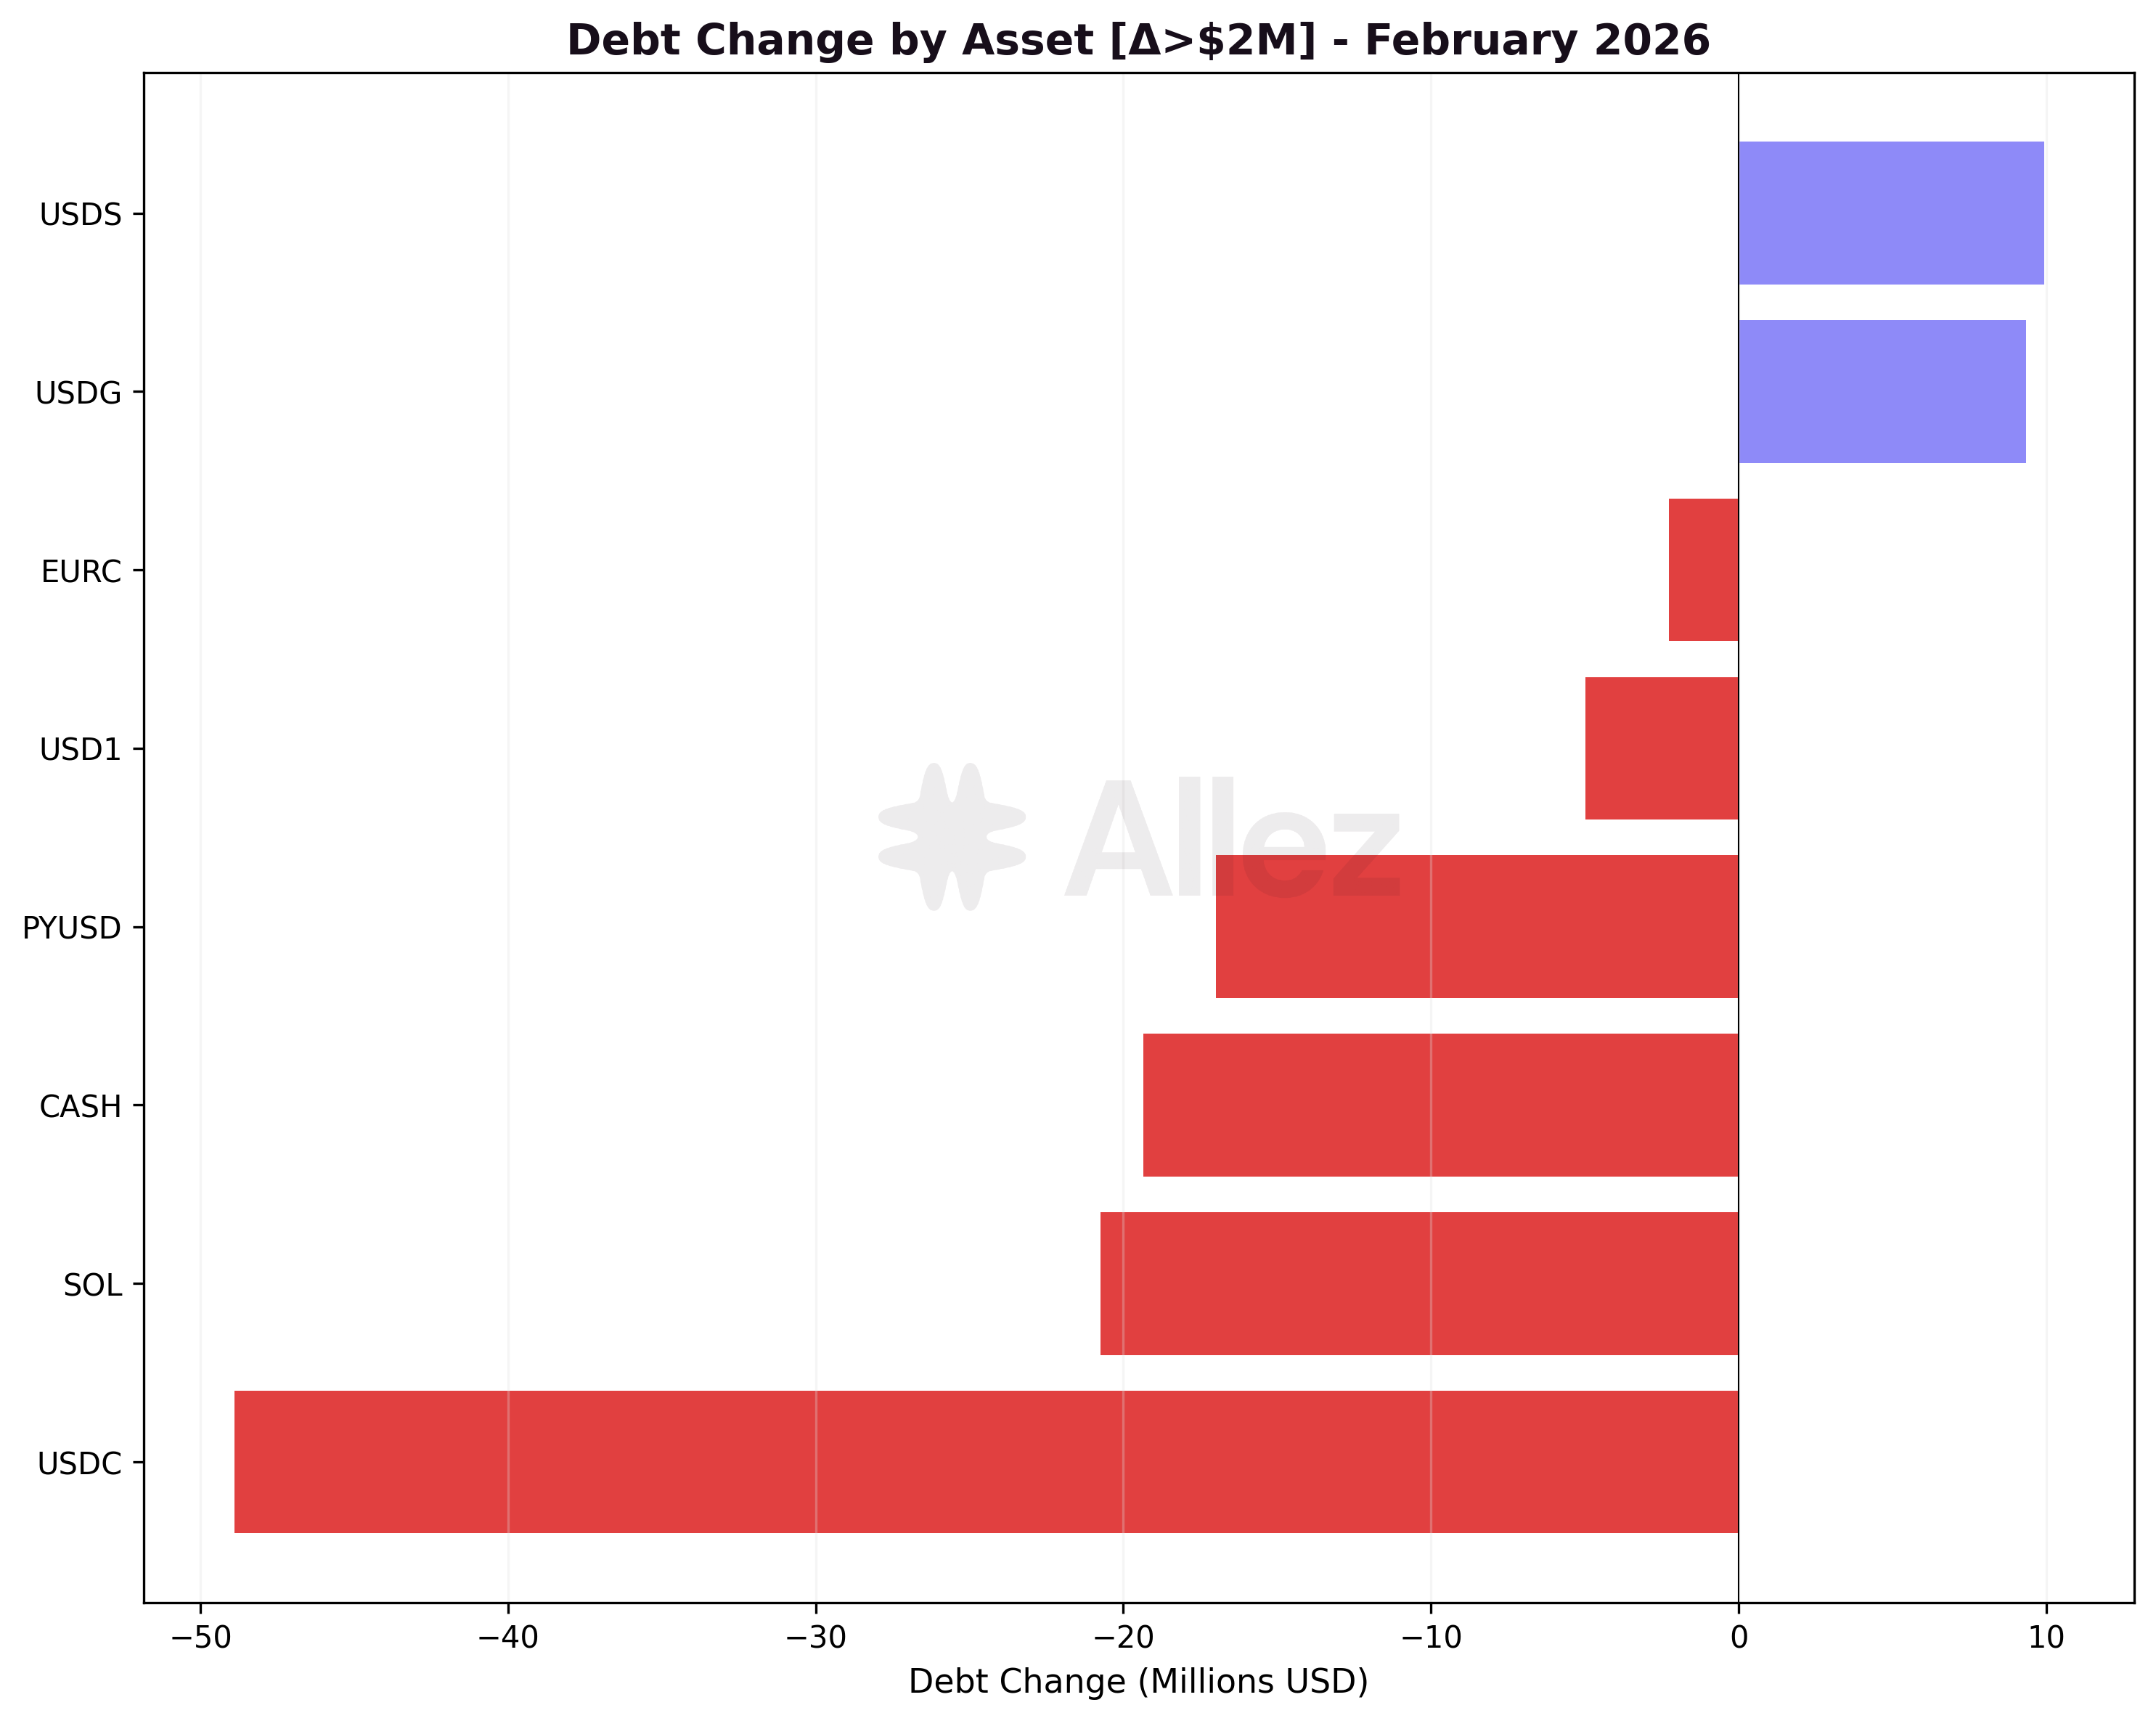
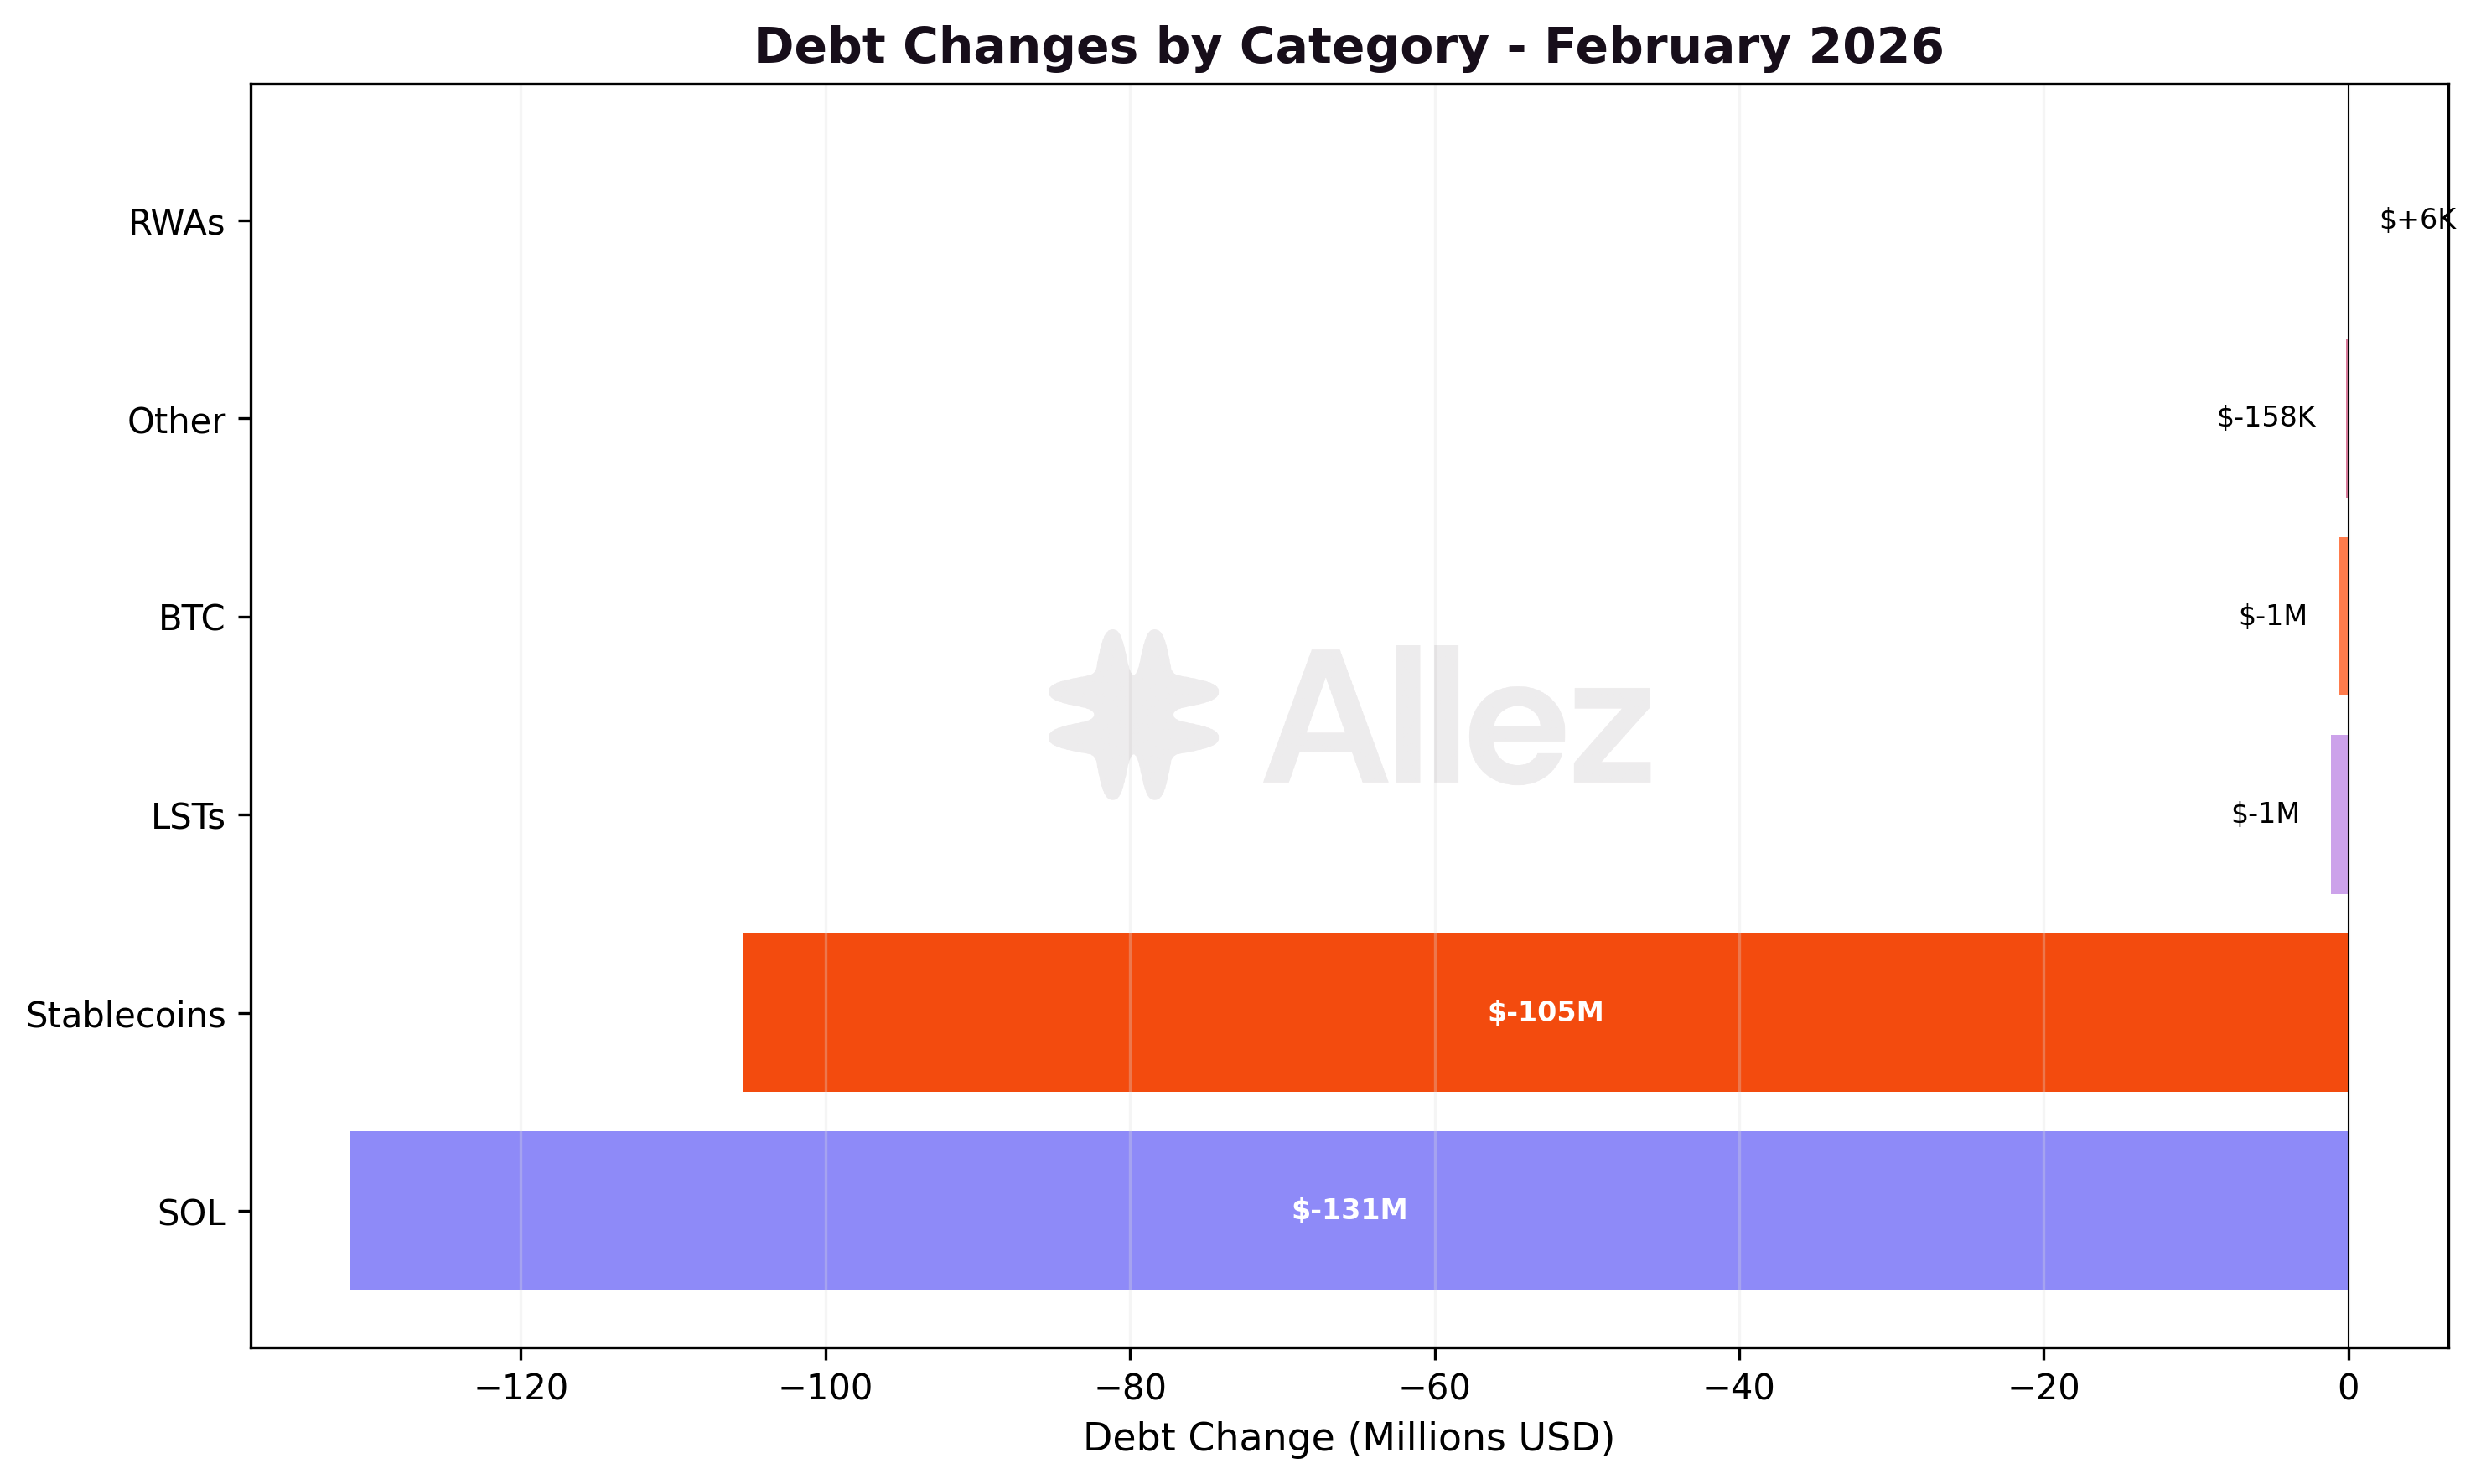
Debt declined across nearly all assets, reflecting systematic deleveraging. Per-asset debt figures below reflect token quantity changes:
-
USDC Debt: -$49M - Users repaying stablecoin borrows
-
SOL Debt: -$21M in token outflows - Unwinding of LST leverage strategies (native SOL asset only; the -$131M SOL category USD decline above includes price effects across native SOL debt positions)
-
CASH Debt: -$19M - Contraction in CASH ecosystem
-
PYUSD Debt: -$17M - Declining alongside supply
-
USDS Debt: +$9.9M - Expanding alongside USDS supply growth
-
USDG Debt: +$9.3M - Growing demand in OnRe and alternative markets
3. Risk & Liquidations
Distance to Liquidation: Correlated vs Uncorrelated Positions
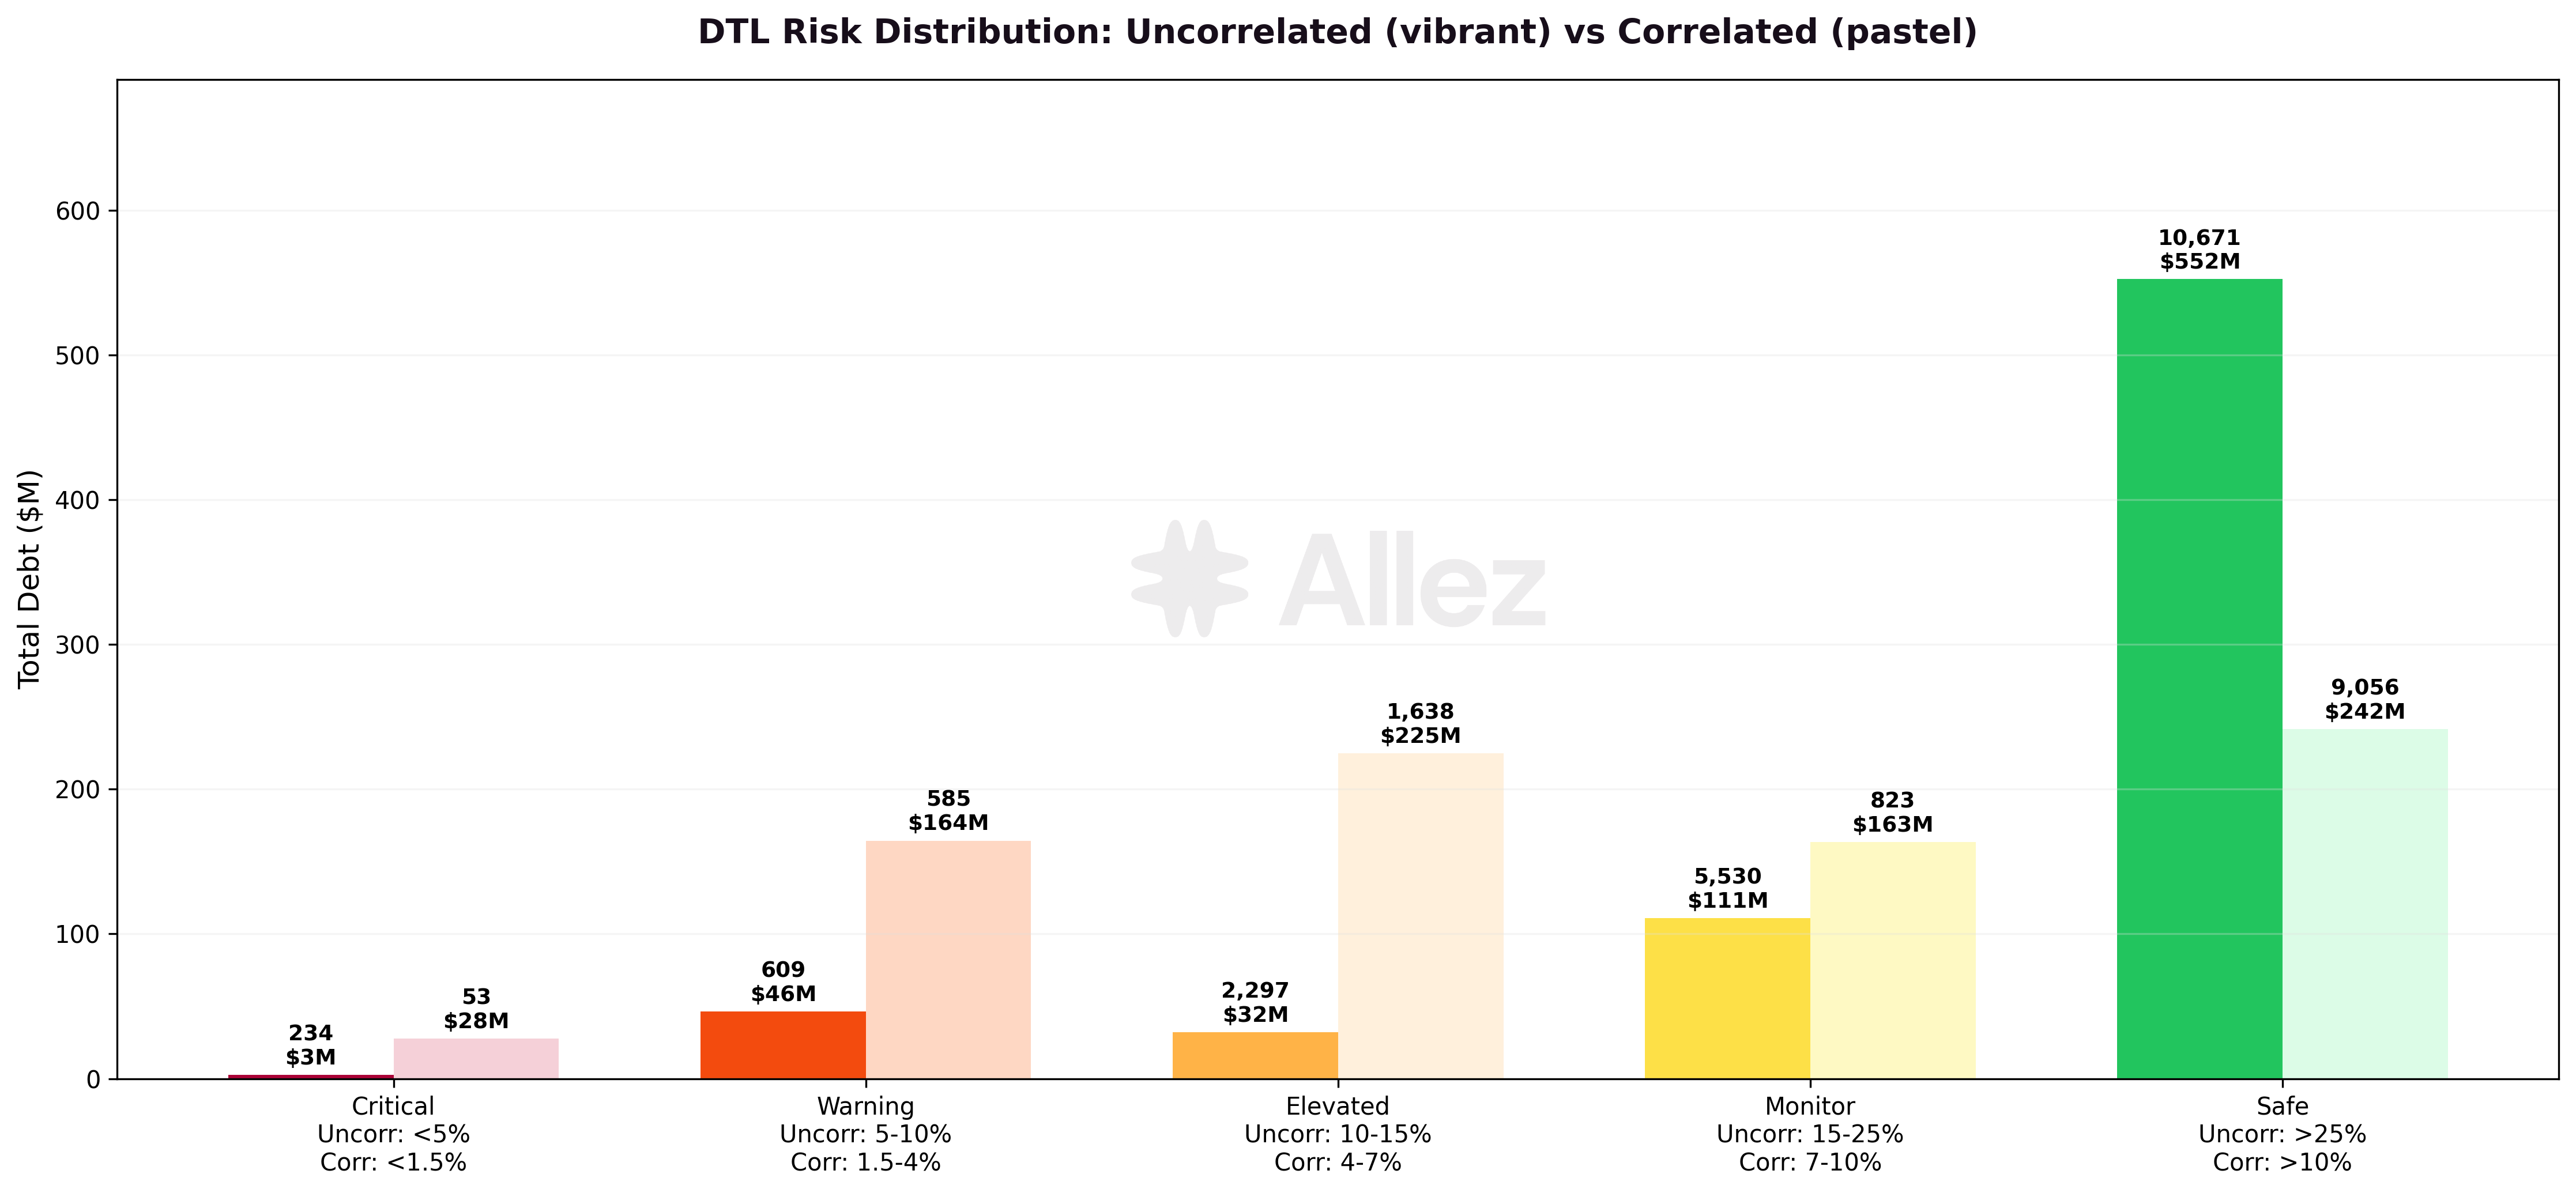
Position risk is assessed with different thresholds depending on whether collateral and debt are correlated or uncorrelated. Correlated positions (LST/SOL, RWA/stablecoin) have both sides moving together, reducing directional exposure, which is why tighter thresholds apply (<1.5% DTL for Critical vs <5% for uncorrelated).
Uncorrelated positions (SOL/USDC, BTC/USDC, JLP/USDC):
| Risk Tier | DTL Range | Debt Volume | Share | Jan Debt | MoM |
|---|---|---|---|---|---|
| Critical | <5% | $2.6M | 0.4% | $2.3M | +13% |
| Warning | 5-10% | $46.3M | 6.2% | $15.7M | +195% |
| Elevated | 10-15% | $32.3M | 4.3% | $46.3M | -30% |
| Monitor | 15-25% | $111.1M | 14.9% | $136.2M | -18% |
| Safe | >25% | $552.3M | 74.2% | $717.5M | -23% |
Correlated positions (LST/SOL, RWA/stablecoin, stablecoin/stablecoin):
| Risk Tier | DTL Range | Debt Volume | Share | Jan Debt | MoM |
|---|---|---|---|---|---|
| Critical | <1.5% | $27.6M | 3.4% | $0.16M | +17K% |
| Warning | 1.5-4% | $164.5M | 20.0% | $93.7M | +76% |
| Elevated | 4-7% | $224.8M | 27.4% | $177.7M | +27% |
| Monitor | 7-10% | $163.4M | 19.9% | $104.5M | +56% |
| Safe | >10% | $241.6M | 29.4% | $404.7M | -40% |
The uncorrelated profile shifted towards lower margins versus January. While Critical-tier debt remained contained at $2.6M (vs $2.3M), the Warning tier grew from $15.7M to $46.3M (+195%) as surviving positions were compressed into narrower buffers by the price decline. The Safe tier contracted from $717M to $552M (-23%), reflecting both position closures and downward migration into higher-risk tiers.
The correlated picture shifted more notably. Critical-tier debt moved from $0.16M to $27.6M, driven almost entirely by a single large JitoSOL/SOL position on Jito market ($27.2M debt at 0.6% DTL). Warning-tier debt increased from $93.7M to $164.5M, reflecting RWA markets (Prime, OnRe) where high LTV parameters concentrate positions in narrow DTL bands. Despite the higher concentration in mid-risk tiers, correlated positions remain structurally lower risk as both sides move together. Under normal conditions this reduces liquidation risk; however, position health can deteriorate if borrow costs exceed the asset's intrinsic yield, which may gradually erode buffers over time.
February Liquidations by Collateral Type:
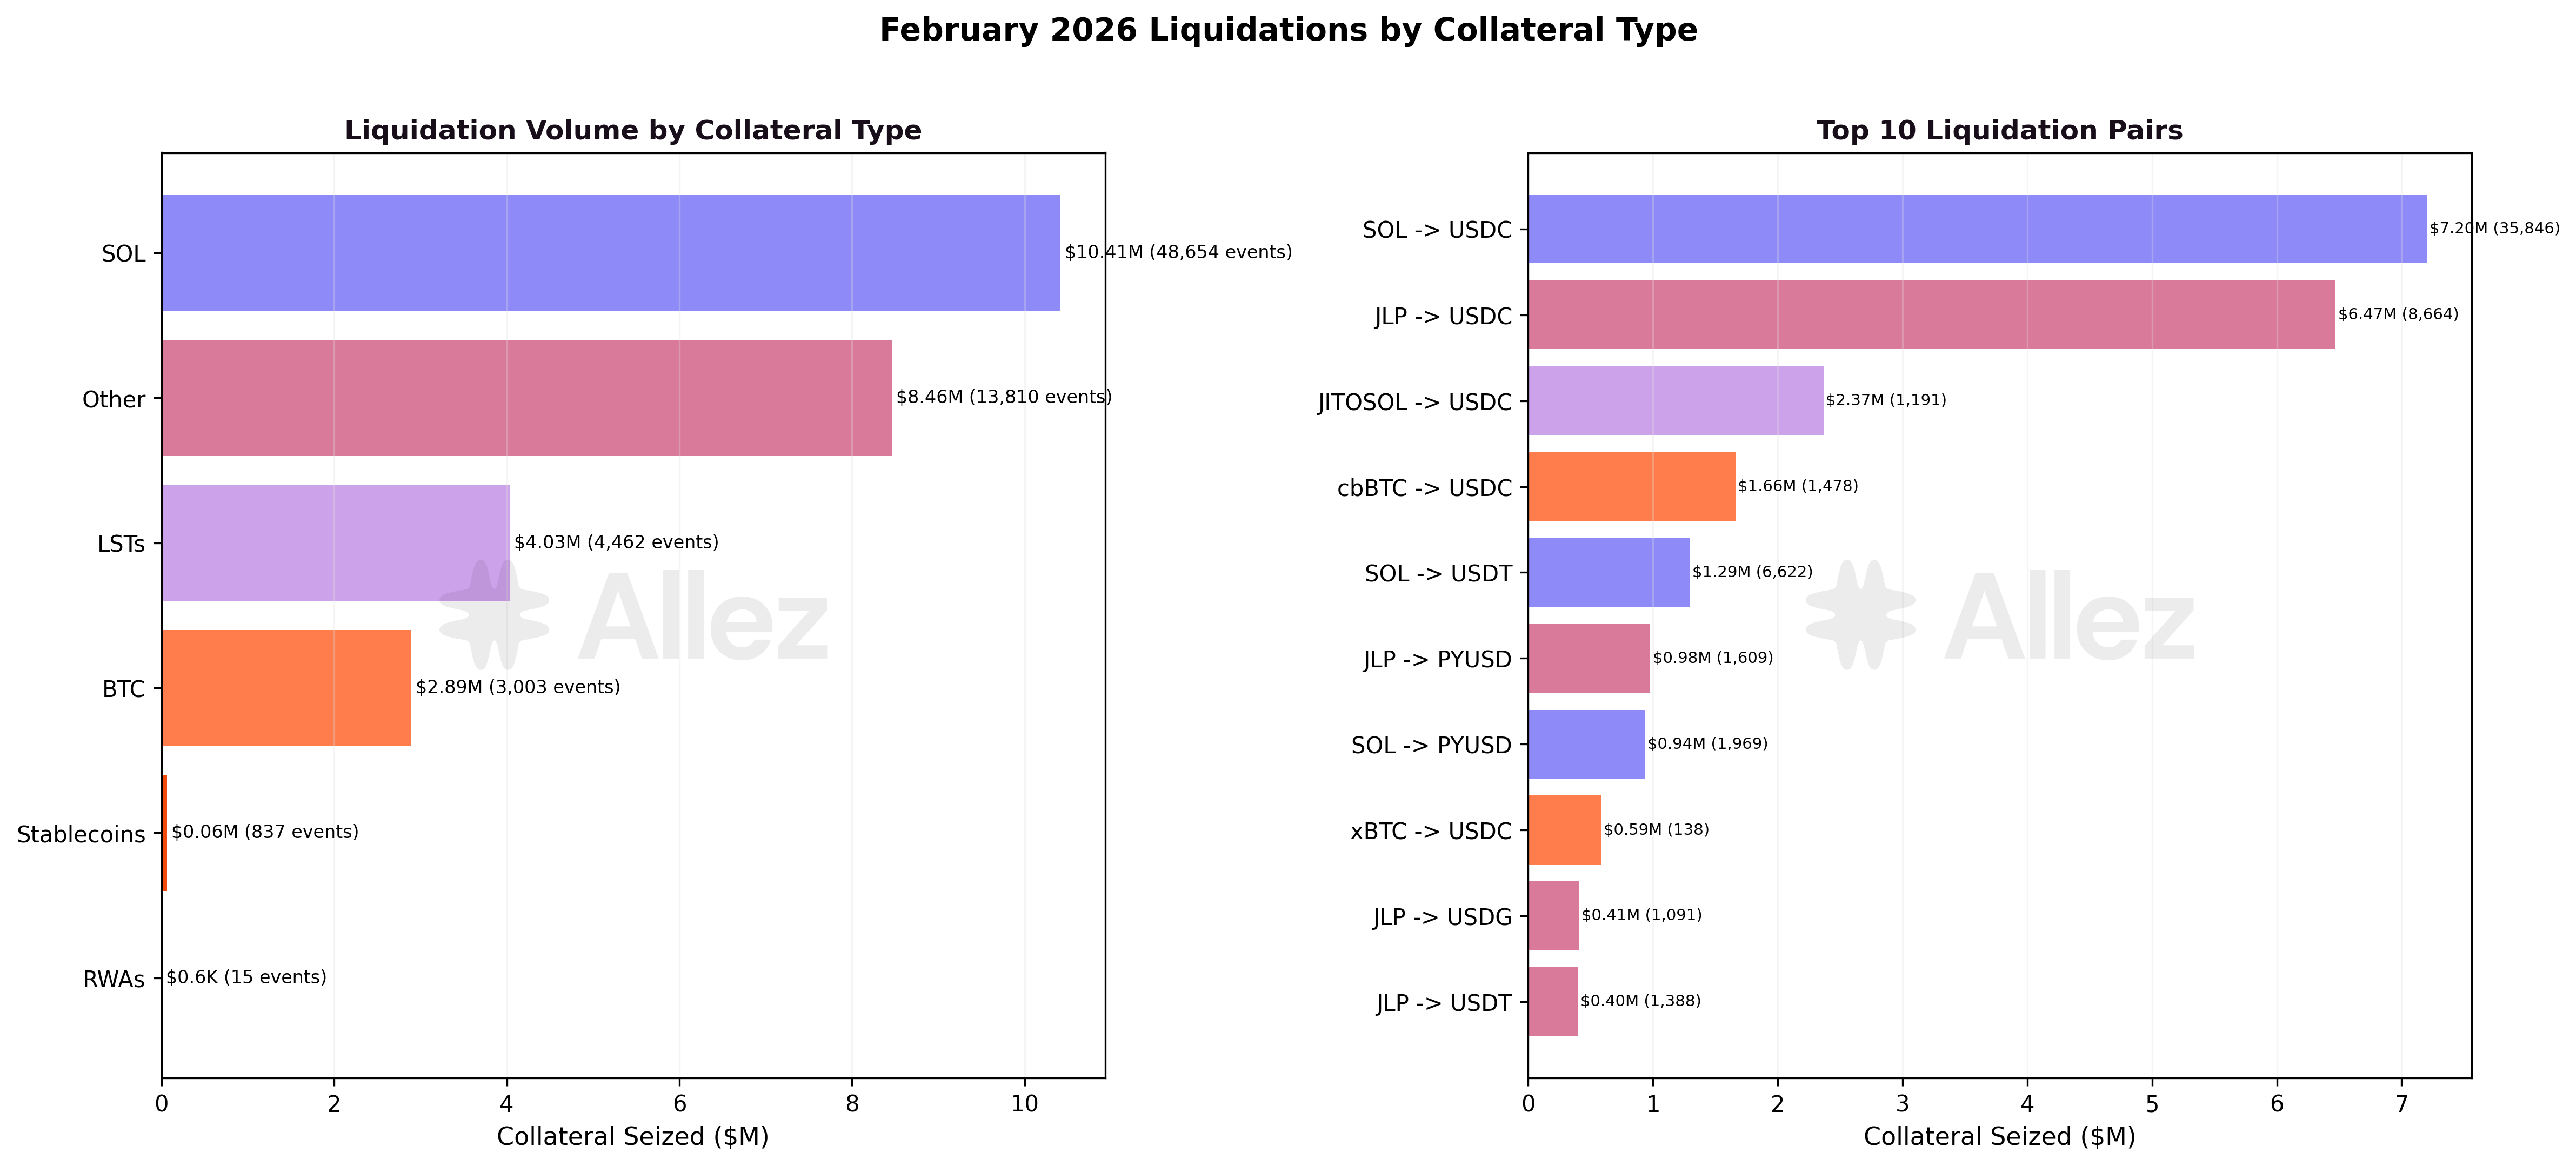
By category, SOL collateral dominated at $10.4M seized (40%), followed by Other at $8.5M (33%, driven almost entirely by JLP), LSTs at $4.0M (16%), and BTC at $2.9M (11%). At the individual asset level, SOL ($10.4M), JLP ($8.3M), JitoSOL ($2.8M), cbBTC ($1.8M), and xBTC ($0.9M) were the top five collateral types liquidated. JLP positions faced compounding pressure as the underlying basket (SOL, ETH, BTC) lost value during the crash. BTC liquidations ($2.9M combined) represent a new pattern, as bitcoin collateral had minimal liquidation activity in January.
Liquidation summary:
| Metric | February | January | MoM Change |
|---|---|---|---|
| Total events | 70,822 | 14,355 | +393% |
| Collateral seized | $26.0M | $15.2M | +71% |
| Debt repaid | $25.7M | $15.0M | +71% |
| Max unique liquidators | 166 | 172 | -3% |
| Avg liquidation size | $367 | $1,057 | -65% |
February saw nearly 5x January's liquidation events but only 1.7x the collateral volume. The average liquidation size dropped 65% to $367, which may reflect both a broader base of small retail positions being liquidated and a shift in liquidation bot strategies (bots splitting larger positions into multiple smaller transactions for execution efficiency). A pool of 166 unique liquidators absorbed the load, demonstrating that Kamino's liquidation bot infrastructure scales efficiently regardless of event volume. The $0.3M spread between collateral seized and debt repaid represents a 1.1% average bonus as a share of liquidated position size.
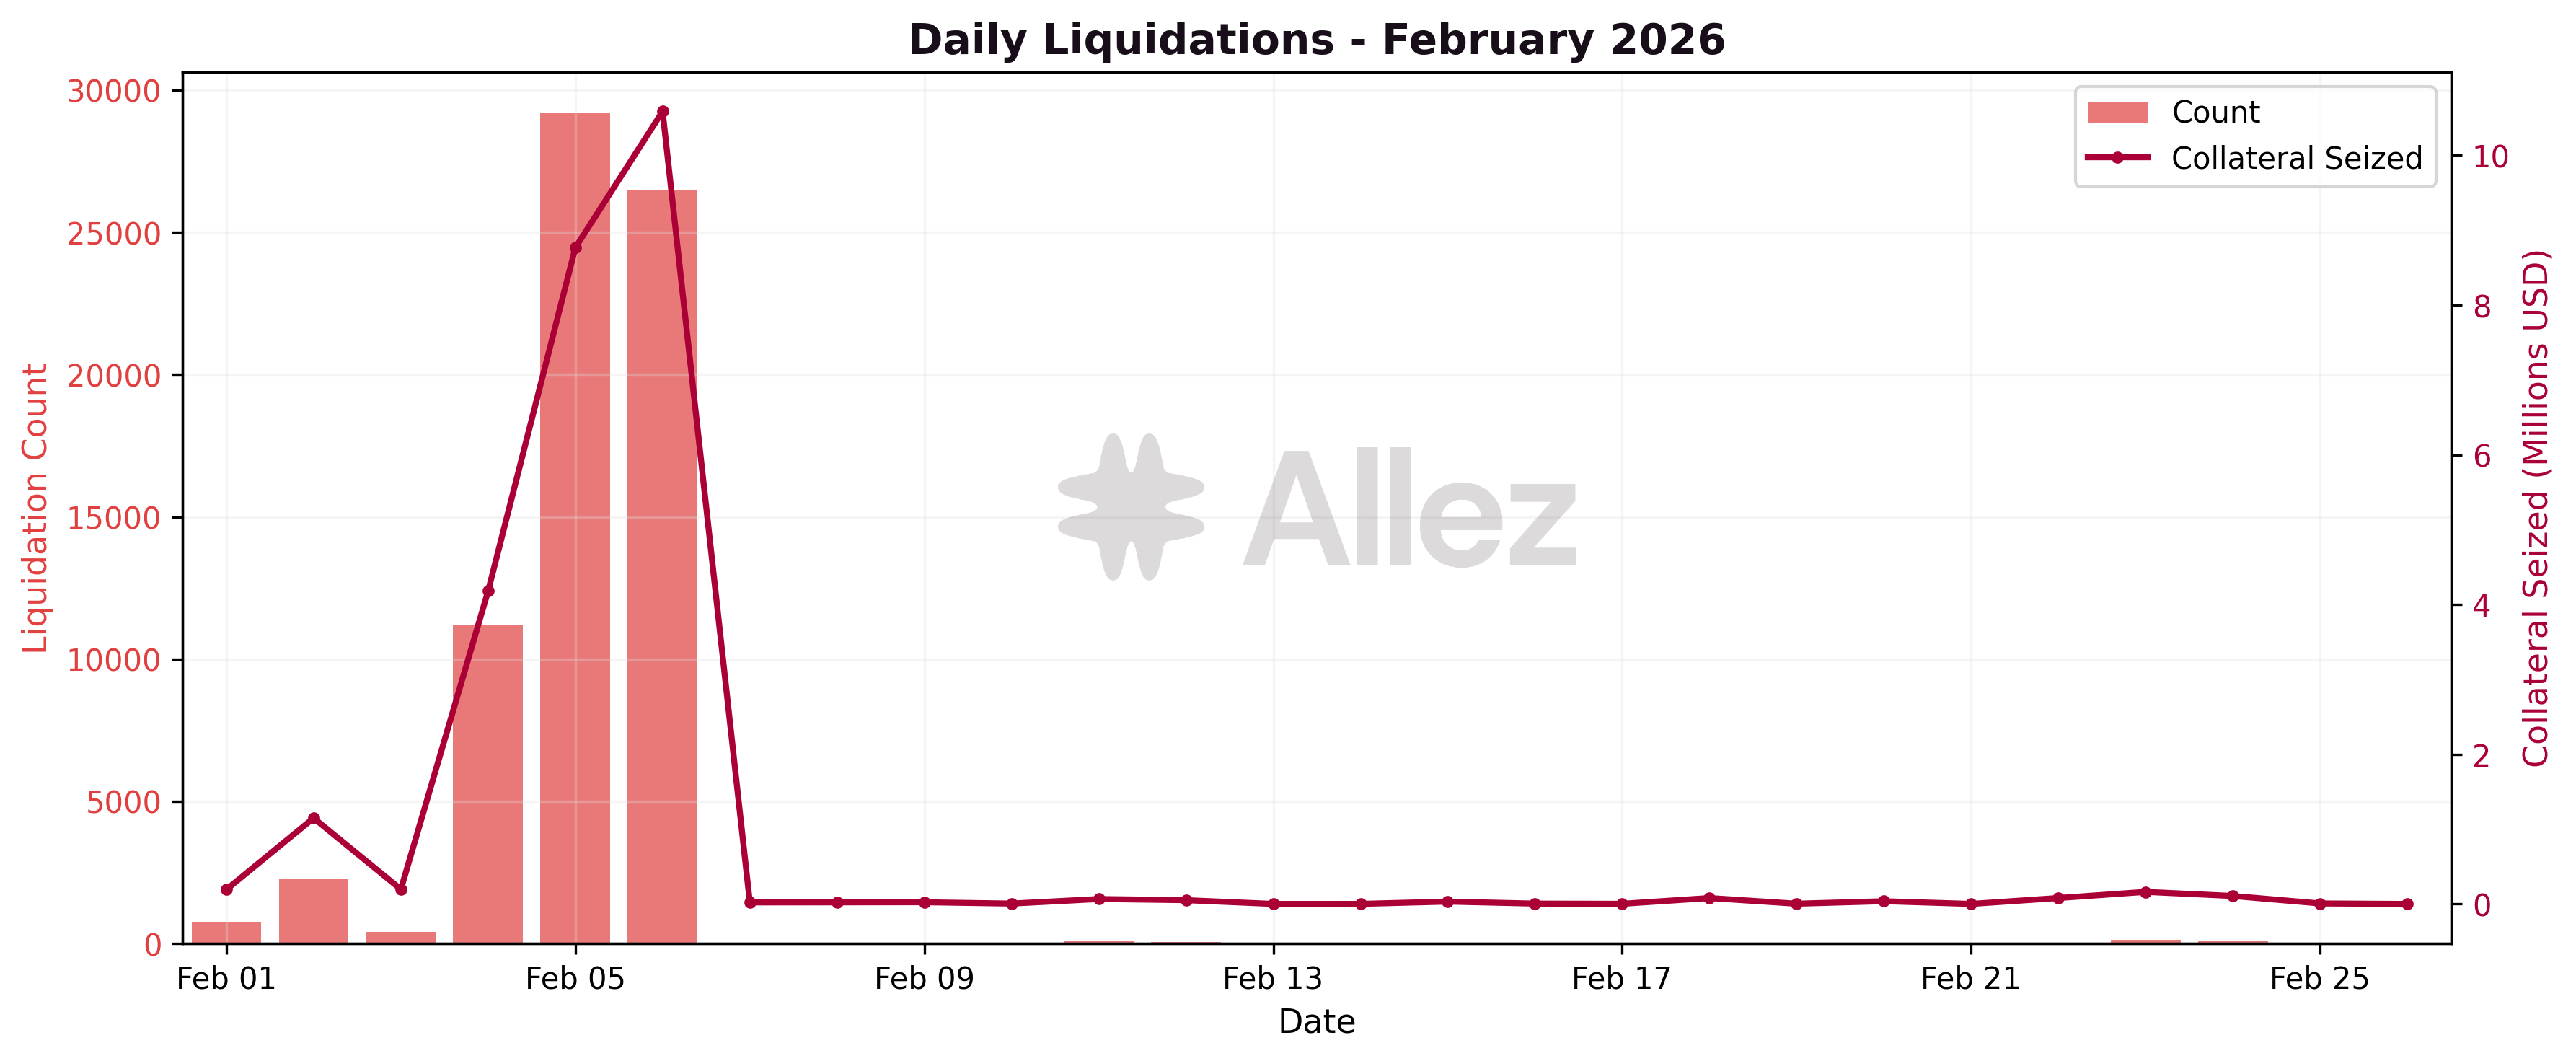
February 4-6 Crash Event:
The core of February's liquidation activity concentrated in three days as SOL declined from $99 to $68:
| Date | Events | Collateral Seized | Debt Repaid | SOL Price |
|---|---|---|---|---|
| Feb 4 | 11,199 | $4.2M | $4.1M | $89-99 |
| Feb 5 | 29,185 | $8.8M | $8.7M | $78-93 |
| Feb 6 | 26,464 | $10.6M | $10.5M | $68-90 |
| Total | 66,848 | $23.5M | $23.3M |
February 5 and 6 each individually exceeded January's entire monthly liquidation event count (14,355). February 6 set a single-day record with $10.6M in collateral seized across 26,464 events. Despite this elevated volume, the protocol operated without disruption and incurred zero bad debt.
Outside the crash window, the remaining 25 days of February saw only 3,974 events and $2.5M in collateral seized (averaging ~159 events/day vs. ~22,283/day during the crash), indicating that the correction effectively cleared out vulnerable positions and left a healthier risk profile.
Liquidation Volume by Size:
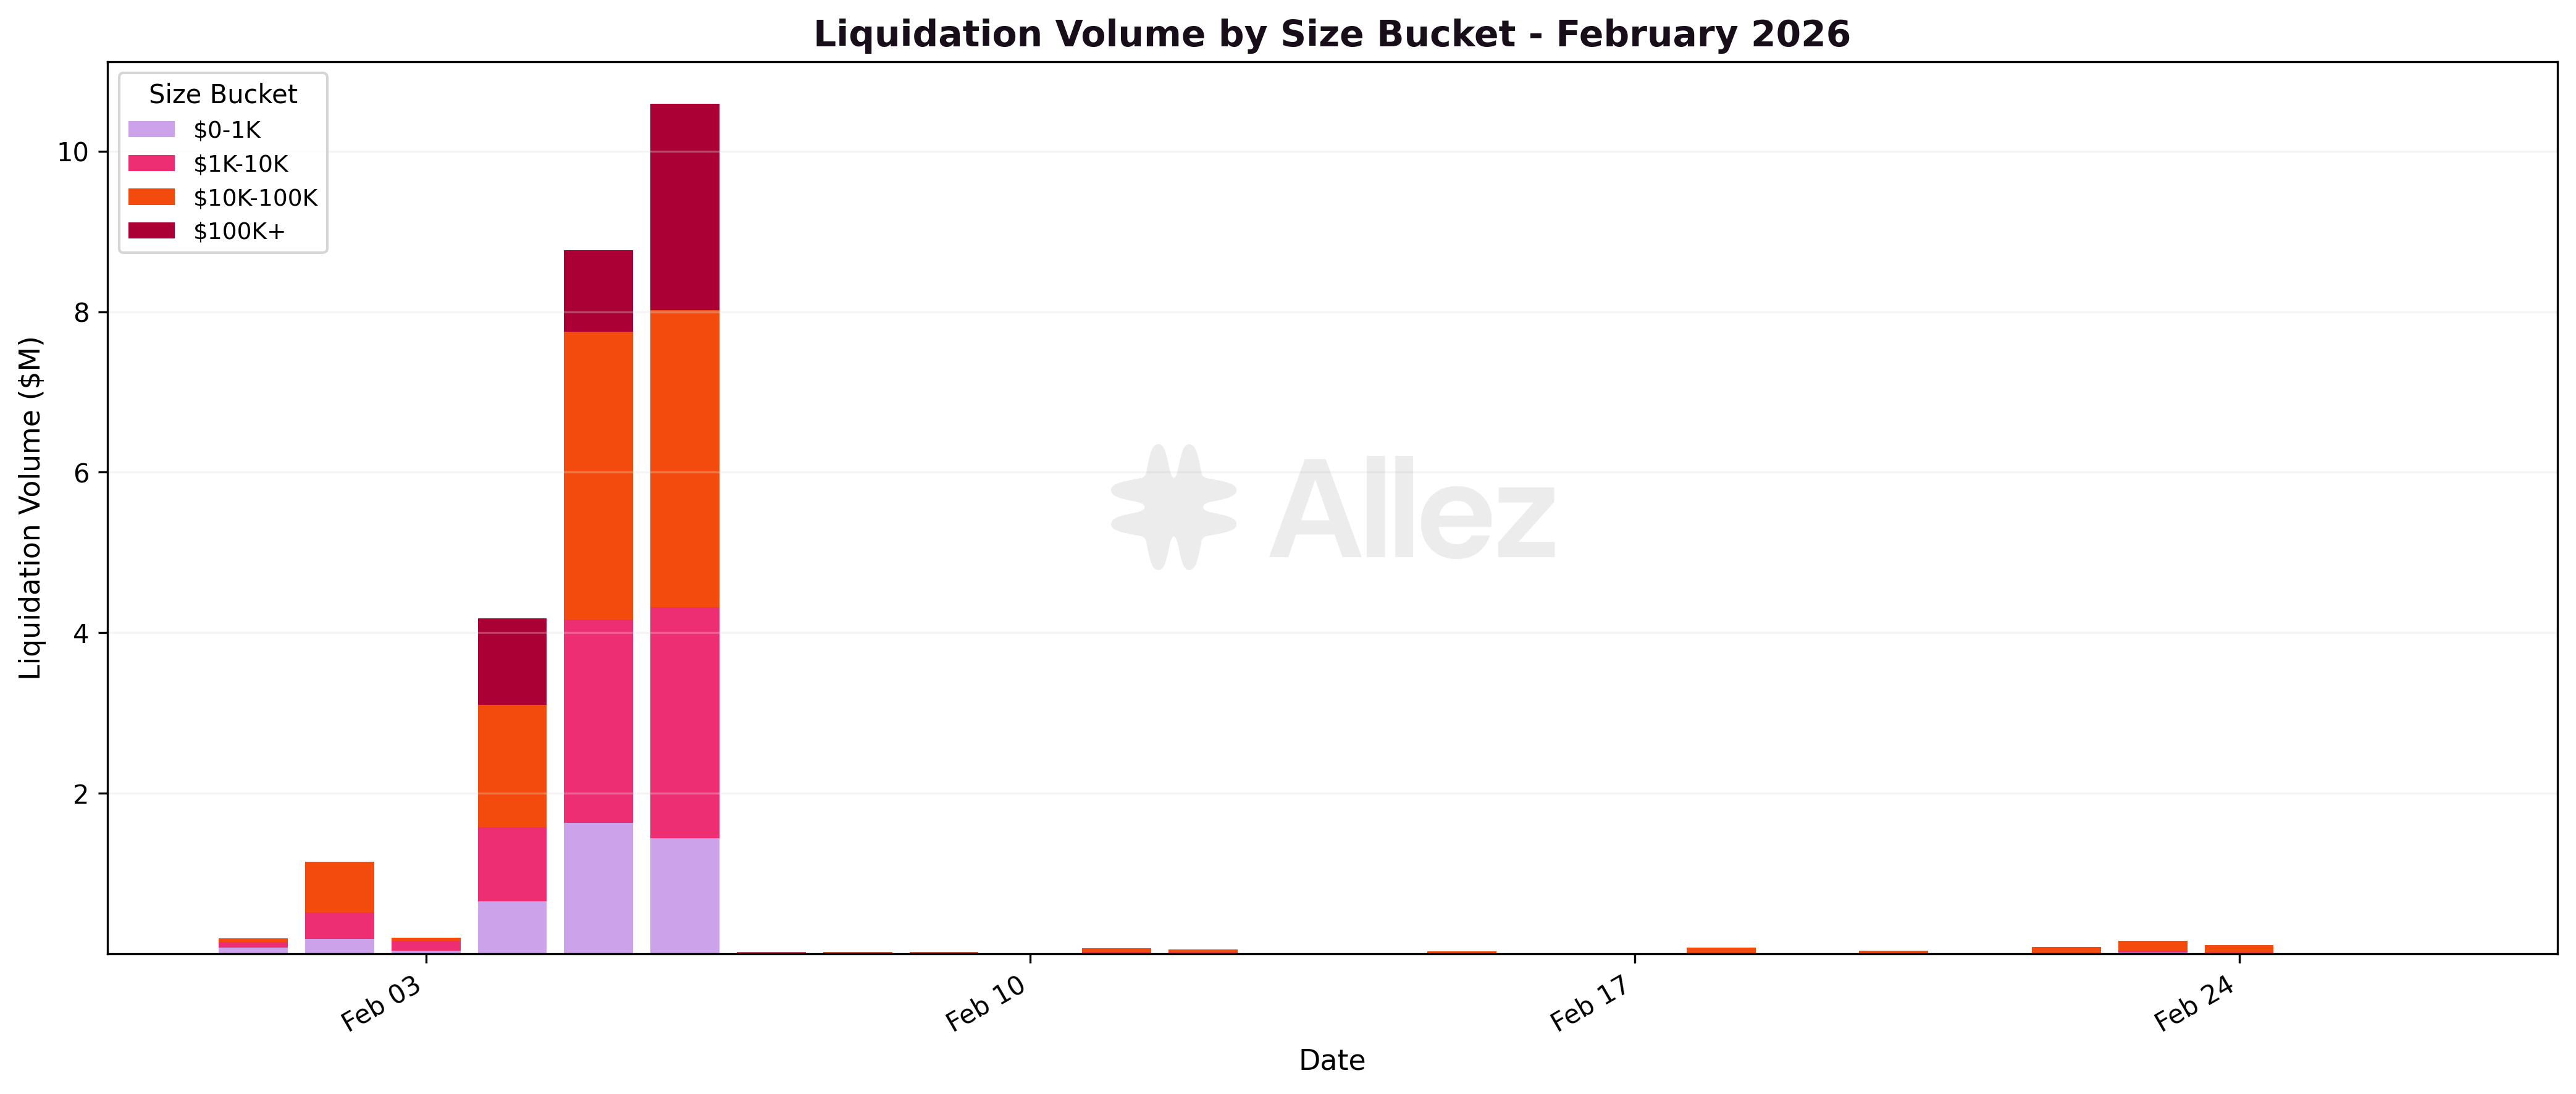
| Size Bucket | Events | Volume | Share | MoM Volume | Avg Size |
|---|---|---|---|---|---|
| $10K-100K | 372 | $10.3M | 40% | +126% | $28K |
| $1K-10K | 2,596 | $7.0M | 27% | +123% | $2.7K |
| $100K+ | 29 | $4.7M | 18% | -24% | $161K |
| $0-1K | 67,825 | $4.1M | 16% | +197% | $60 |
The distribution evolved compared to January: the $10K-100K bucket now leads in volume (40%, up from 30%), while $100K+ declined from 40% to 18%. Sub-$1K events represent 96% of all liquidations but only 16% of volume. This is consistent with the crash impacting a broad base of small positions: sub-$1K events surged from 13,009 in January to 67,825 (+421%), while $100K+ events rose only marginally (24 to 29). The decline in average size within each bucket may also partly reflect changes in liquidation bot execution strategies.
Stress Testing:
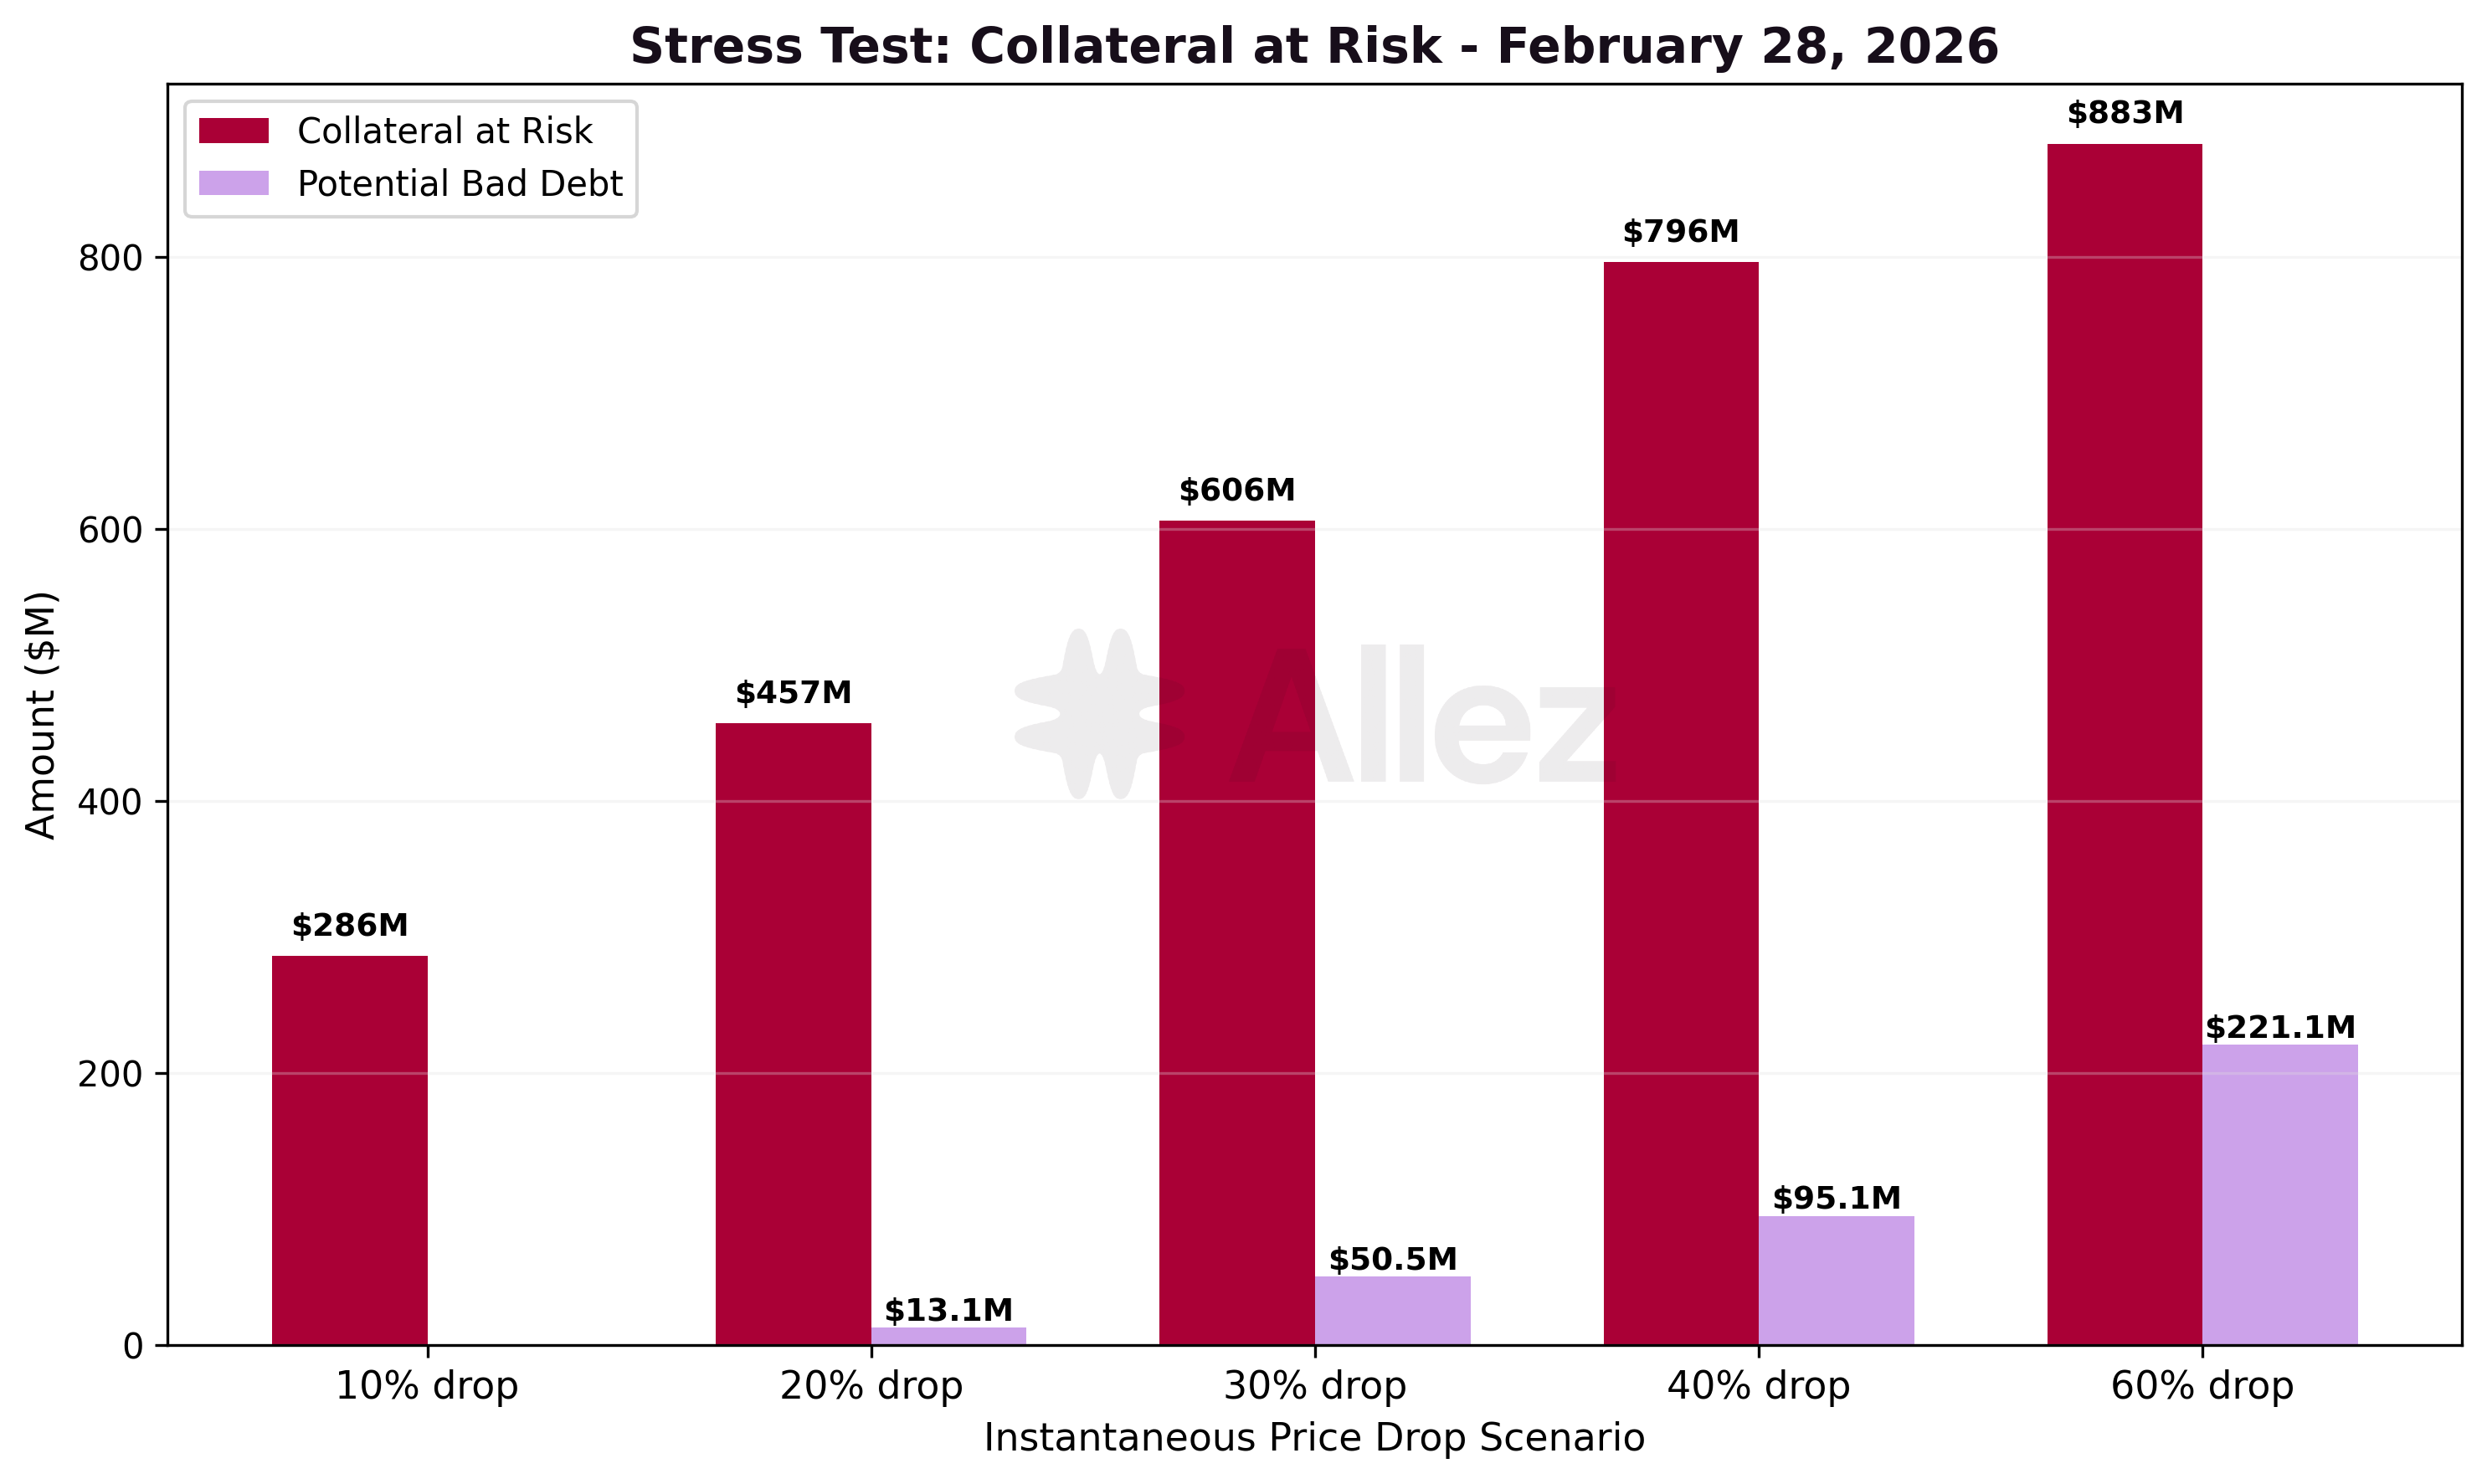
The stress test reflects post-crash positioning as of February 28. The February 4-6 correction cleared the most fragile positions, but remaining positions sit closer to liquidation thresholds, resulting in higher sensitivity to shallow price drops and comparable exposure at deeper scenarios.
Stress test scenarios (instantaneous shock, February 28):
| Scenario | Collateral at Risk | Potential Bad Debt | MoM (Collateral) | MoM (Bad Debt) |
|---|---|---|---|---|
| 10% drop | $286M | $0 | +106% | n/a* |
| 20% drop | $457M | $13.1M | +32% | +75% |
| 30% drop | $606M | $50.5M | +19% | +46% |
| 40% drop | $796M | $95.1M | +17% | +21% |
| 60% drop | $883M | $221.1M | -9% | +4% |
At a 10% instantaneous drop, $286M of collateral would be at risk of liquidation (+106% vs January's $139M), reflecting a higher density of positions near liquidation thresholds in the post-crash environment. The steeper increase at shallow drops (10-20%) reflects a higher density of positions sitting near liquidation thresholds in the post-correction environment. At 60%, potential bad debt is $221M (vs January's $212M, +4%), indicating that deeper scenarios produce comparable risk exposure.
4. Per-Market Micro Analysis
Market-level trends:
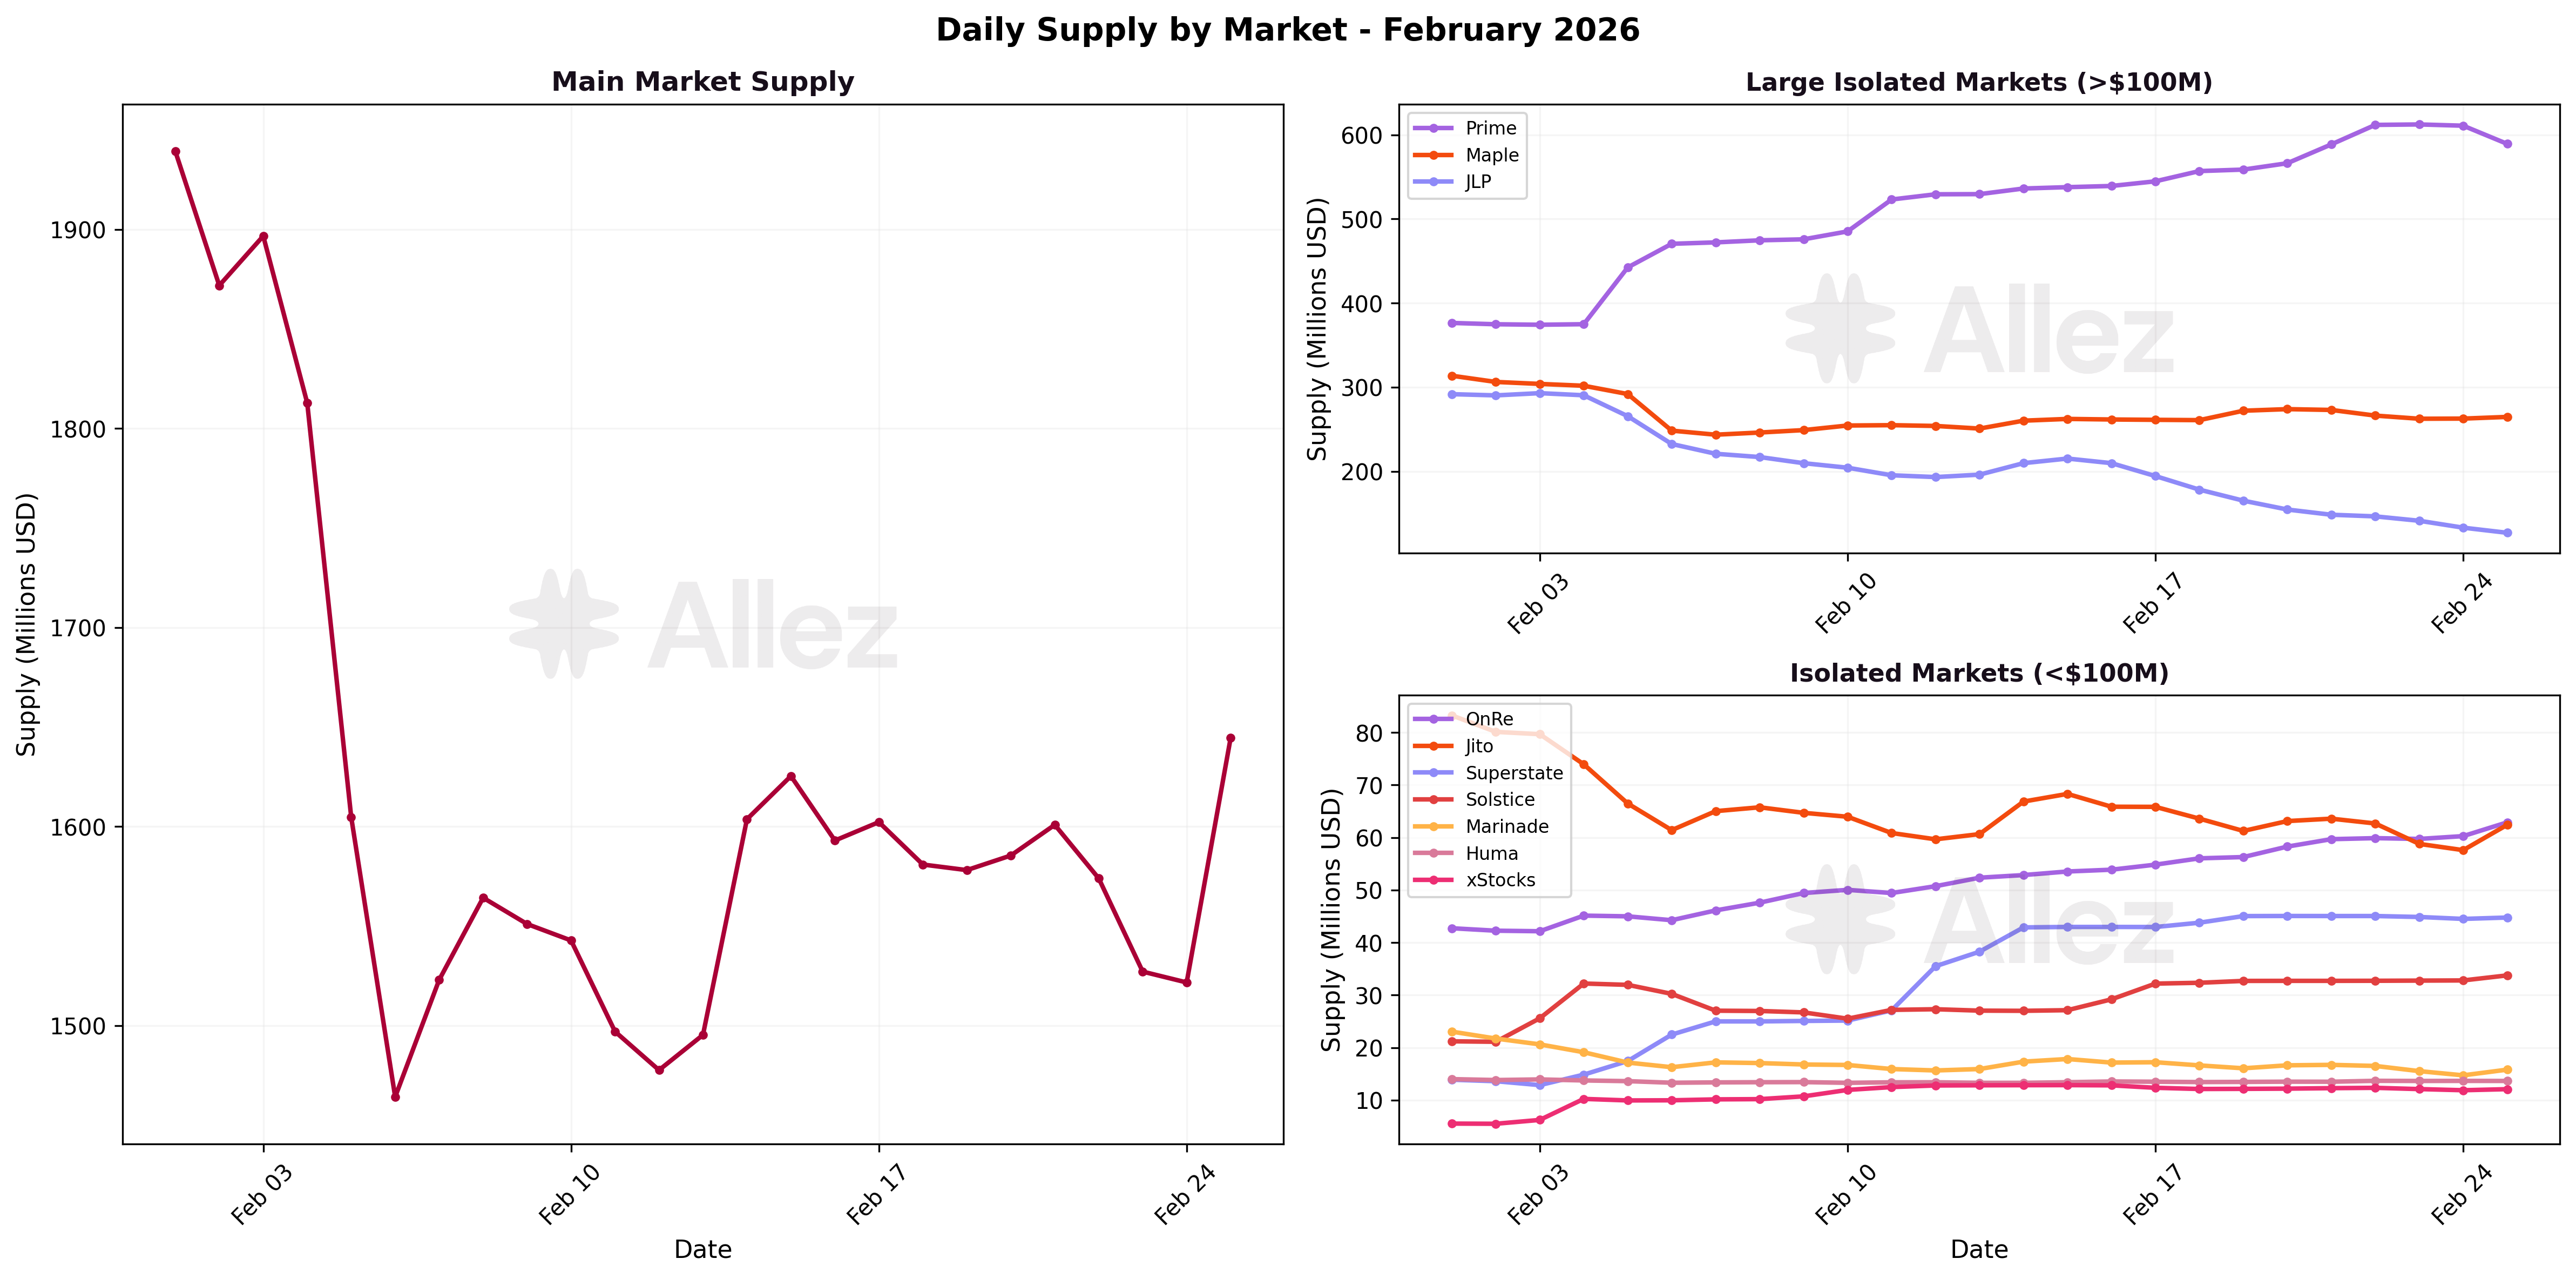
The Main Market contracted to $1.63B (-21.7%), driven by SOL and LST depreciation. It remains the protocol anchor at 57% of total supply. The story of February's markets is two distinct segments: SOL-correlated markets contracted, while USD-denominated and RWA markets expanded.
Growing markets:
-
Prime: $575M supply (+51.2%) / $257M debt (+54.1%) - Remains the #2 market by supply, more than doubling since its December launch ($283M). PRIME collateral (+$109M) drove the growth as tokenized HELOC yield continues to draw DeFi depositors seeking real-world yield exposure.
-
Superstate: $45M supply (+222%) / $17M debt (+827%) - Tokenized securities market (FWDI) with strong growth, now the 7th largest market.
-
OnRe: $71M supply (+67.0%) / $22M debt (+84.4%) - RWA insurance market maintains strong trajectory. Conservative LTV parameters continue to deliver a healthy risk profile.
-
Solstice: $35M supply (+61.5%) / $10M debt (+19.9%) - Growth driven by Pendle PT deposits (PT-eUSX, PT-USX) as collateral, enabling users to leverage fixed-yield positions.
-
xStocks: $12M supply (+124%) / $3M debt (+278%) - Tokenized equities market growing from a small base.
Contracting markets:
-
JLP: $131M supply (-55.6%) / $39M debt (-63.4%) - The sharpest contraction, as leveraged perpetual strategies unwound during the crash. JLP supply fell from $295M to $131M, more than halving.
-
Jito: $61M supply (-37.4%) / $28M debt (-37.3%) - LST market declined alongside SOL price.
-
Maple: $262M supply (-18.3%) / $100M debt (-21.9%) - syrupUSDC outflows (-$38M) drove the decline, a reversal from January's +36% growth.
-
Marinade: $15M supply (-38.2%) / $7M debt (-39.1%) - Continued migration away from smaller LST venues.
Market snapshot (February 28, 2026):
| Market | Supply | MoM | Debt | MoM | Util |
|---|---|---|---|---|---|
| Main | $1,629M | -21.7% | $565M | -29.7% | 34.7% |
| Prime | $575M | +51.2% | $257M | +54.1% | 44.7% |
| Maple | $262M | -18.3% | $100M | -21.9% | 38.3% |
| JLP | $131M | -55.6% | $39M | -63.4% | 29.8% |
| OnRe | $71M | +67.0% | $22M | +84.4% | 31.1% |
| Jito | $61M | -37.4% | $28M | -37.3% | 46.1% |
| Superstate | $45M | +222% | $17M | +827% | 37.9% |
| Solstice | $35M | +61.5% | $10M | +19.9% | 29.5% |
| Marinade | $15M | -38.2% | $7M | -39.1% | 44.1% |
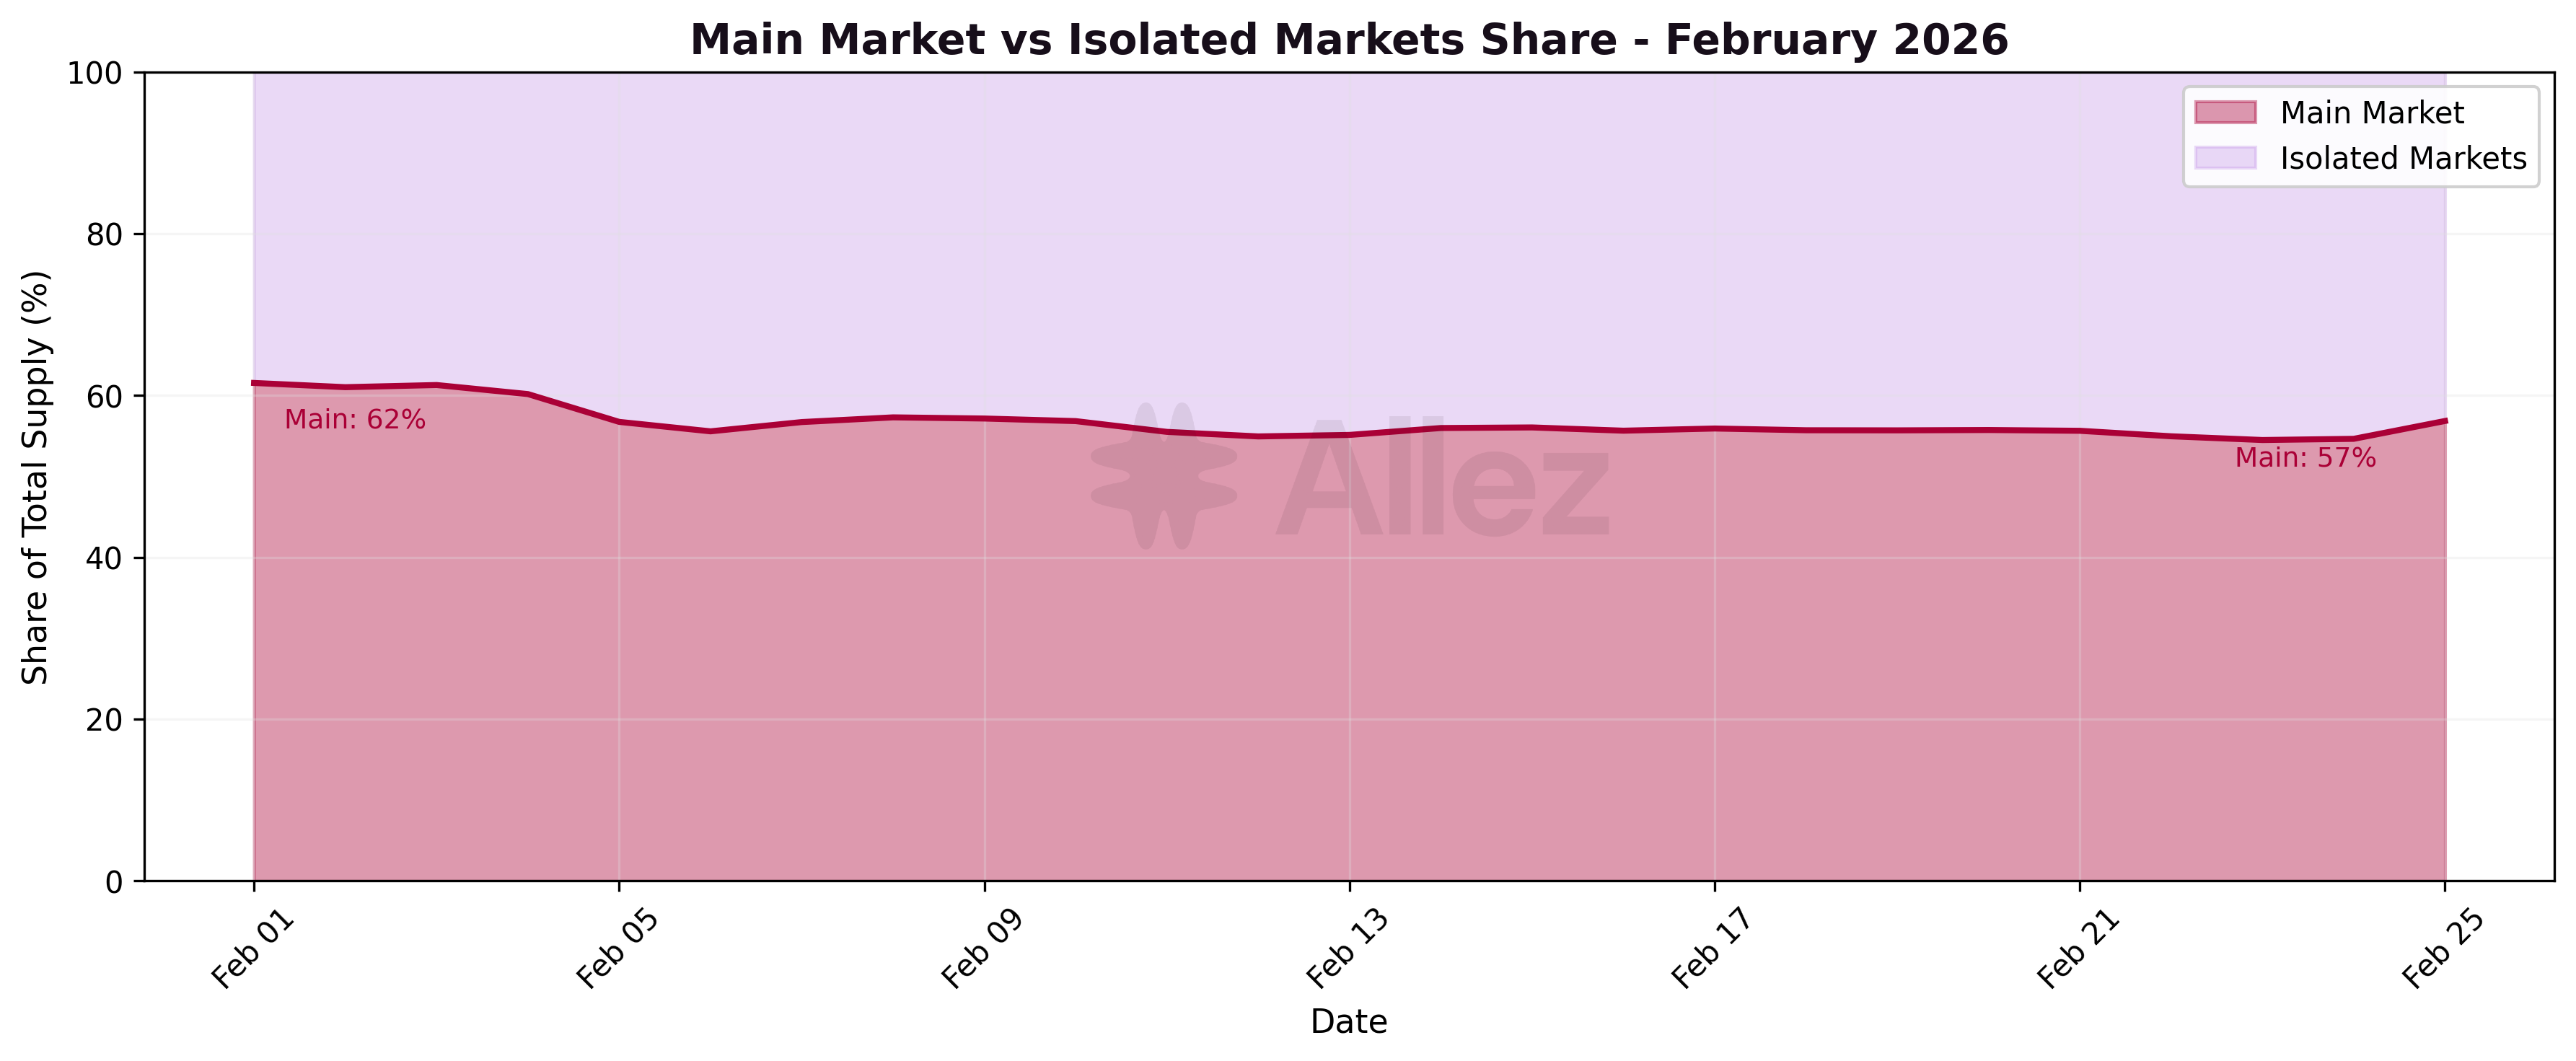
Main Market share declined from 62% to 57% during February, continuing the structural trend toward isolated markets. Prime alone represents 20% of total supply, up from 11% at the start of January.
5. Kamino Lending Vaults
Kamino's Lending Vault ecosystem contracted alongside the broader market, declining from $678M to $553M (-18.6%) in combined deposits across 26 actively managed vaults.
Vault ecosystem performance:
-
Combined Deposits: $553M (-18.6%)
-
Total Users: 14,511 (-1.0%)
-
APY Range: 1.2% - 8.5%
-
Active Vaults: 26
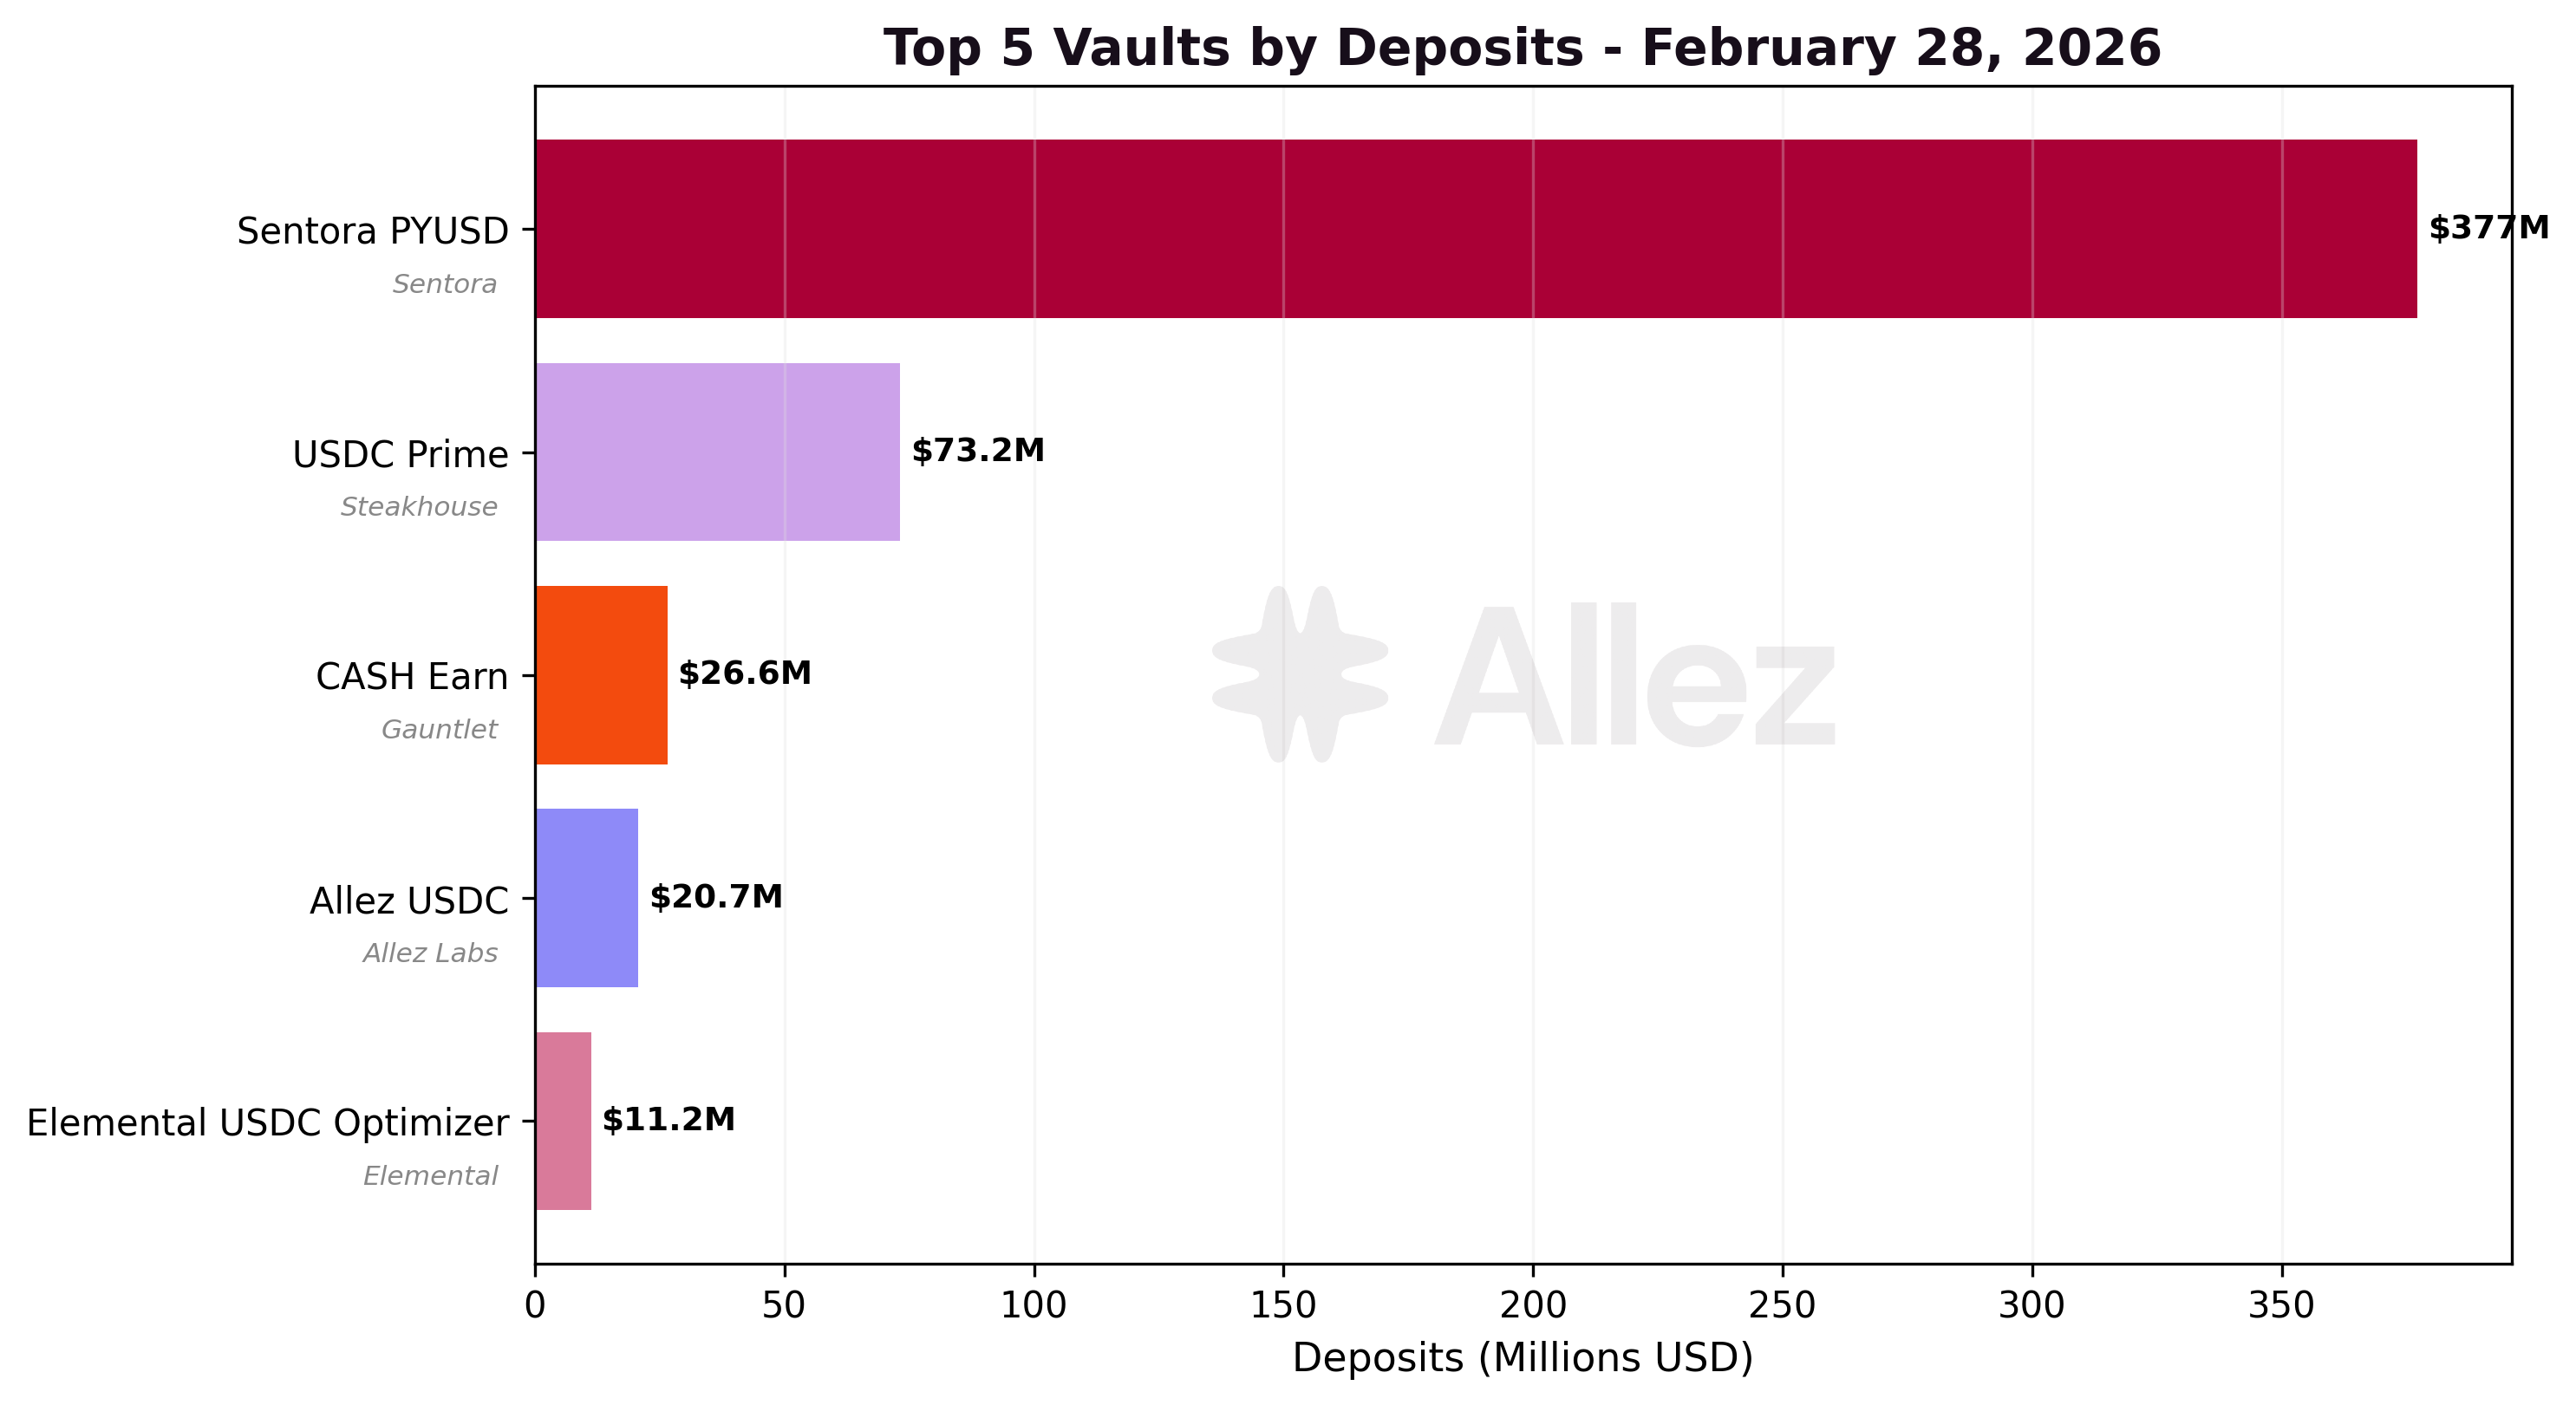
Top vaults by deposits:
| Vault | Token | Deposits | MoM | Users | Base APY | Net APY* |
|---|---|---|---|---|---|---|
| Sentora PYUSD | PYUSD | $377M | -9% | 3,157 | 1.2% | 5.7% |
| USDC Prime | USDC | $73M | -45% | 4,089 | 1.5% | 1.5% |
| CASH Earn | CASH | $27M | -45% | 913 | 5.5% | 5.4% |
| Allez USDC | USDC | $21M | -8% | 1,011 | 5.8% | 5.9% |
| Elemental USDC Optimizer | USDC | $11M | +134% | 318 | 7.4% | 7.2% |
| Allez SOL | SOL | $8M | -7% | 1,605 | 4.8% | 5.3% |
| Rockaway RWA USDC | USDC | $6M | new | 89 | 6.7% | 6.7% |
| Gauntlet USDC Prime | USDC | $5M | -62% | 280 | 1.5% | 1.5% |
*Net APY = base lending yield minus vault management fees, plus any token incentives. Vaults with active incentive programs: Sentora PYUSD (4.5% incentive APR), Allez SOL (0.5%), Allez USDC (0.1%), Elemental USDC (0.01%).
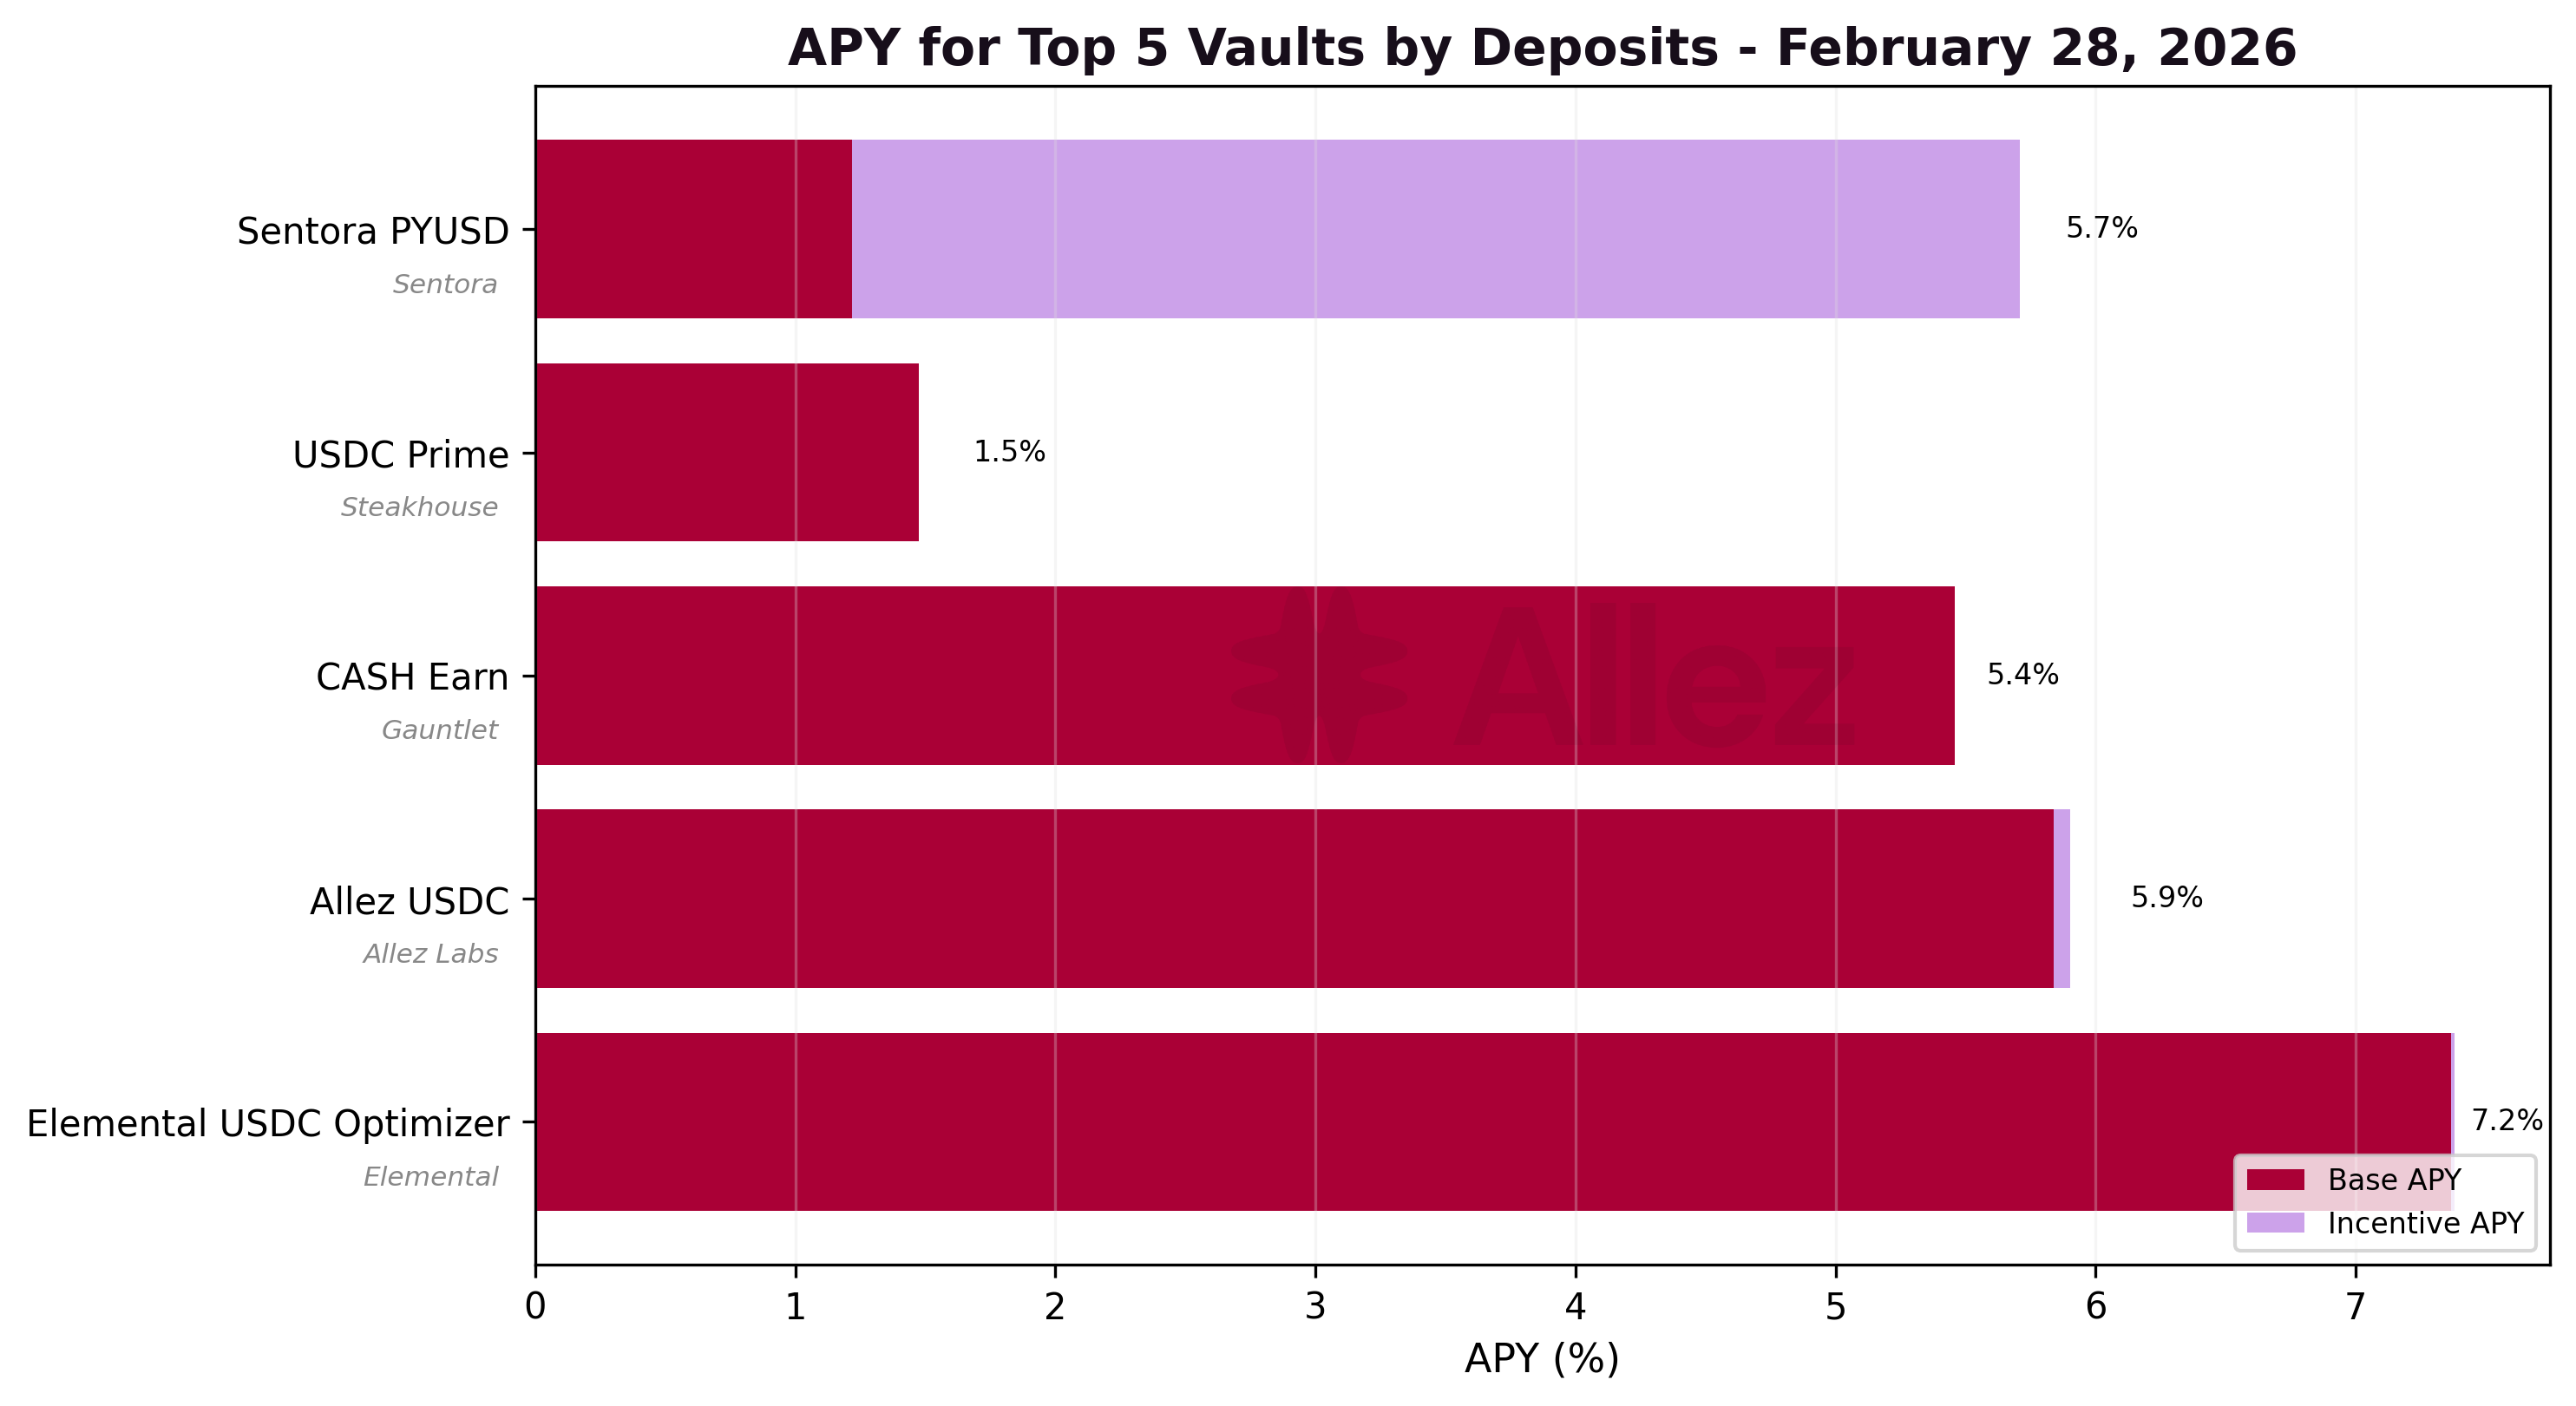
Sentora PYUSD remains the dominant vault at $377M but declined 9% from January's $415M, consistent with PYUSD supply contraction across the protocol. Notably, Sentora PYUSD carries a 4.5% incentive APR, bringing its total yield to 5.7%. Steakhouse USDC Prime declined from $132M to $73M (-45%), as the end of Season 4 incentives removed the yield premium that had sustained deposits at elevated levels - the vault's base lending yield reverted to ~1.5%. The highest-yielding vaults remain smaller in size but are attracting deposits as yield-seeking users rotate out of lower-yield vaults.
Two new vaults launched in February:
-
Gauntlet USDC Frontier ($2.2M, 7.9% APY): Aggressive risk profile managed by Gauntlet. Allocates 100% to the Prime Market (92.99% utilization, 5.6% supply APY), with Maple and Main Market as additional eligible markets. Zero management and performance fees. Targets higher-volatility yield sources and RWAs in exchange for greater returns.
-
Rockaway RWA USDC ($6M, 6.6% APY): Balanced risk profile managed by RockawayX. Deploys across RWA-backed lending markets: OnRe Market (55% allocation, $3.1M, 5.6% APY) and Huma Market (45%, $2.5M, 5.6% APY), with Solstice and Prime as eligible but unallocated. No management fee, 2.5% performance fee. Provides diversified market-neutral yield across vetted RWA markets with conservative collateral standards and automated rebalancing.
SOL vaults (Allez SOL, MEV Capital SOL, Gauntlet SOL Balanced) maintained competitive APYs despite the price decline, with incentive programs boosting total yields to 5.1-5.3%.
6. Transaction Volume & User Behavior
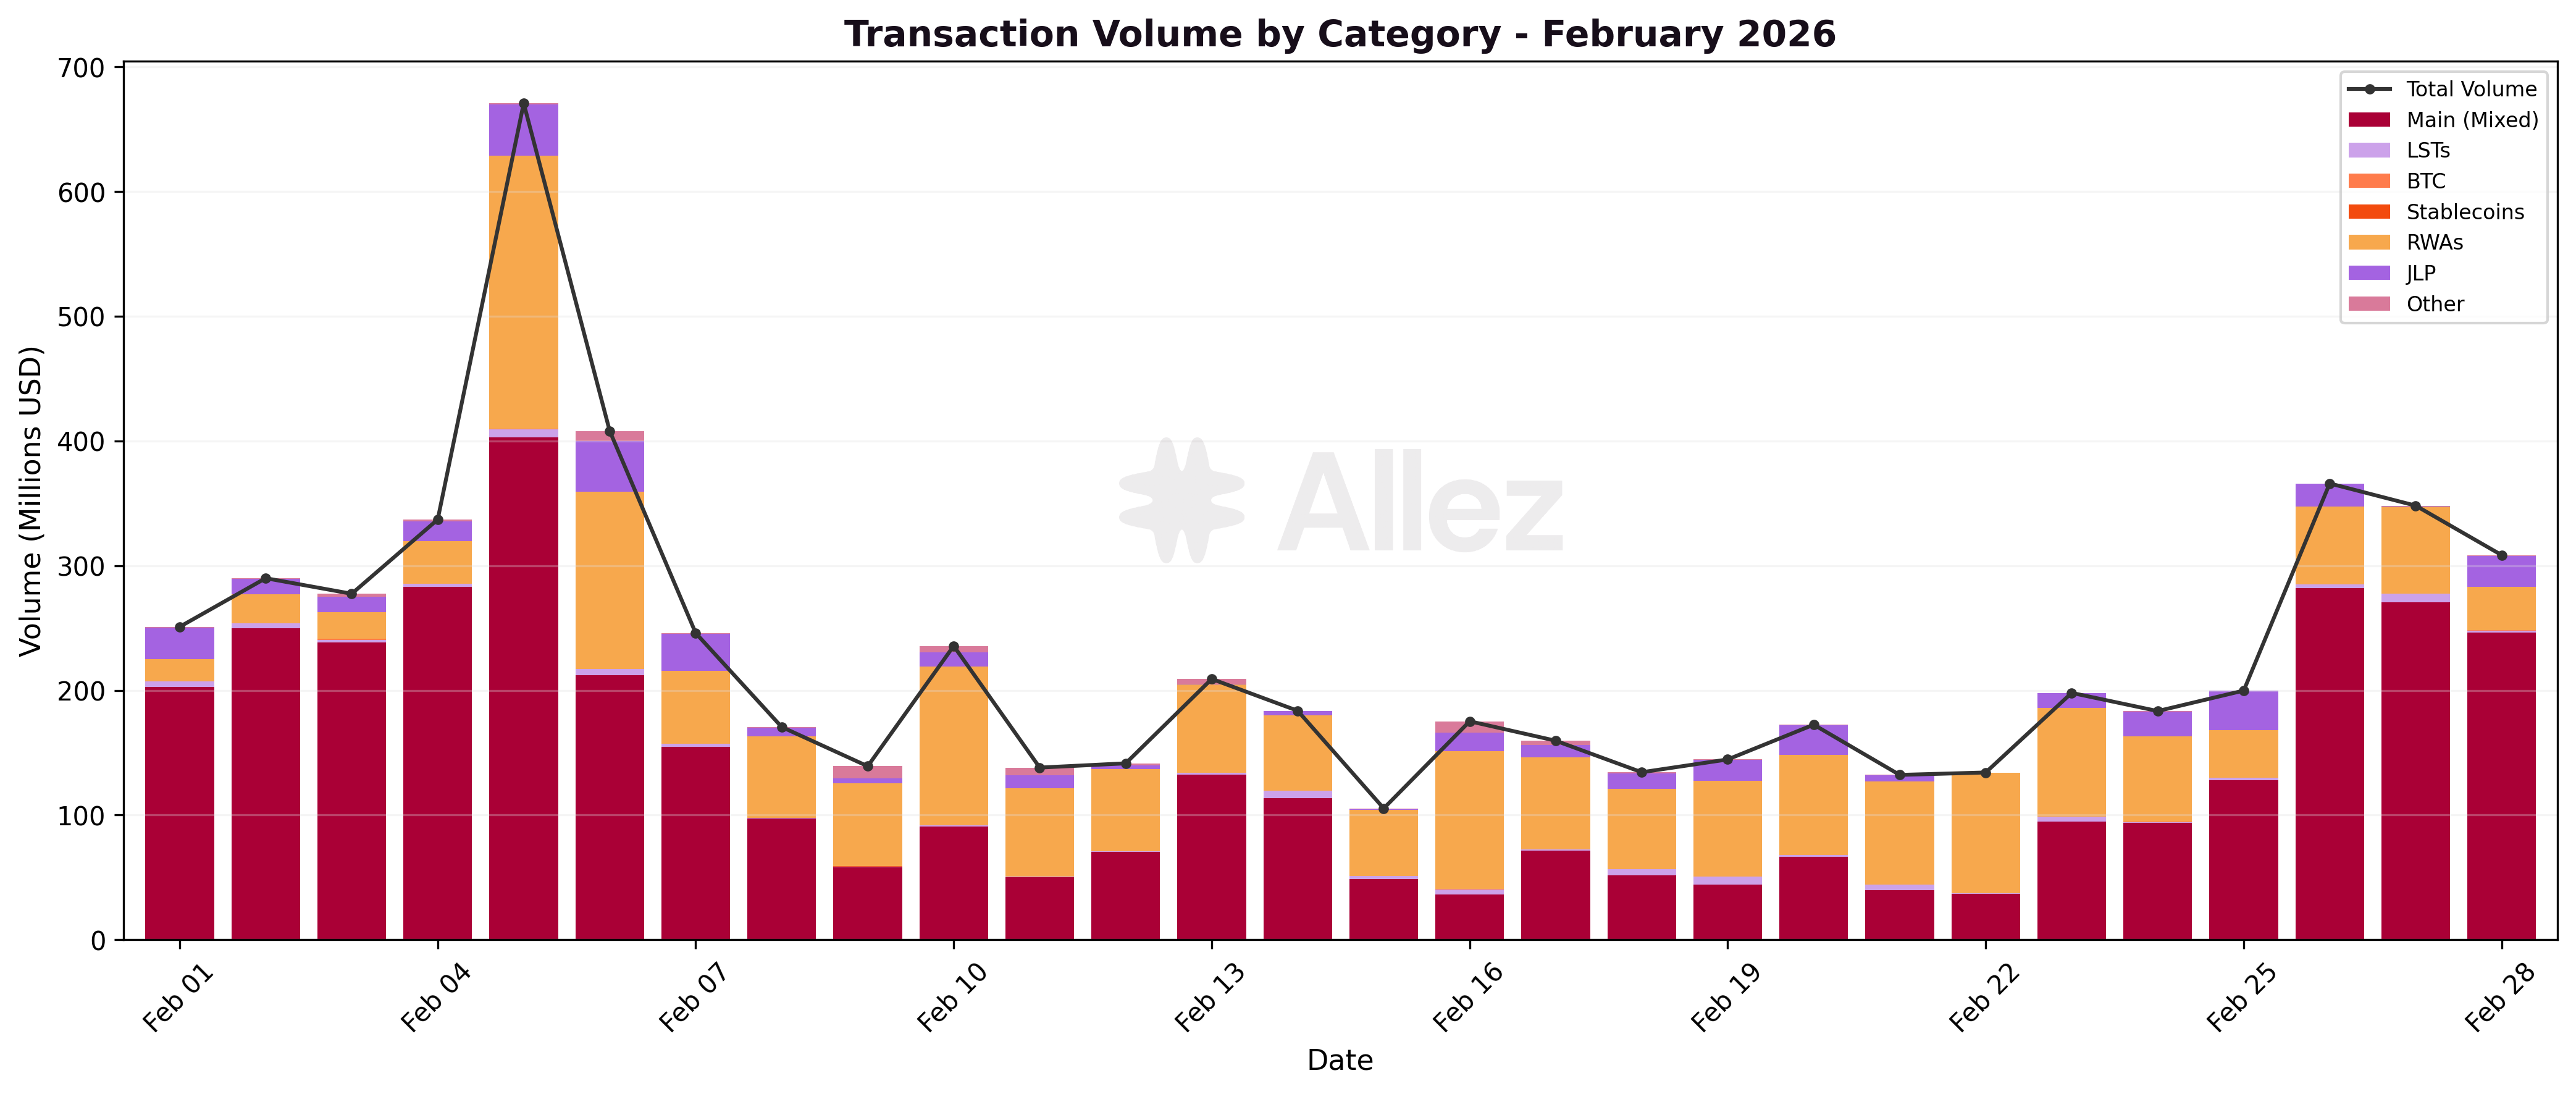
Total transaction volume fell 34% to $6.5B across 320,721 transactions, driven by reduced activity across all categories. The decline was less severe than January's -37% drop, as late-month activity partially offset the crash-period slowdown.
The Main Market generated 59% of all volume ($3.8B), followed by Prime at 22% ($1.4B) and Maple at 7% ($0.43B). JLP's share fell to 6% ($0.40B), consistent with the market's 56% supply contraction. Prime's volume share grew from ~18% in January to 22%, reflecting its expanding supply base.
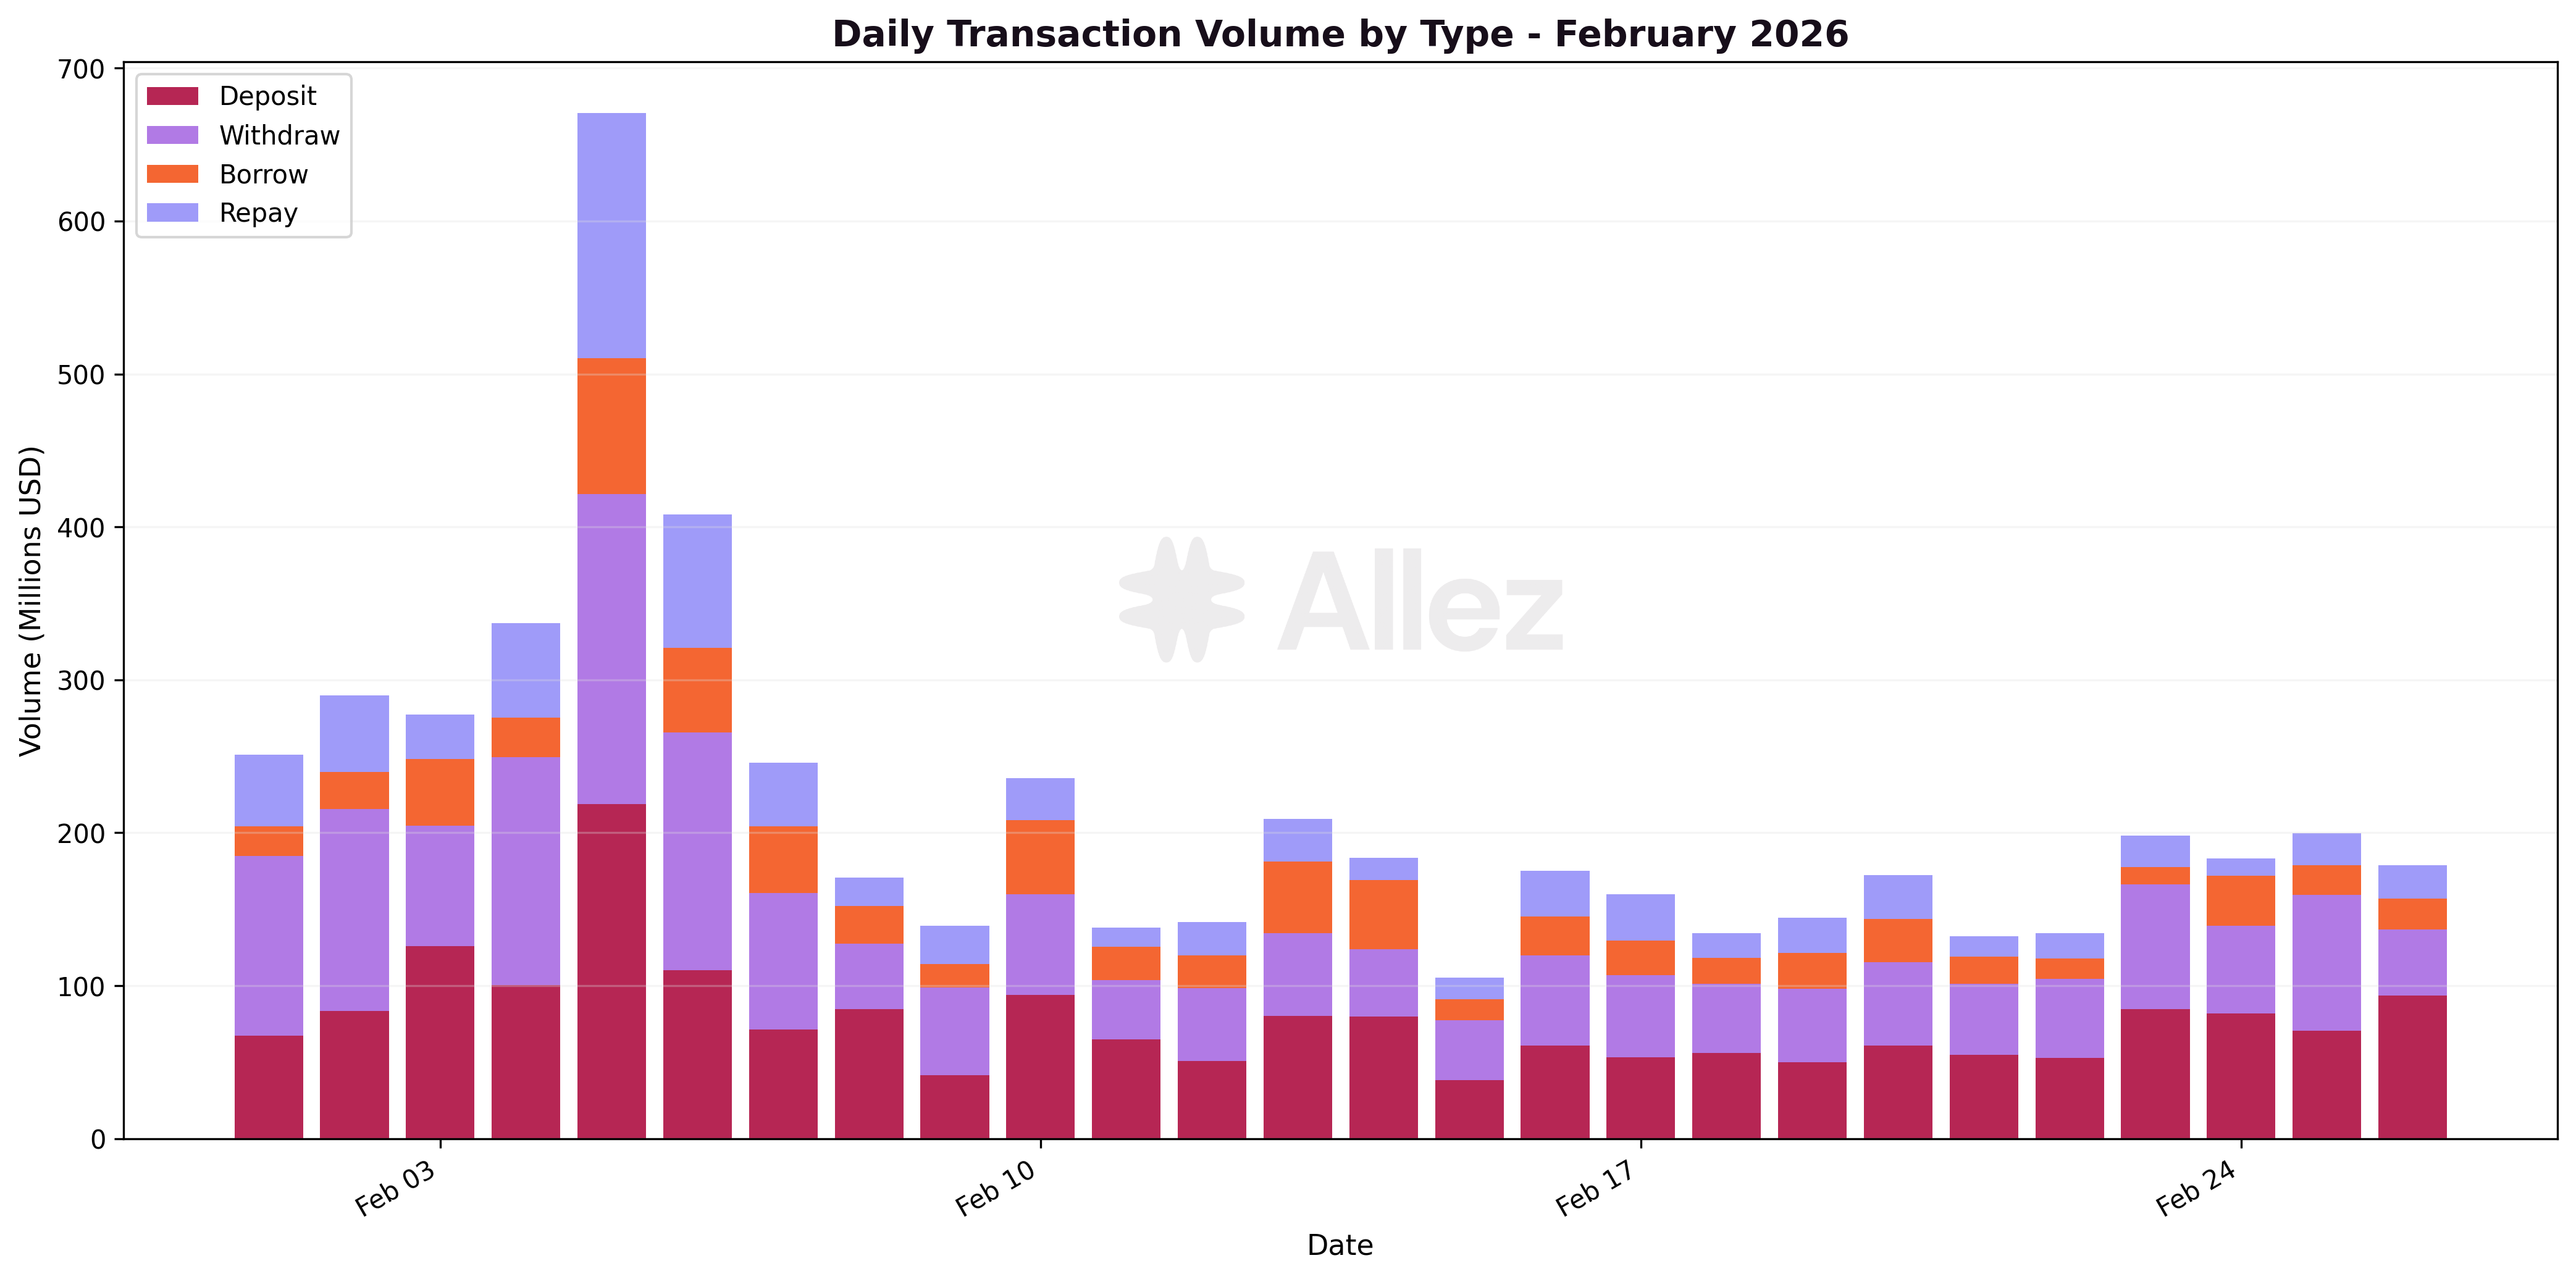
Volume breakdown by transaction type:
| Type | Volume | Share | MoM |
|---|---|---|---|
| Deposits | $2.33B | 37% | -43% |
| Withdrawals | $2.24B | 35% | -48% |
| Repays | $0.95B | 15% | +58% |
| Borrows | $0.84B | 13% | +19% |
The shift in volume composition is significant: deposits and withdrawals contracted notably (-43% and -48%), indicating reduced capital rotation. Meanwhile, repays rose +58%, consistent with forced deleveraging through liquidations and voluntary position unwinding. Borrow volume grew modestly (+19%), suggesting new leverage demand persisted despite the correction, concentrated in RWA and emerging markets.
Crash period dynamics (February 4-6):
The three-day crash period concentrated 22% of monthly volume ($1.42B) into just 3 days, with daily averages of $472M versus $198M for the rest of the month. February 5 was the single highest-volume day at $671M, a 6x multiple of the month's quietest day (February 15, $105M). The crash period also saw 56% of all monthly transactions (179,491 of 320,721), driven by a flood of small liquidation and repay transactions.
Post-crash, daily volume stabilized at $150-200M/day, well below the pre-crash baseline of $273M/day and January's $250-350M/day range. This sustained lower activity as the correction dampened leverage appetite, though volumes typically recover as new market conditions establish and participants re-engage.
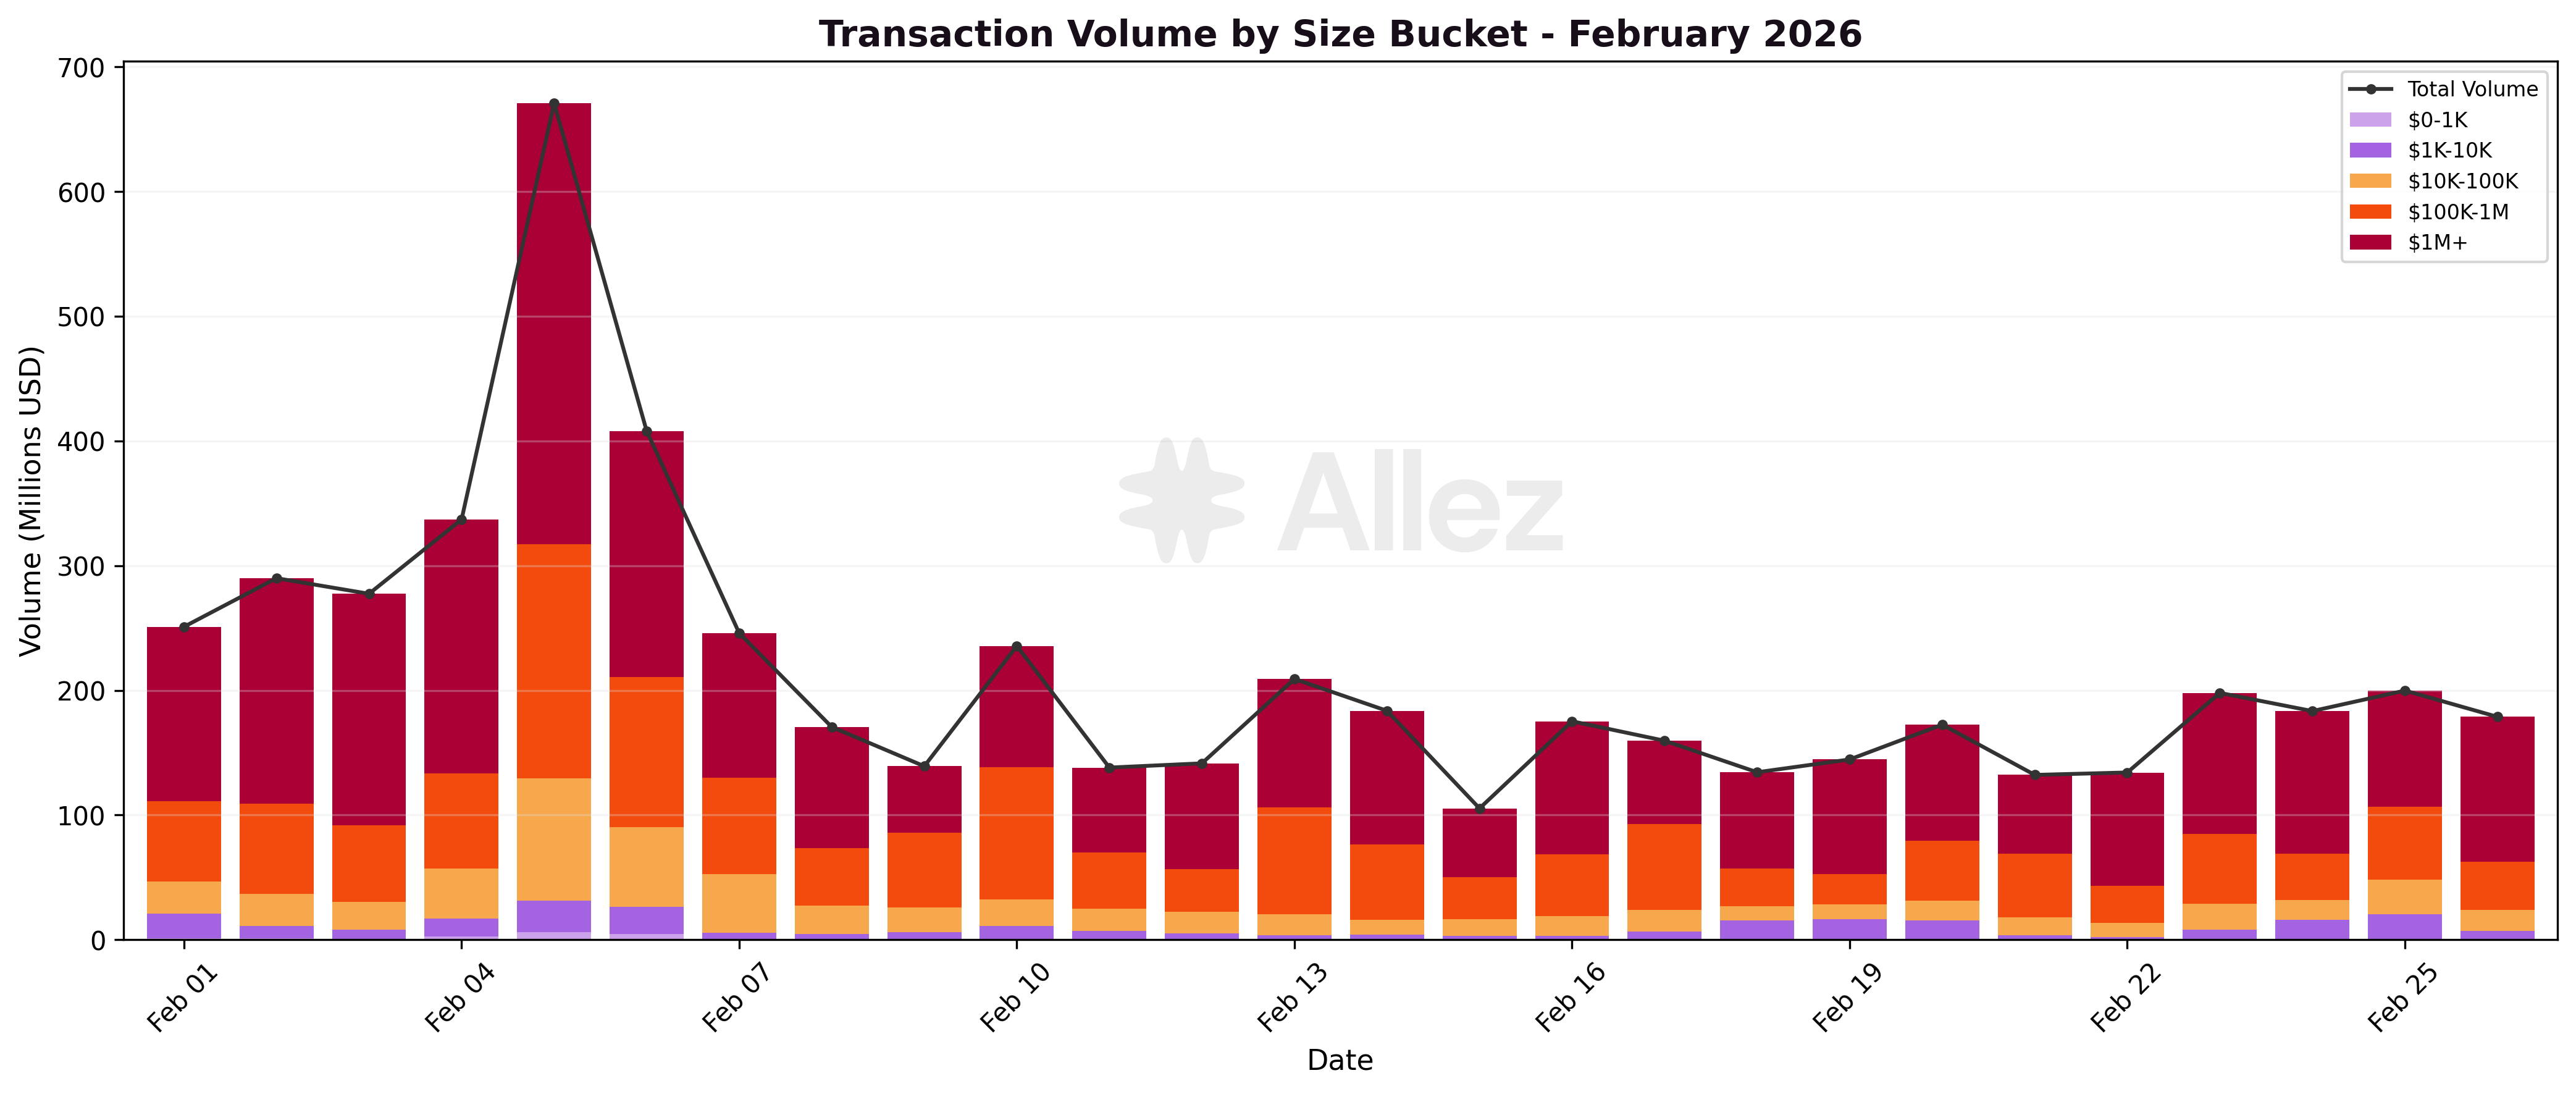
Volume by transaction size:
| Size Bucket | Volume | Share | Transactions |
|---|---|---|---|
| $1M+ | $3.07B | 54.6% | 688 |
| $100K-1M | $1.62B | 28.9% | 5,701 |
| $10K-100K | $0.64B | 11.5% | 18,559 |
| $1K-10K | $0.25B | 4.5% | 57,412 |
| $0-1K | $0.03B | 0.5% | 227,014 |
The size distribution reveals a familiar pattern: 688 whale transactions ($1M+) account for over half of all volume, while 227,014 sub-$1K transactions represent 73% of all activity but only 0.5% of volume. Notably, the size split remained stable during and after the crash (53% in $1M+ for both periods), indicating that whale behavior did not disproportionately shift during the stress event. The $10K-100K bucket saw a mild spike during the crash (14.3% vs 10.9% post-crash), consistent with mid-size positions being liquidated or unwound.
7. Conclusions & Forward Look
February's SOL crash from $104 to $68 (-35% intraday) tested the protocol at scale. The protocol processed 66,848 liquidations and $23.5M in collateral over three days (February 4-6), with zero bad debt and no operational disruption. The liquidation infrastructure handled 5x January's peak event volume, confirming the system's resilience under stress.
The structural shift toward USD-denominated assets accelerated in February. Prime's 51% growth to $575M, Superstate's 222% expansion, and cbBTC's near-doubling demonstrate that Kamino's appeal extends well beyond SOL leverage. USD-denominated supply (stablecoins + RWAs) now represents 58% of protocol liquidity, up from 48% in January. This reduces the protocol's sensitivity to SOL price movements: a 27.6% SOL decline produced only a 13.7% total supply contraction.
The February crash cleared out the most leveraged positions, but the two-phase correction (early-month crash + late-month retest at $77) compressed surviving positions closer to liquidation thresholds. The stress test shows +106% more collateral at risk in a 10% drop scenario versus January, and Warning-tier debt nearly tripled in uncorrelated positions. The JLP market's 56% contraction warrants monitoring - the rapid unwind from $295M to $131M suggests leveraged perpetual strategies are highly procyclical and can amplify drawdowns.
While most RWA markets expanded, Maple's reversal from +36% in January to -18% in February, driven by syrupUSDC outflows (-$38M) following a reduction in intrinsic yield and resulting reduction of leverage profitability, shows that individual credit markets can face outflows as new RWA entrants (Superstate, xStocks, OnRe) compete for the same capital.
Outlook
February confirms that Kamino can absorb significant market shocks while its underlying composition continues to diversify. The protocol's revenue (-24%) and volume (-34%) decline is a natural consequence of lower leverage and SOL prices, while the institutional pipeline (Prime, Superstate, xStocks) continued to expand even during the downturn. Whether this diversification trend persists will depend on continued RWA demand and bitcoin collateral adoption in the months ahead.
Appendix: Asset Category Classification
This report uses a six-category framework to classify all tokens on Kamino Lend, consistent with the 2025 Annual Report and January 2026 Monthly Report methodology. Position risk depends on whether collateral and debt are correlated (e.g., LST-borrows-SOL, RWA-borrows-stablecoin) or uncorrelated (e.g., SOL-borrows-USDC). Correlated positions carry lower liquidation risk by design and use tighter DTL thresholds (<1.5% for the Critical tier) because both collateral and debt move together. Uncorrelated positions use broader thresholds (<5% critical) to account for directional price exposure.
Category Definitions & Constituent Assets (February 28, 2026):
| Category | Top Assets (by supply) | Feb Supply | Feb Debt | MoM Supply |
|---|---|---|---|---|
| Stablecoins | USDC, PYUSD, CASH, USDG, USDS, USDT, USD1, USX, EURC, sUSDe, UXD, FDUSD | $1,135M | $787M | -2.6% |
| LSTs | JitoSOL, dSOL, jupSOL, fwdSOL, mSOL, bSOL, hSOL, stkeSOL, dfdvSOL, cgntSOL, vSOL, + others | $595M | $2.2M | -34.9% |
| RWAs | PRIME, syrupUSDC, ONyc, USCC, PT-USX-, PT-eUSX-, PST, FWDI, sACRED, eUSX, GLXY, + tokenized stocks | $540M | $0.01M | +26.4% |
| SOL | SOL (native) | $298M | $269M | -37.3% |
| BTC | cbBTC, xBTC, fBTC, WBTC, LBTC, ZBTC, tBTC | $225M | $1.2M | +39.8% |
| Other | JLP, FLP, ALP, ETH, WIF, GOAT, POPCAT, FARTCOIN, BONK, JTO, JUP, PENGU, KMNO, + others | $78M | $0.8M | -57.0% |
Classification Notes:
-
LSTs include all liquid staking tokens (any token ending in "SOL" other than SOL itself, plus INF). Pendle PT tokens wrapping SOL-based assets are also classified as LSTs.
-
RWAs include tokenized real-world assets (PRIME, syrupUSDC, ONyc, PST, FWDI, sACRED, GLXY, USCC, eUSX), tokenized equities (xStocks market tokens), and Pendle PT tokens wrapping RWA underlyings.
-
Stablecoins include fiat-pegged tokens used as lending/borrowing primitives. RWA debt is near-zero because RWA tokens serve as collateral; the associated borrowing appears in the Stablecoins category.
-
BTC is separated from "Other" because bitcoin-backed collateral carries distinct risk characteristics.
-
Other is a catch-all for assets with mixed or idiosyncratic profiles. JLP dominates this category despite its sharp contraction.
This report represents independent risk analysis by Allez Labs for the Kamino Finance community. Analysis reflects protocol performance through February 28, 2026.
Prepared by: Allez Labs Risk Team
Report Date: March 5th, using data up to February 28, 2026
Next Report: March 2026 Monthly Report published in April 2026