Kamino Lend returned to growth in August after two months of contraction. Supply rose 11.7% to $2.48B and debt 7.8% to $0.98B, driven mostly by a SOL rally that revalued SOL, LST and BTC collateral. Measured token-quantity flows were led by ONyc (+$35.4M) and dfdvSOL (+$22.2M). Liquidations stayed minimal, $0.47M seized across 616 events, and the rally pushed uncorrelated positions further from their liquidation threshold. RWA growth concentrated in OnRe, which crossed $250M to become Kamino's largest RWA market, while ONyc passed PRIME as the largest RWA asset on Kamino by supplied value. Kamino also introduced Institutional Yield with a commodity-backed vault ($32.0M), Fixed Rates in private beta, and a Steakhouse-curated reUSD market. Activity lagged the balance sheet: transaction volume fell 3.9%, and interest fees fell 8.1% against an elevated July base (Section 6).
1. Market Context and SOL Price
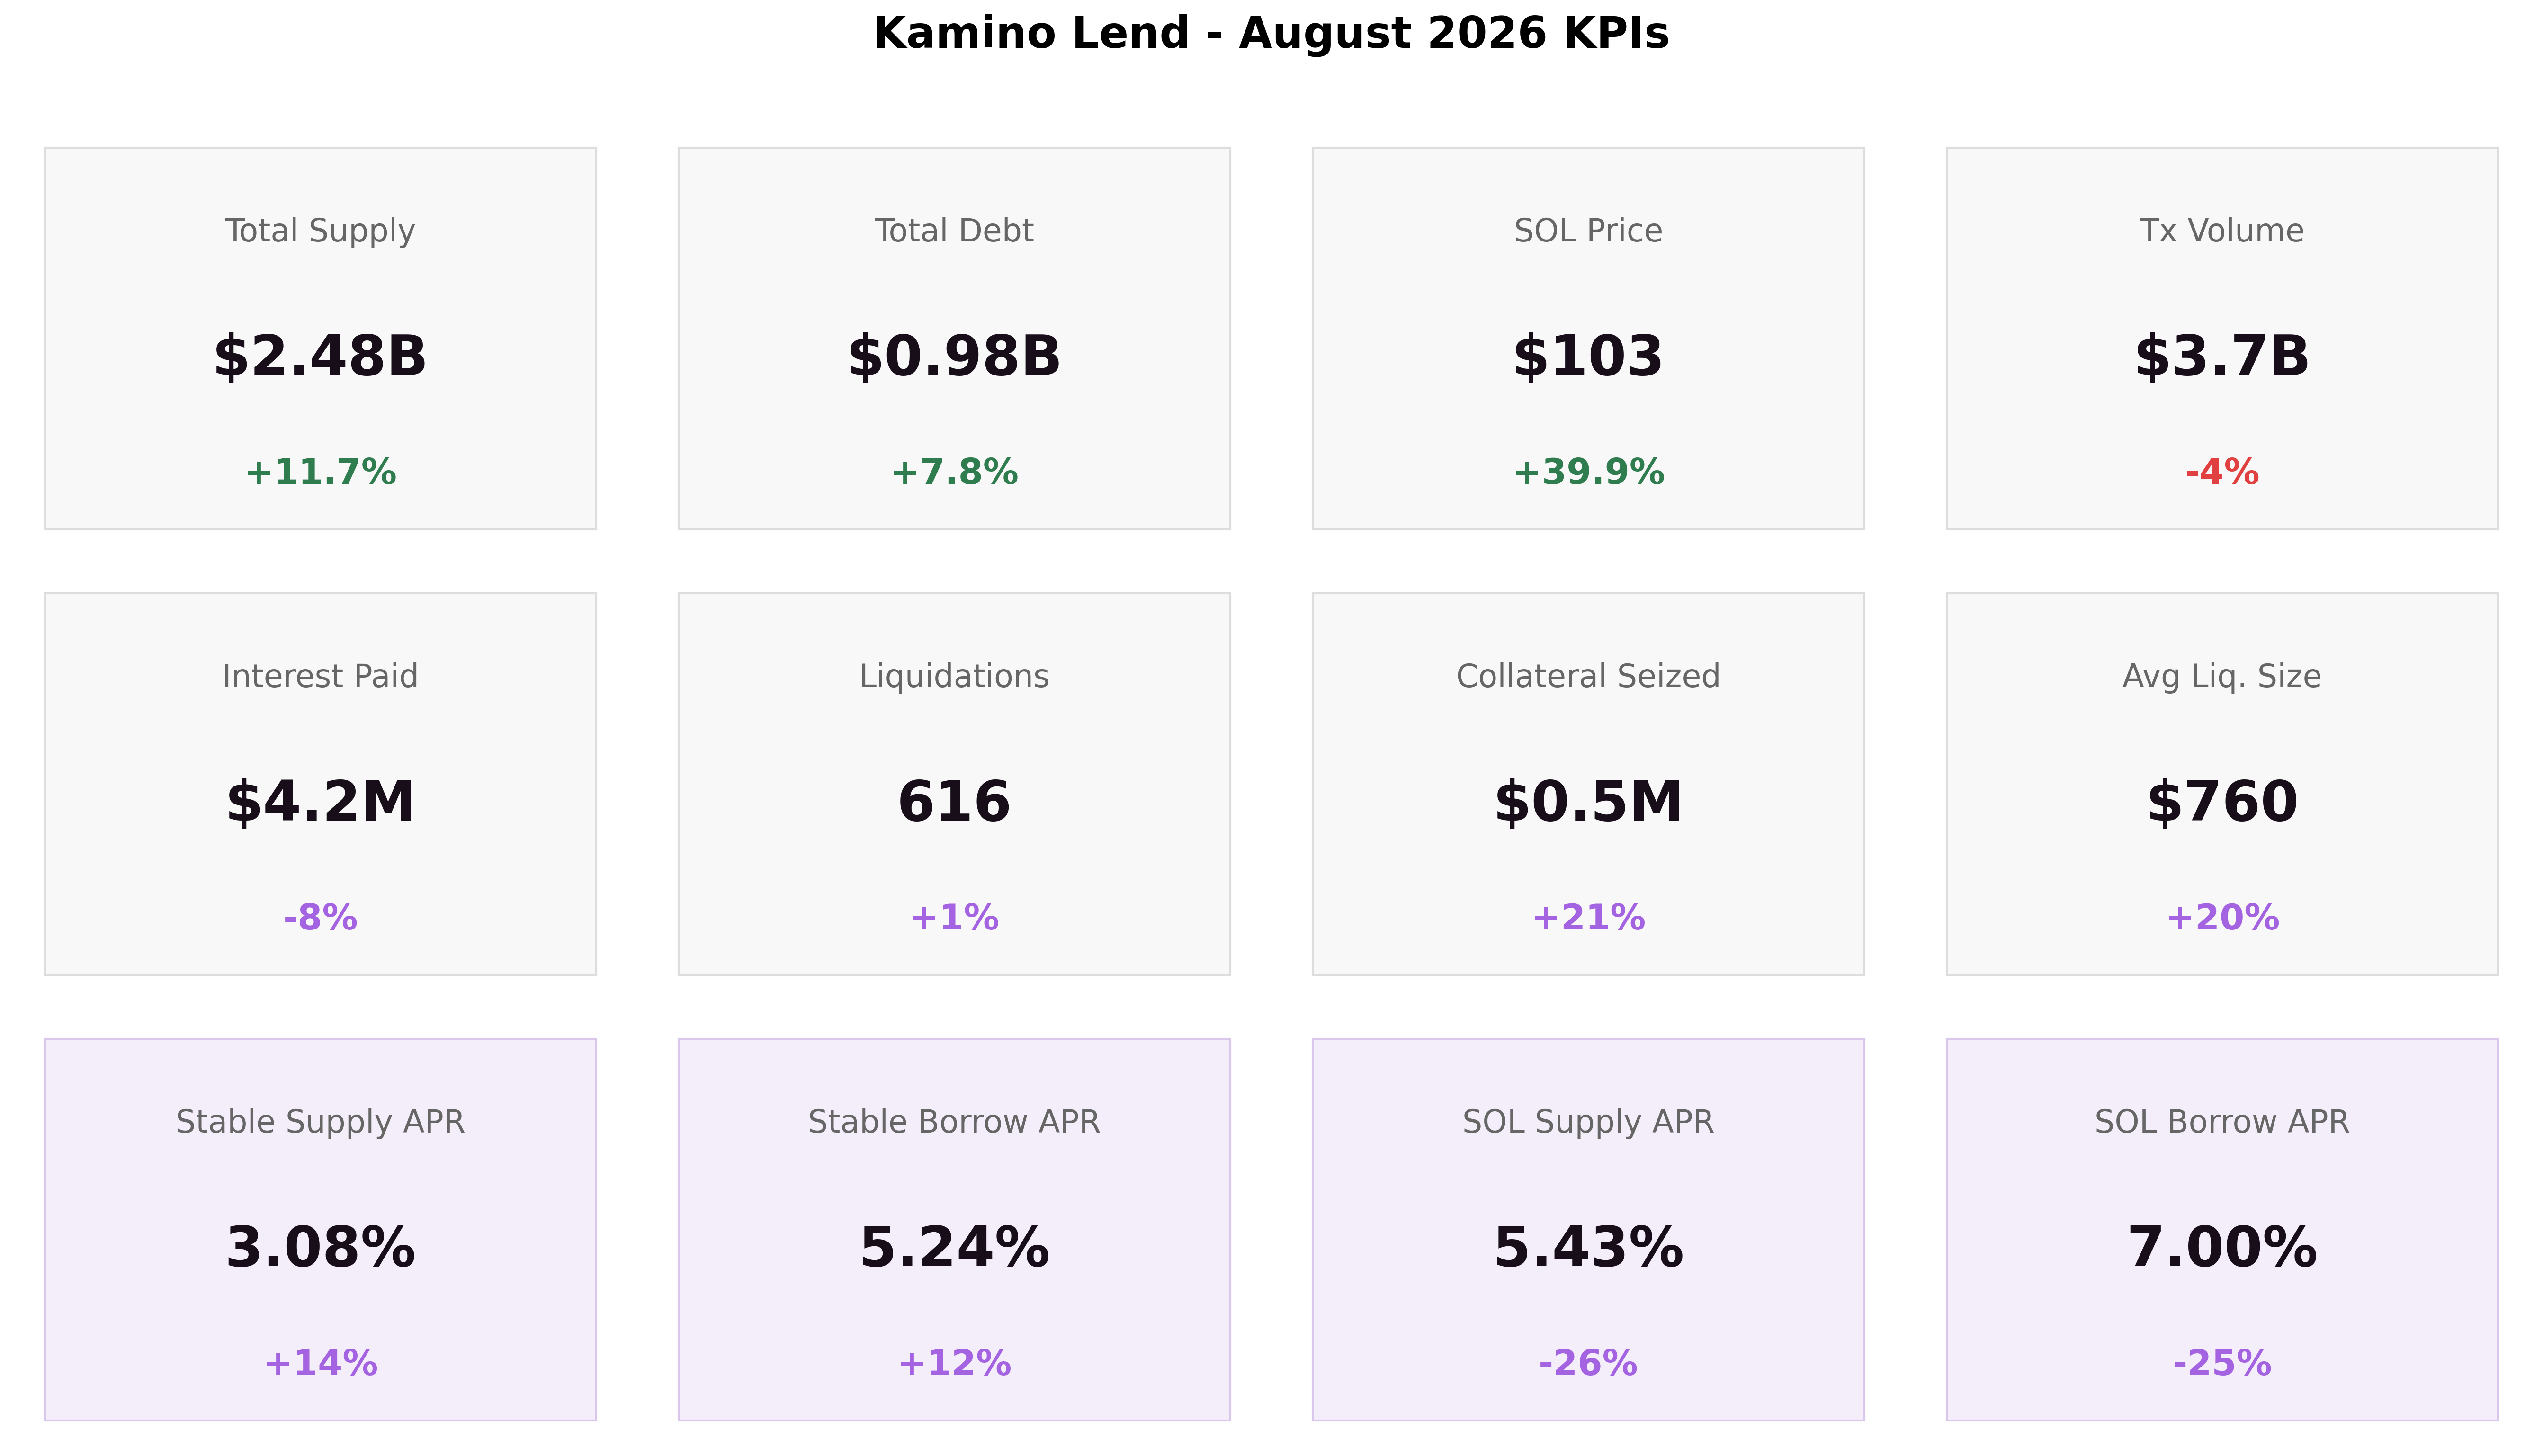
August reversed June and July's easing on the balance sheet: supply rose 11.7% and debt 7.8% as SOL rallied. Flow metrics went the other way, with transaction volume down 3.9% and interest paid down 8.1% on a fees basis. Liquidation activity stayed minimal throughout, even as the SOL price climbed steadily from the third week.
-
Total Supply: $2.48B (+11.7% MoM)
-
Total Debt: $0.98B (+7.8% MoM)
-
SOL Price: $102.87 daily average on August 31 (+39.9% MoM vs $73.51 on July 31)
-
Transaction Volume: $3.71B (-3.9% MoM)
-
Interest Paid: $4.16M (-8.1% MoM, Klend interest fees; see Section 6 for the July base effect)
-
Liquidations: 616 events (+1.0% MoM)
-
Collateral Seized: $0.47M (+20.9% MoM)
-
Average Liquidation Size: $760 (+19.5% MoM)
Transaction volume of $3.71B eased 3.9% from July, a pullback that concentrated in large-ticket flows (Section 6). Deposits ($1.59B) edged past withdrawals ($1.40B), and repay volume ($0.44B) again exceeded borrow volume ($0.29B). Gross deposit and withdrawal instructions do not measure net capital flows; the token-quantity changes in the asset-level flows below give the net-flow view, and it is far smaller than the gross gap.
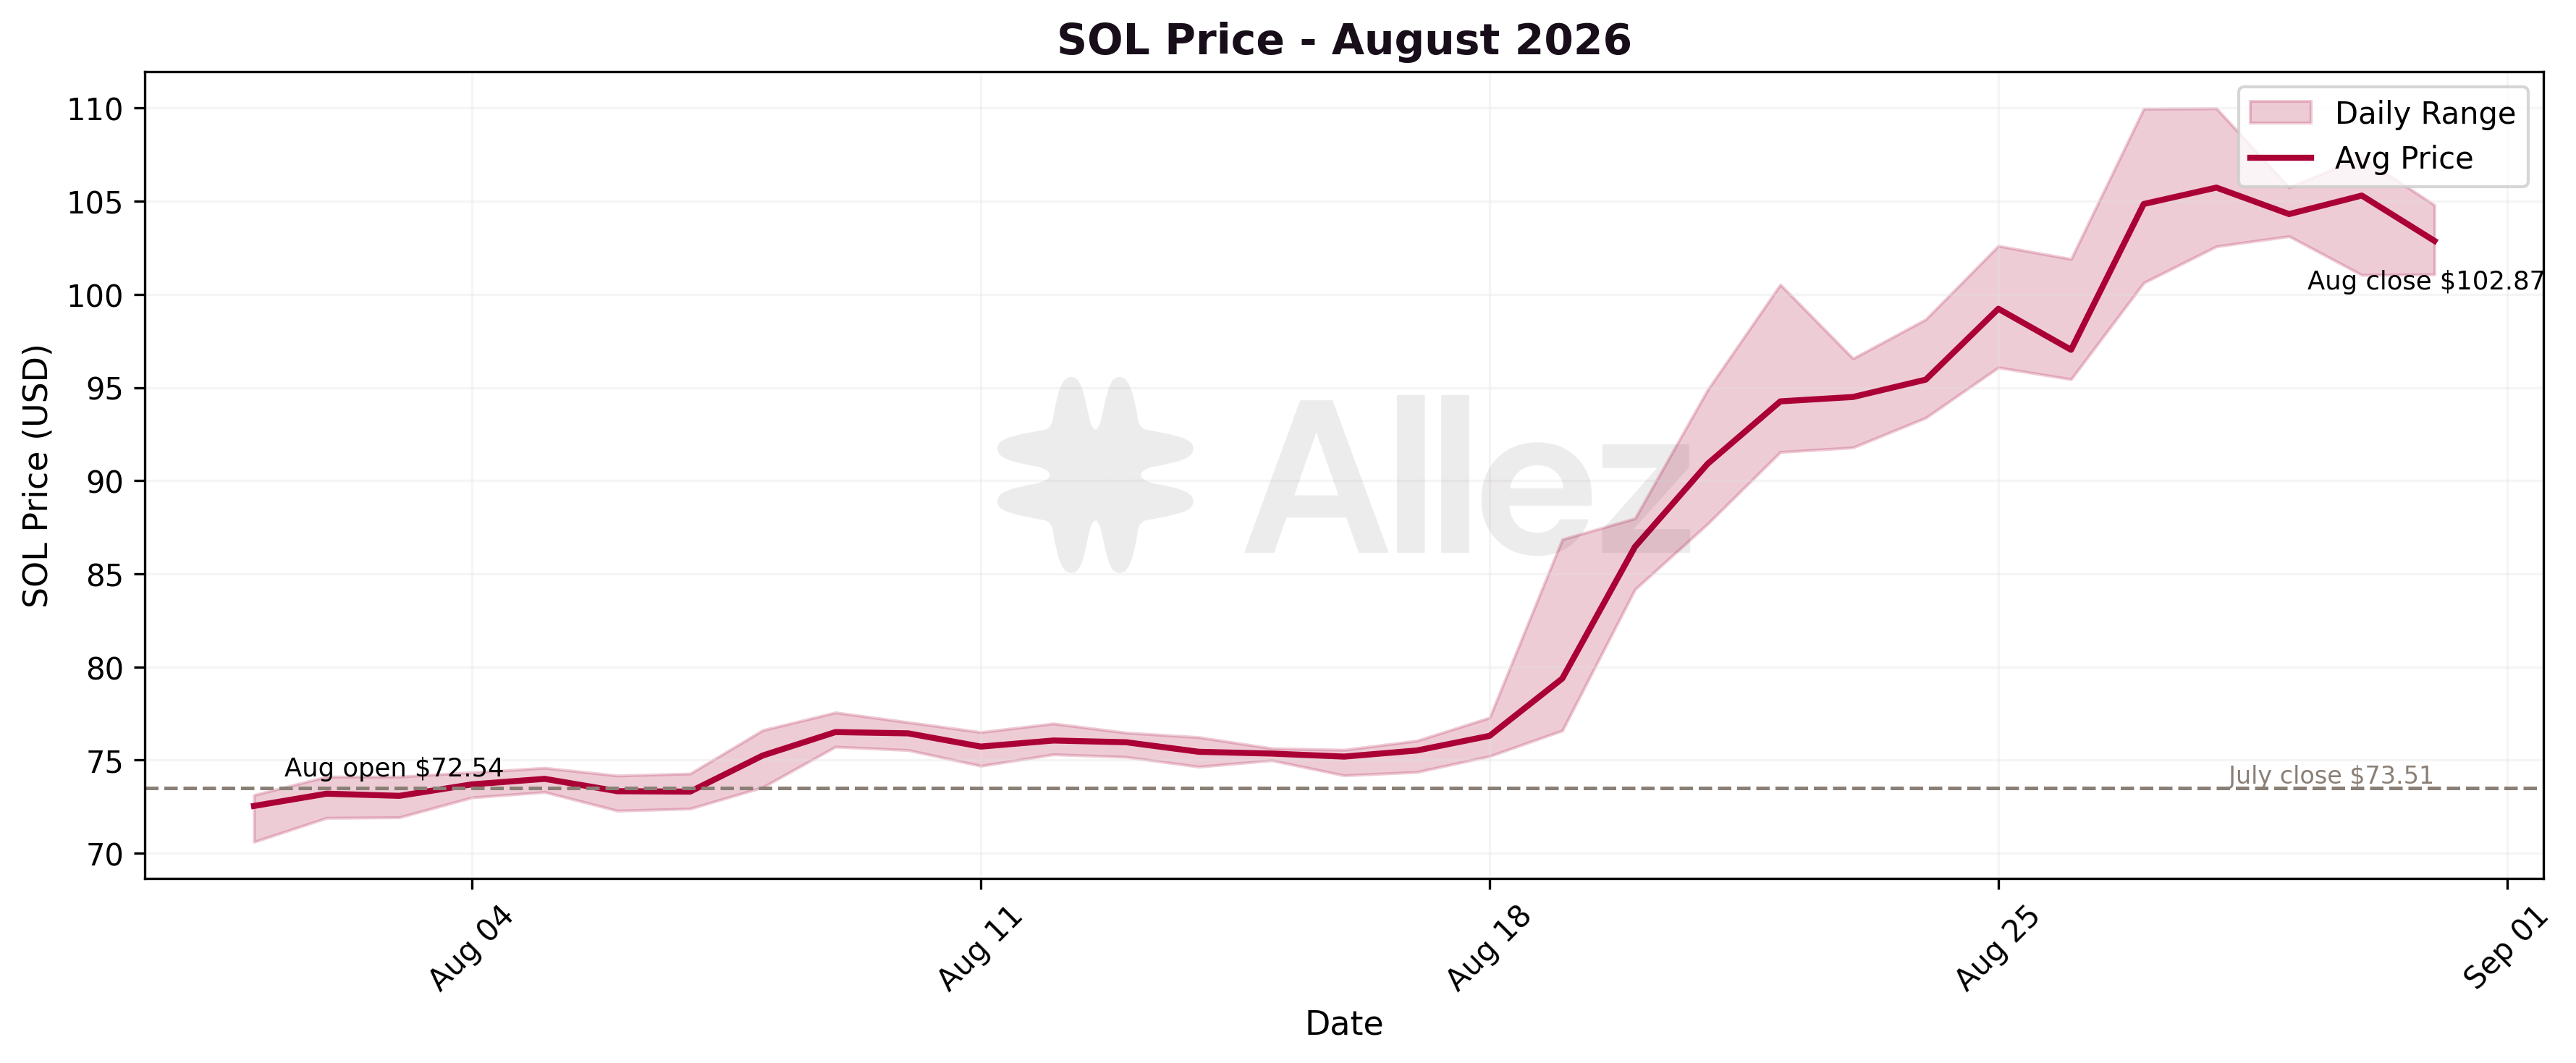
All SOL prices in this report are daily averages from the Jupiter price feed. SOL's daily average rose from $72.54 on August 1 to $102.87 on August 31, against $73.51 on July 31, up 39.9% month over month. It held in the mid-$70s through mid-month, then broke out after August 18. The highest daily average was $105.73 on August 28, and the highest intraday print $109.99, also on August 28.
Native SOL collateral fell by a token-quantity decline valued at $11.6M using month-end prices, even as the dollar value of the position rose 34.7%.
Kamino Ecosystem Updates:
-
Kamino Institutional Yield launched (August 3), an on-chain vault infrastructure for institutional credit markets as described by Kamino, opening with a Commodity Yield vault (Kamino, August 3). The vault reached about $30M by August 20 ahead of its first commodity-backed loan originations (Kamino, August 20) and $32.0M by month-end.
-
Kamino Fixed Rates entered private beta (August 25), an on-chain fixed-rate, fixed-term credit architecture, with a public launch targeted for Q3 2026 (Kamino, August 25).
-
HYPE market scaled (August 19): the isolated HYPE market, whose reserve dates from June 23 and which has carried the HYPE Market name since July 14, drew a fresh USDC liquidity push (Kamino, August 19). Supply rose from $1.31M at the end of July to $1.79M at the end of August, about 36%. The August post promoted a live market rather than a launch.
-
reUSD market launched (August 13), curated by Steakhouse, where reUSD is used as collateral to access USDC and USDG liquidity through an isolated credit market (Kamino, August 13; Kamino, August 21). The reserve dates from June 17 but carried no balance until August; market supply reached $22.8M by month-end, of which $12.3M is reUSD collateral and $10.5M stablecoins supplied for borrowing.
-
PAXG market promoted (August 11): the isolated PAXG (tokenized gold) market against USDG liquidity, whose reserve dates from July 2 (Kamino, August 11). Market supply grew from $0.79M at the end of July to $1.59M at the end of August. It was live before the August post.
-
USDe rewards raised (August 28): the promotional USDe rewards rate on the Ethena market rose to 4.75%, with leveraged USDe positions via Kamino Multiply reaching up to about 21% net APY as reported by Kamino, against more than $250M USDe supplied (Kamino, August 28).
-
Distribution integrations: the USDC Earn vault (powered by Kamino's SOL/BTC market) went live in the Seed Vault Wallet on Solana Mobile Seeker (Kamino, August 19), and Kamino Earn became accessible to Grok users via PayBox and MoonPay (Kamino, August 31). These widen the depositor base of existing markets rather than adding a new risk surface.
2. Macro View: Liquidity by Category
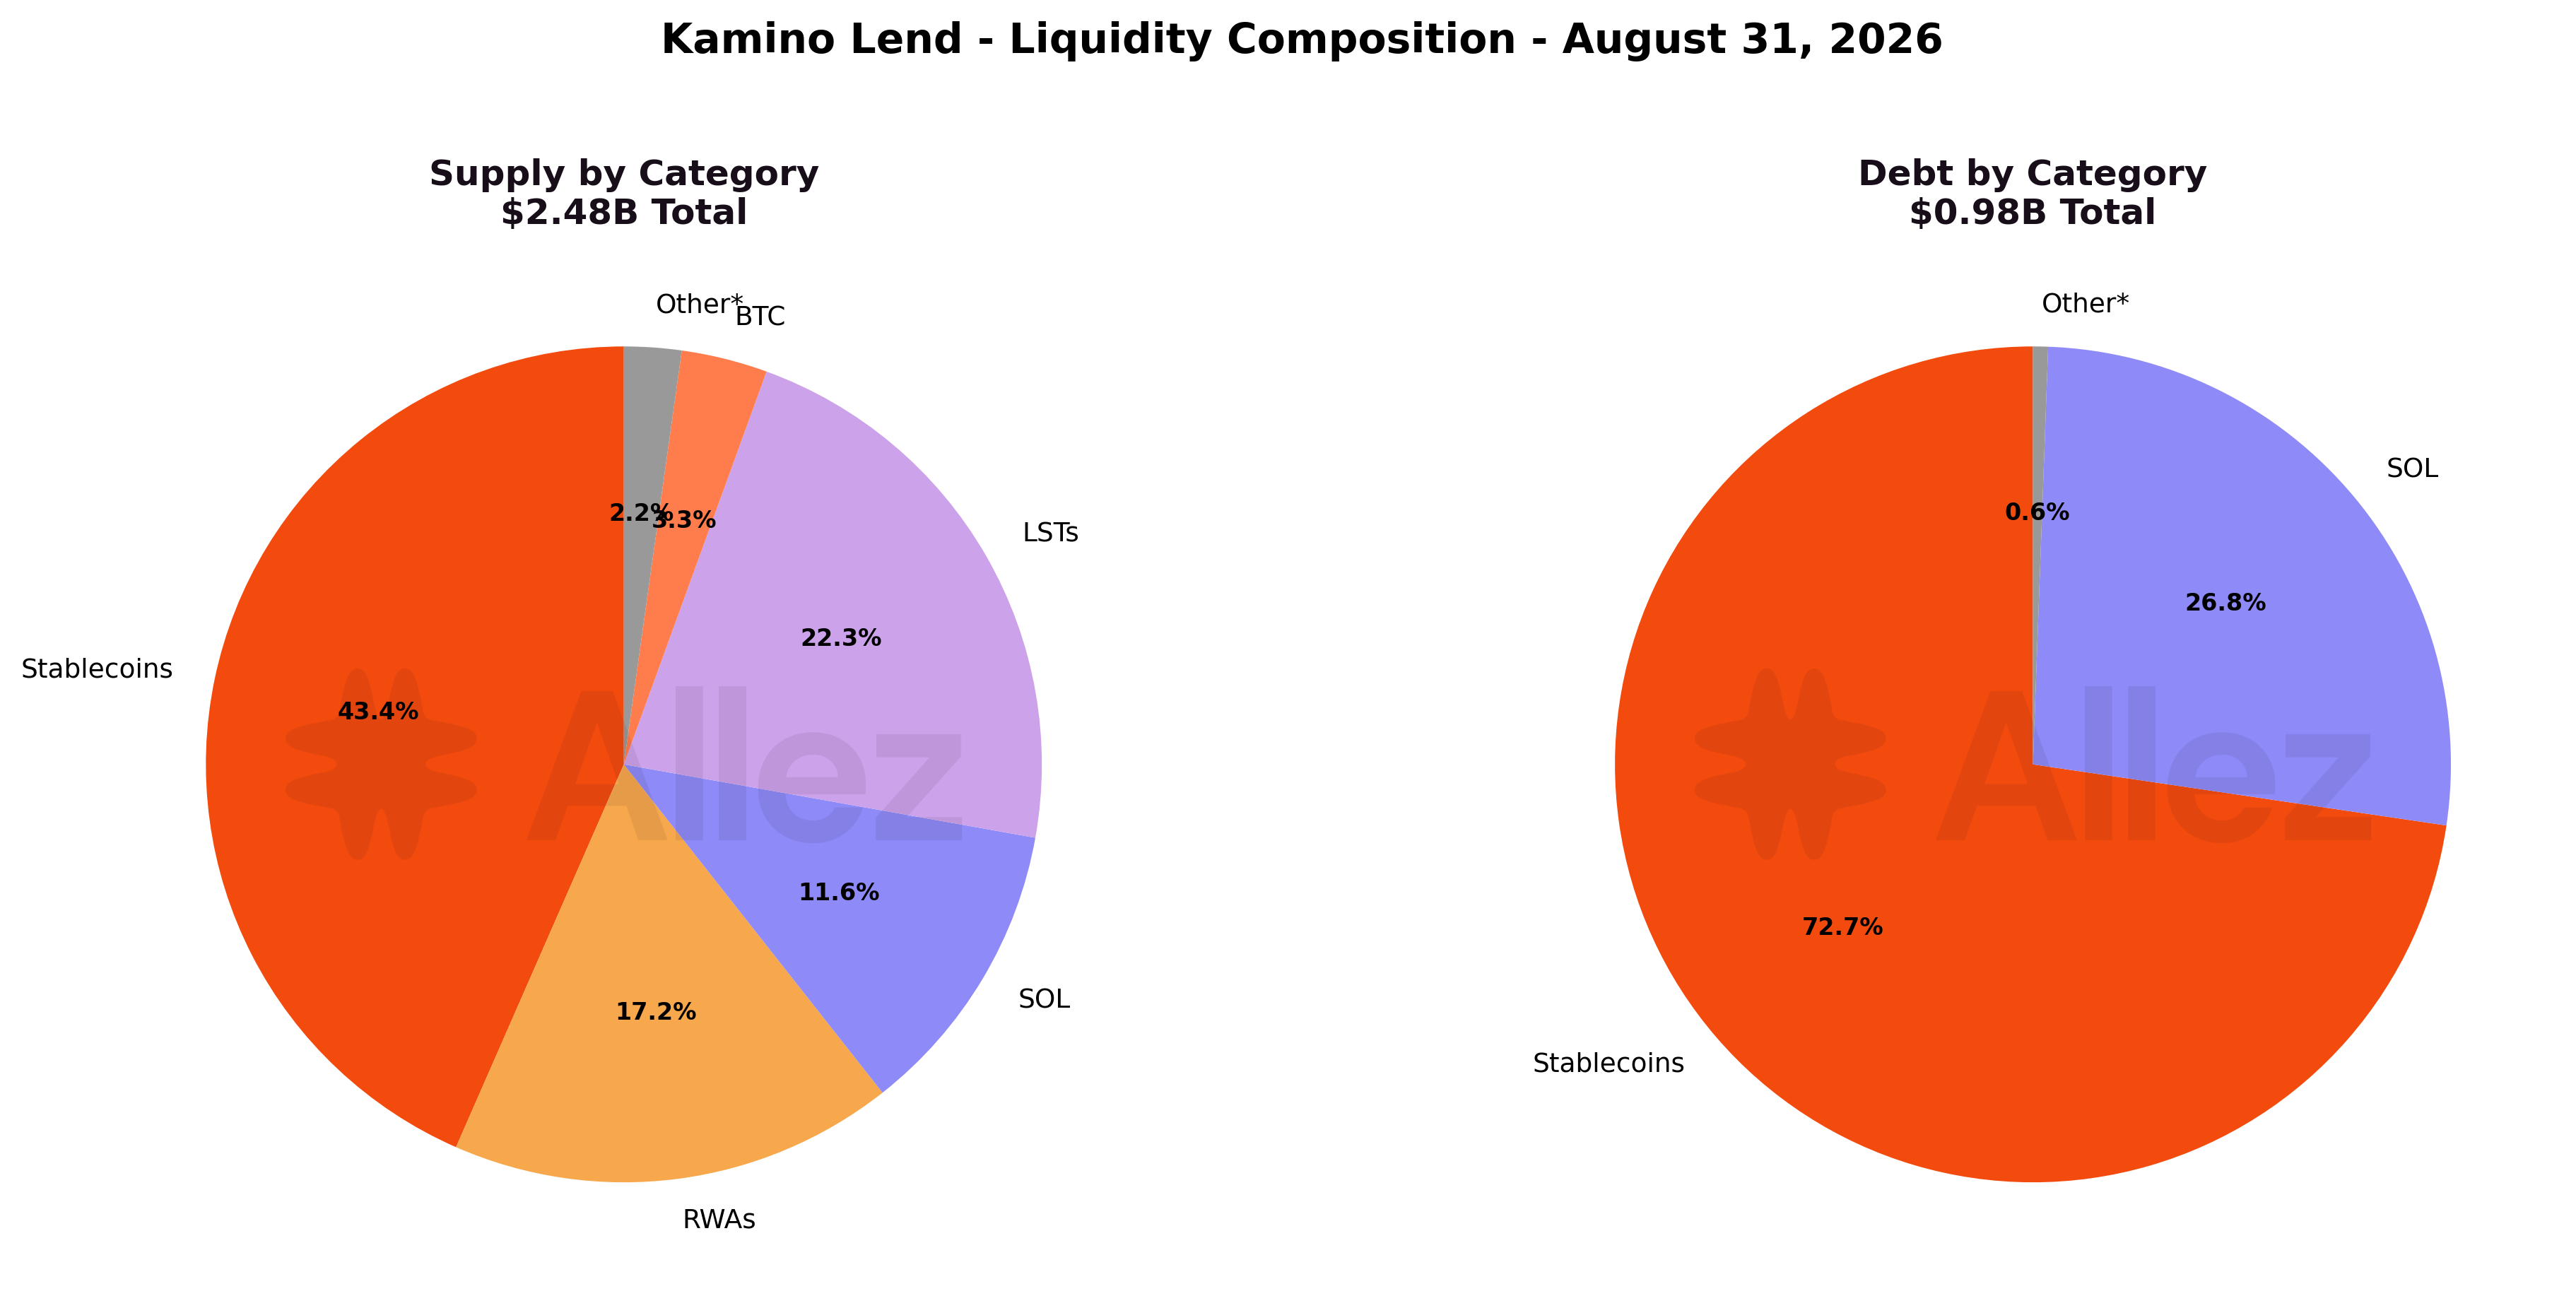
Stablecoins remain the largest category at 43.4% of supply, down from 48.6% in July as SOL-denominated collateral gained on the rally. The USD-denominated categories (Stablecoins plus RWAs) together account for 60.6% of protocol supply; SOL and LSTs together now hold 33.9%, up from 27.6% in July.
| Category | Supply | Share | Supply MoM | Debt MoM |
|---|---|---|---|---|
| Stablecoins | $1,076.0M | 43.4% | -0.2% | +0.2% |
| LSTs | $551.6M | 22.3% | +38.2% | +9.4% |
| RWAs | $426.1M | 17.2% | +1.9% | -20.1% |
| SOL | $286.7M | 11.6% | +34.7% | +36.0% |
| BTC | $82.6M | 3.3% | +31.3% | +26.9% |
| Other | $54.9M | 2.2% | +15.4% | +10.6% |
RWA and LST debt are under $3M in total, so their large percentage debt swings are not material to the protocol's risk profile.
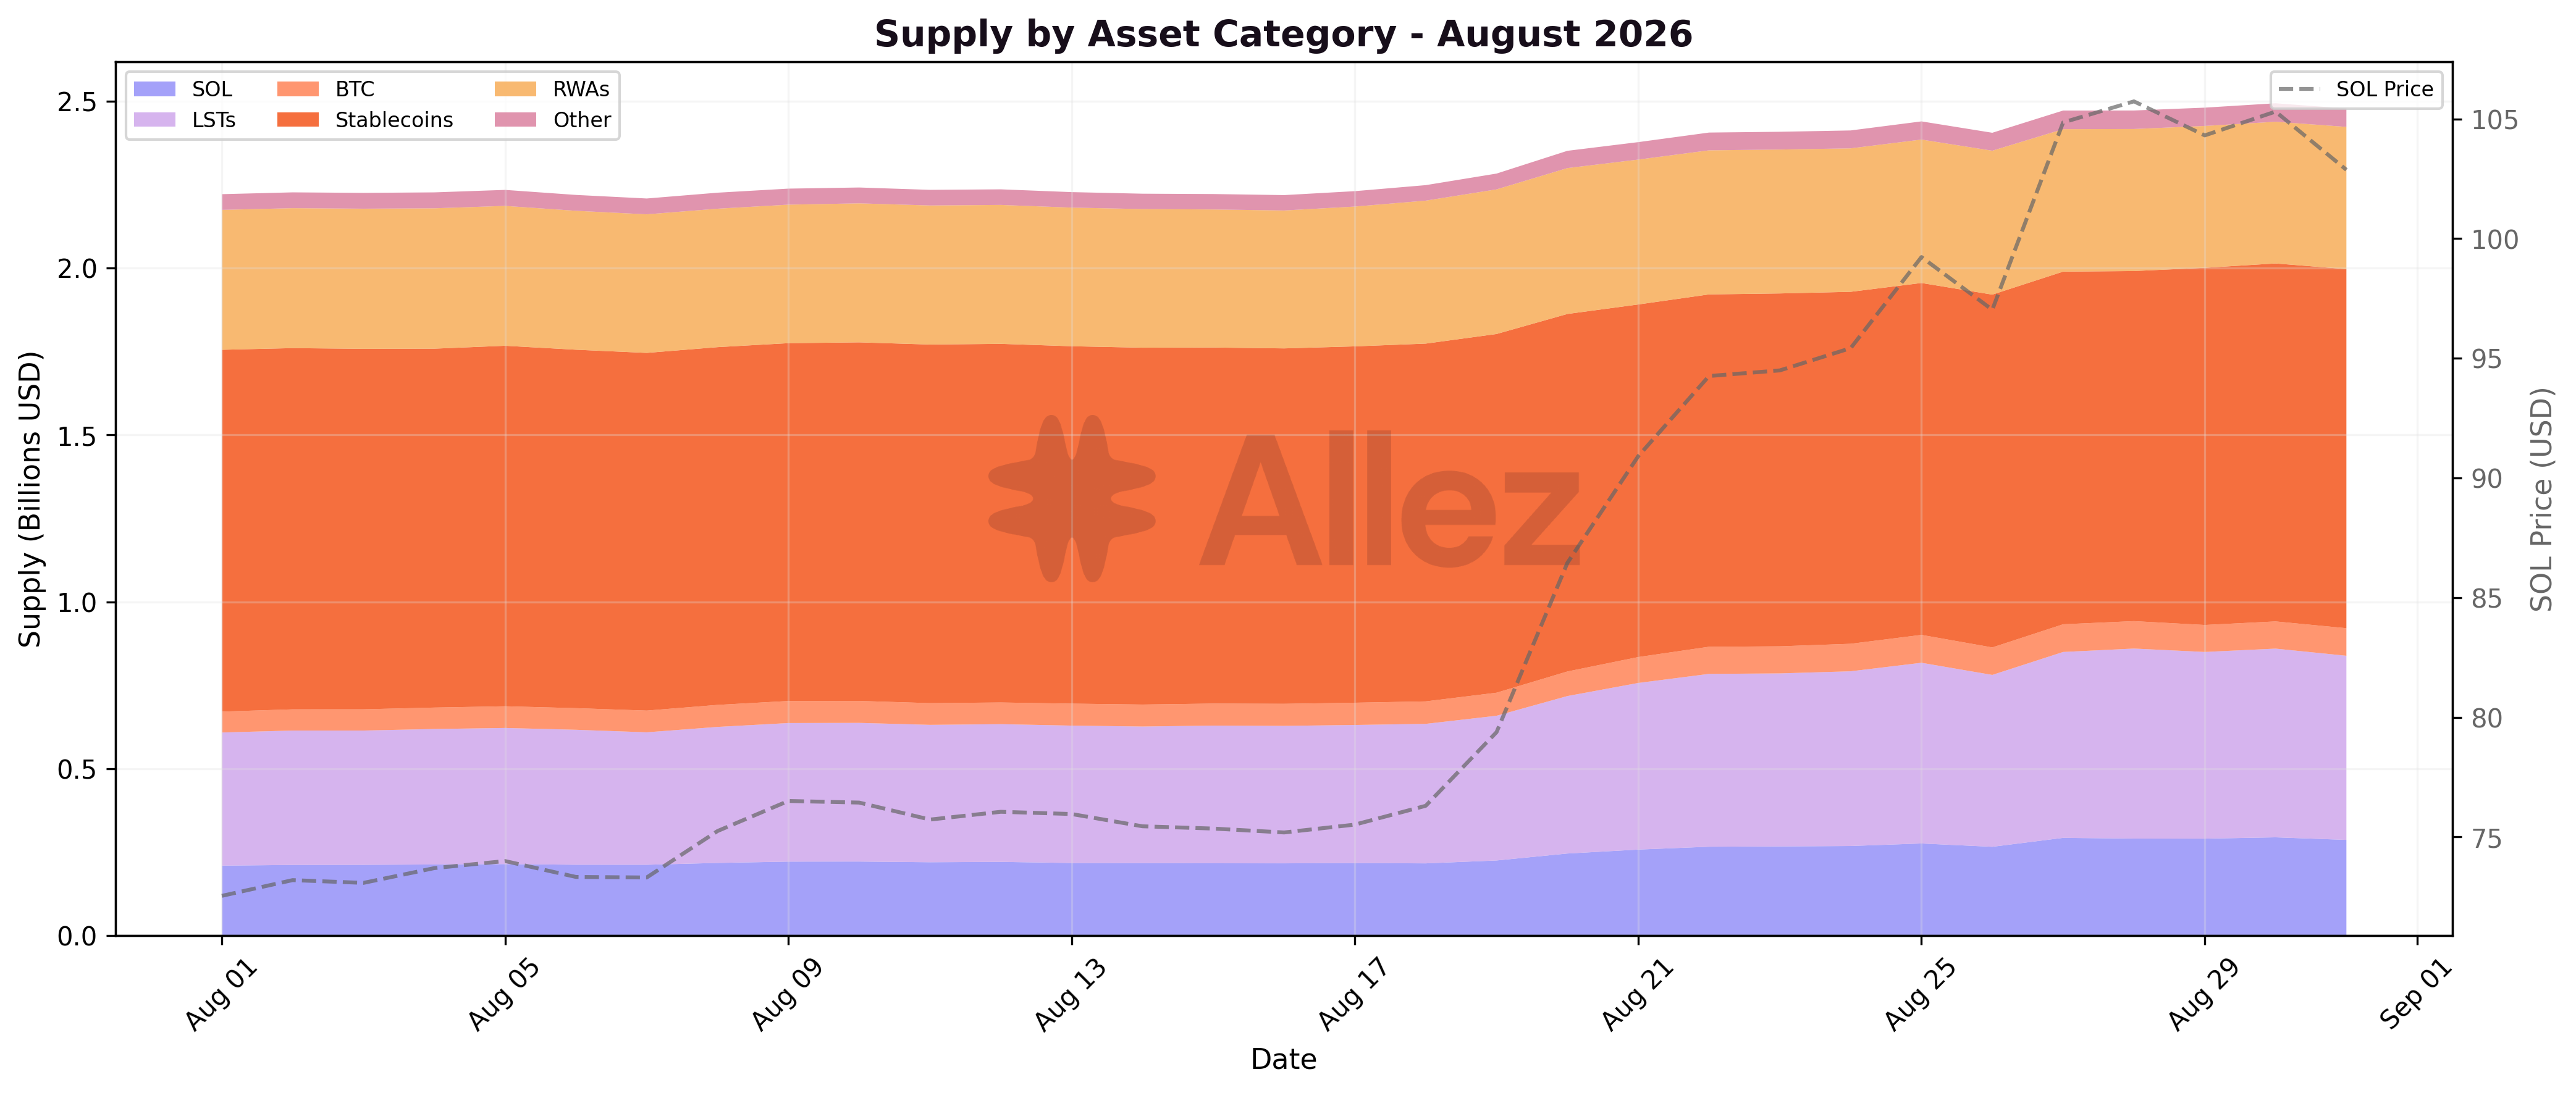
SOL and LST supply increased from August 18 as SOL broke out, while stablecoin and RWA supply held roughly flat.
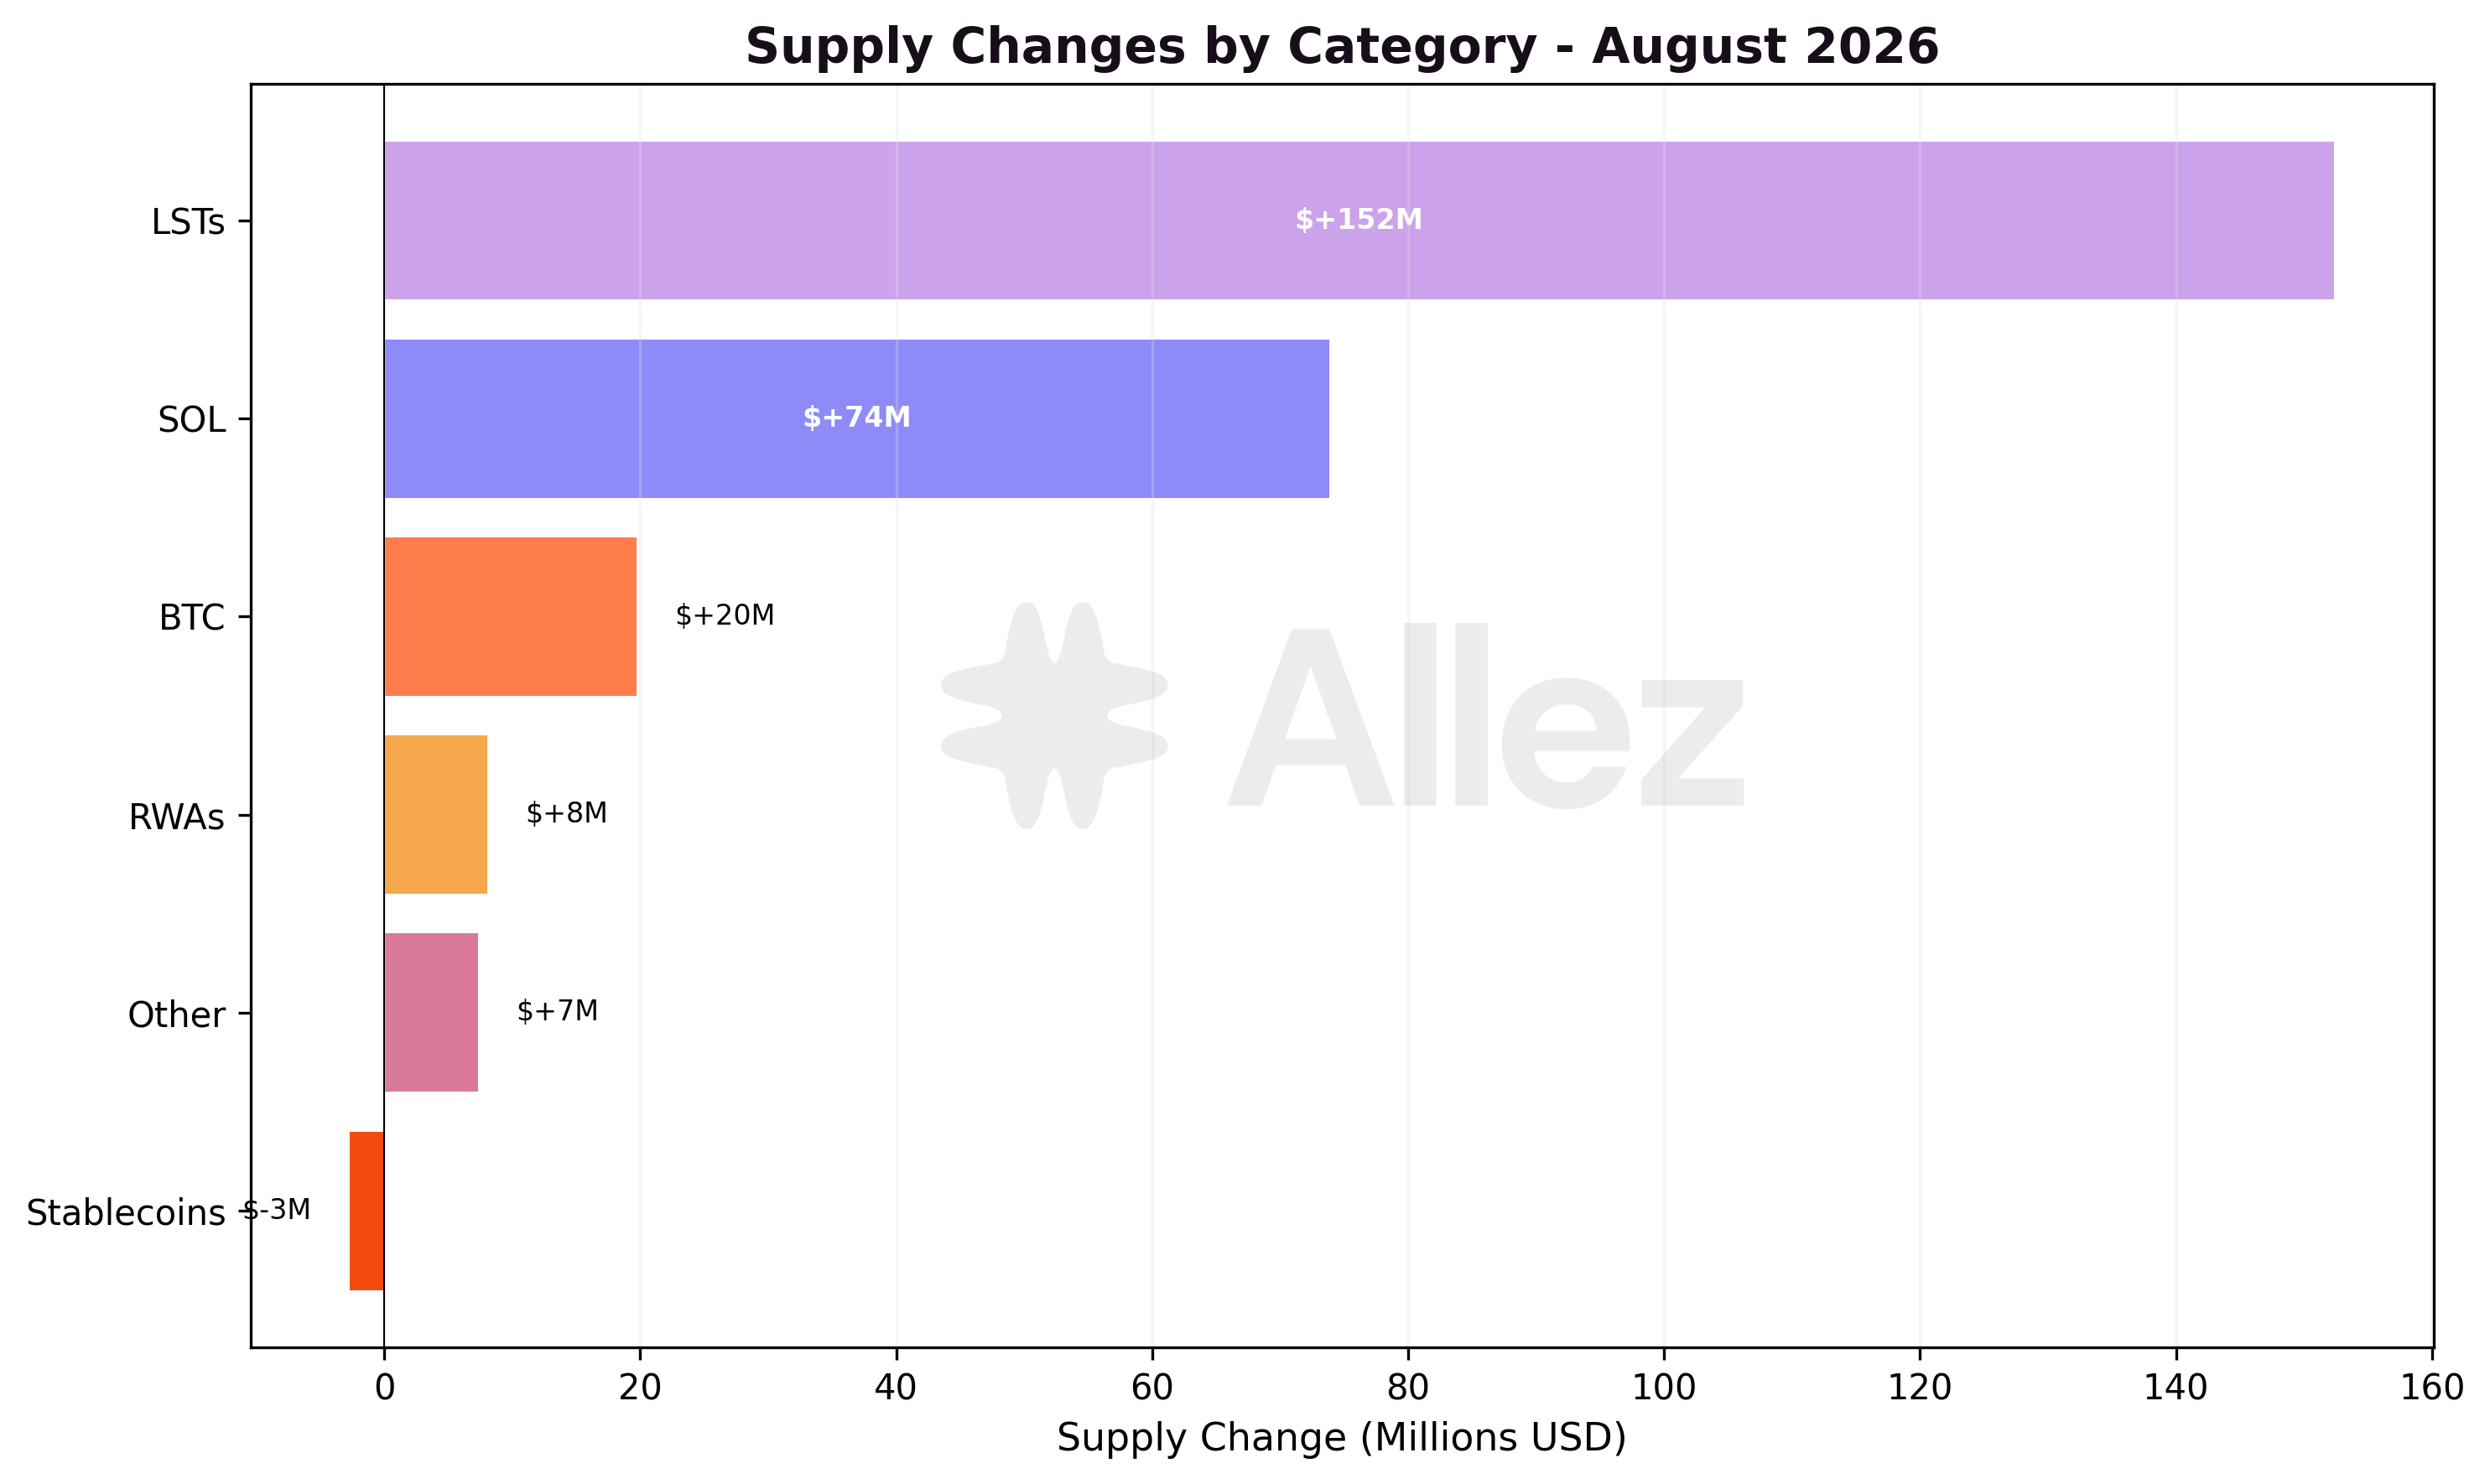
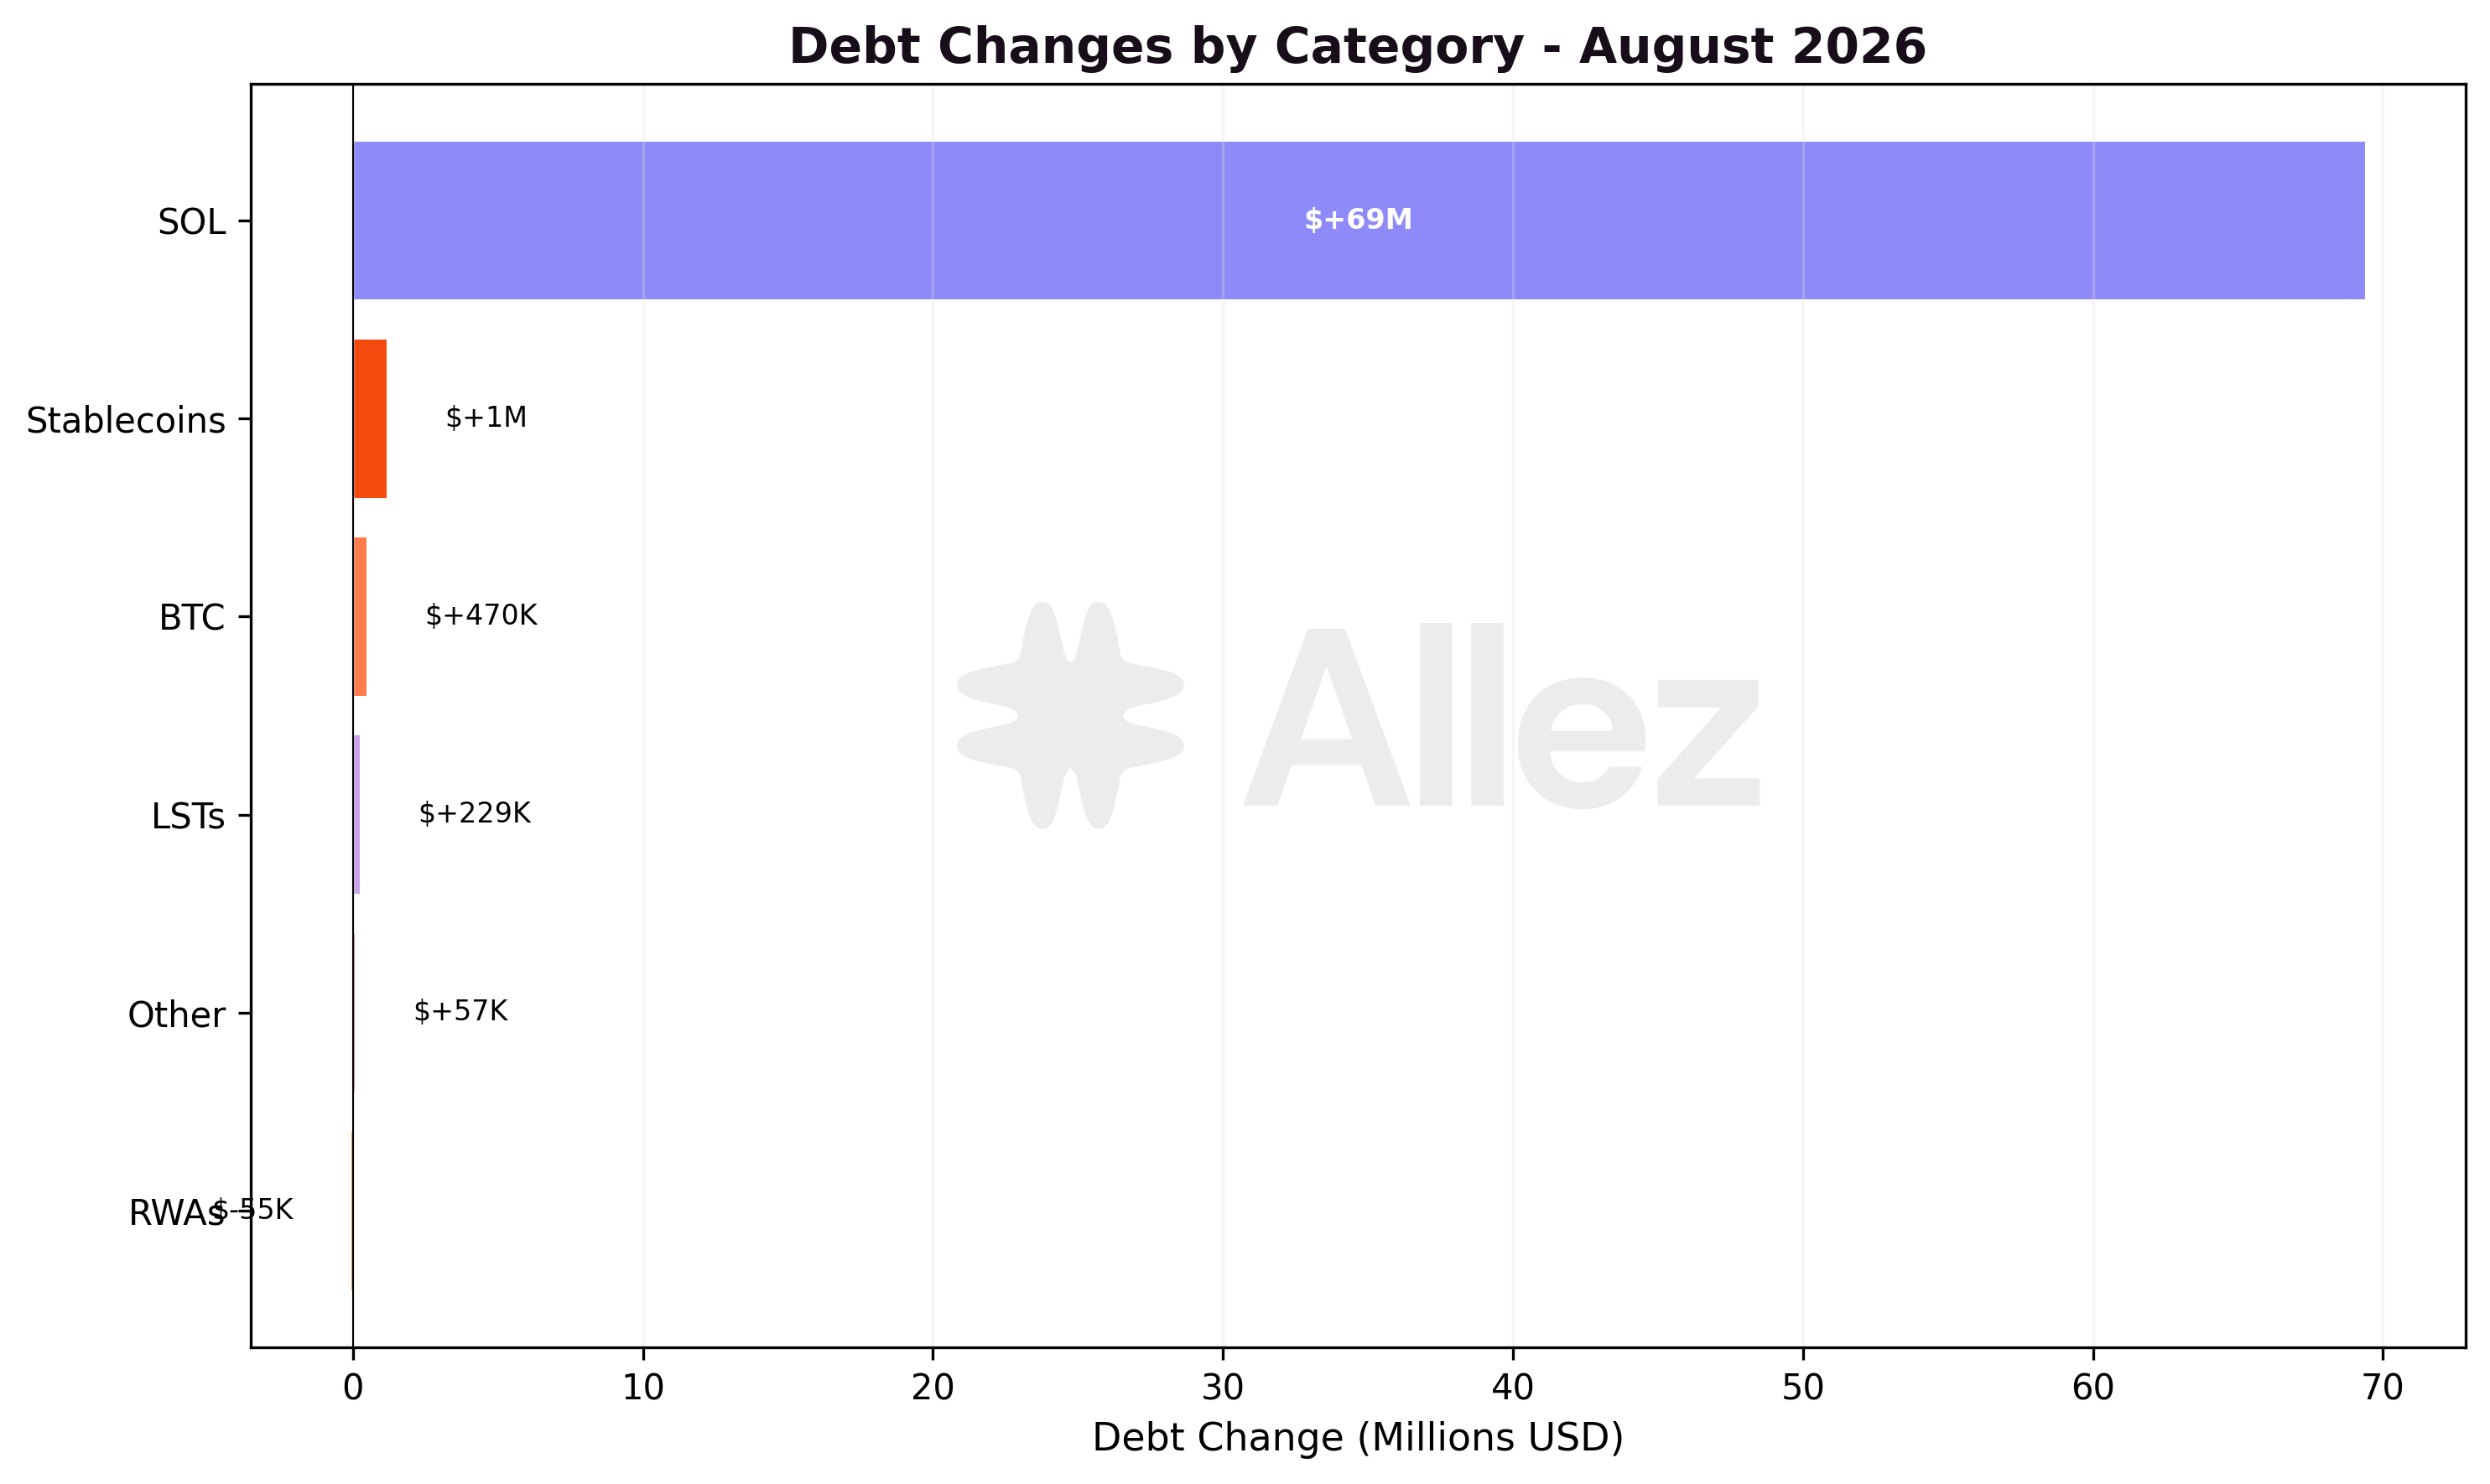
LSTs (+38.2%), SOL (+34.7%) and BTC (+31.3%) drove the growth, all tracking the price rally. SOL's token balance fell over the month, and the LST and BTC categories moved largely with their prices, though dfdvSOL and JitoSOL added LST deposits. Stablecoins were flat at -0.2% and RWAs edged up 1.9%. SOL debt rose 36.0%, in line with the price, since SOL-denominated borrows revalue upward as SOL rises.
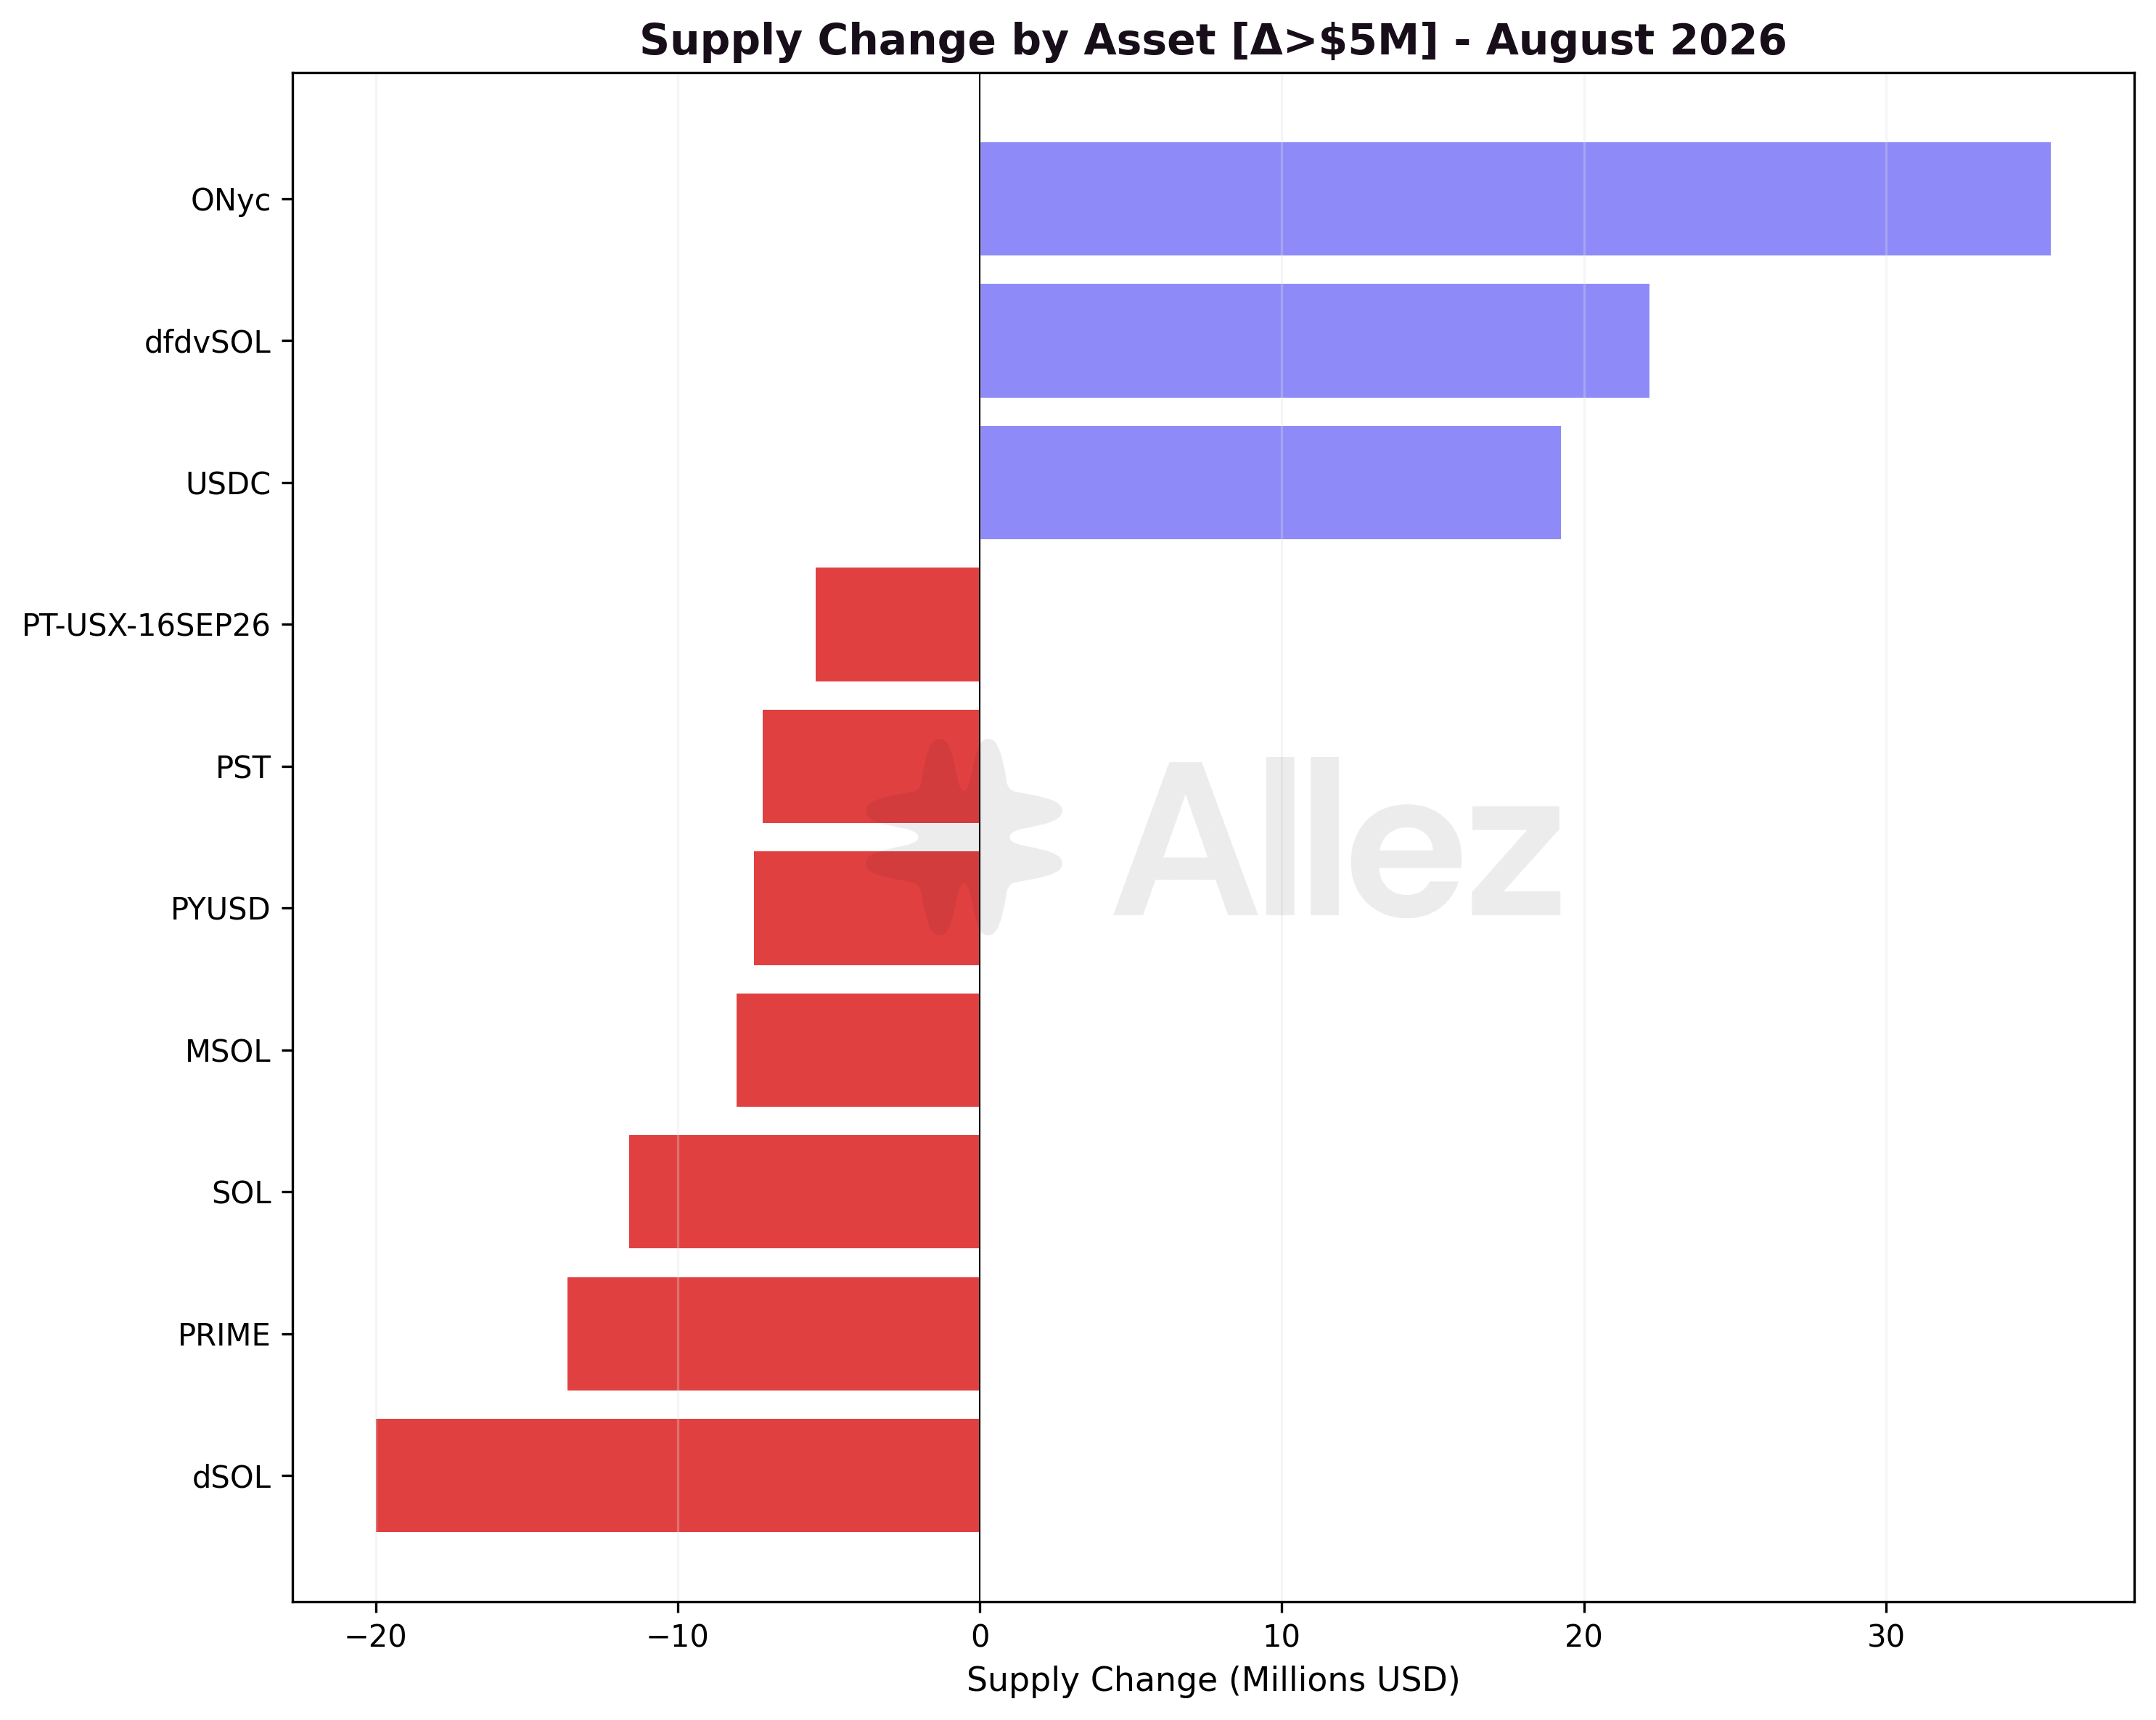
Note: Per-asset figures reflect token quantity changes valued at current prices, isolating user deposit/withdrawal behavior.
Major Inflows: ONyc (+$35.4M), dfdvSOL (+$22.2M), USDC (+$19.2M), JitoSOL (+$4.2M), fBTC (+$2.8M).
Major Outflows: dSOL (-$20.0M), PRIME (-$13.6M), SOL (-$11.6M), mSOL (-$8.0M), PYUSD (-$7.5M).
The month's largest inflow was ONyc (+$35.4M), the collateral side of the OnRe market's rise, followed by dfdvSOL (+$22.2M) and USDC (+$19.2M). These deposits are modest against the $258.6M of headline supply growth, of which SOL, LST and BTC revaluation supplied about $245.8M, roughly 95%. Outflows concentrated in other liquid-staking tokens (dSOL, mSOL) and the Prime credit token PRIME, alongside native SOL, a token-quantity reduction that runs against the category's dollar gain.
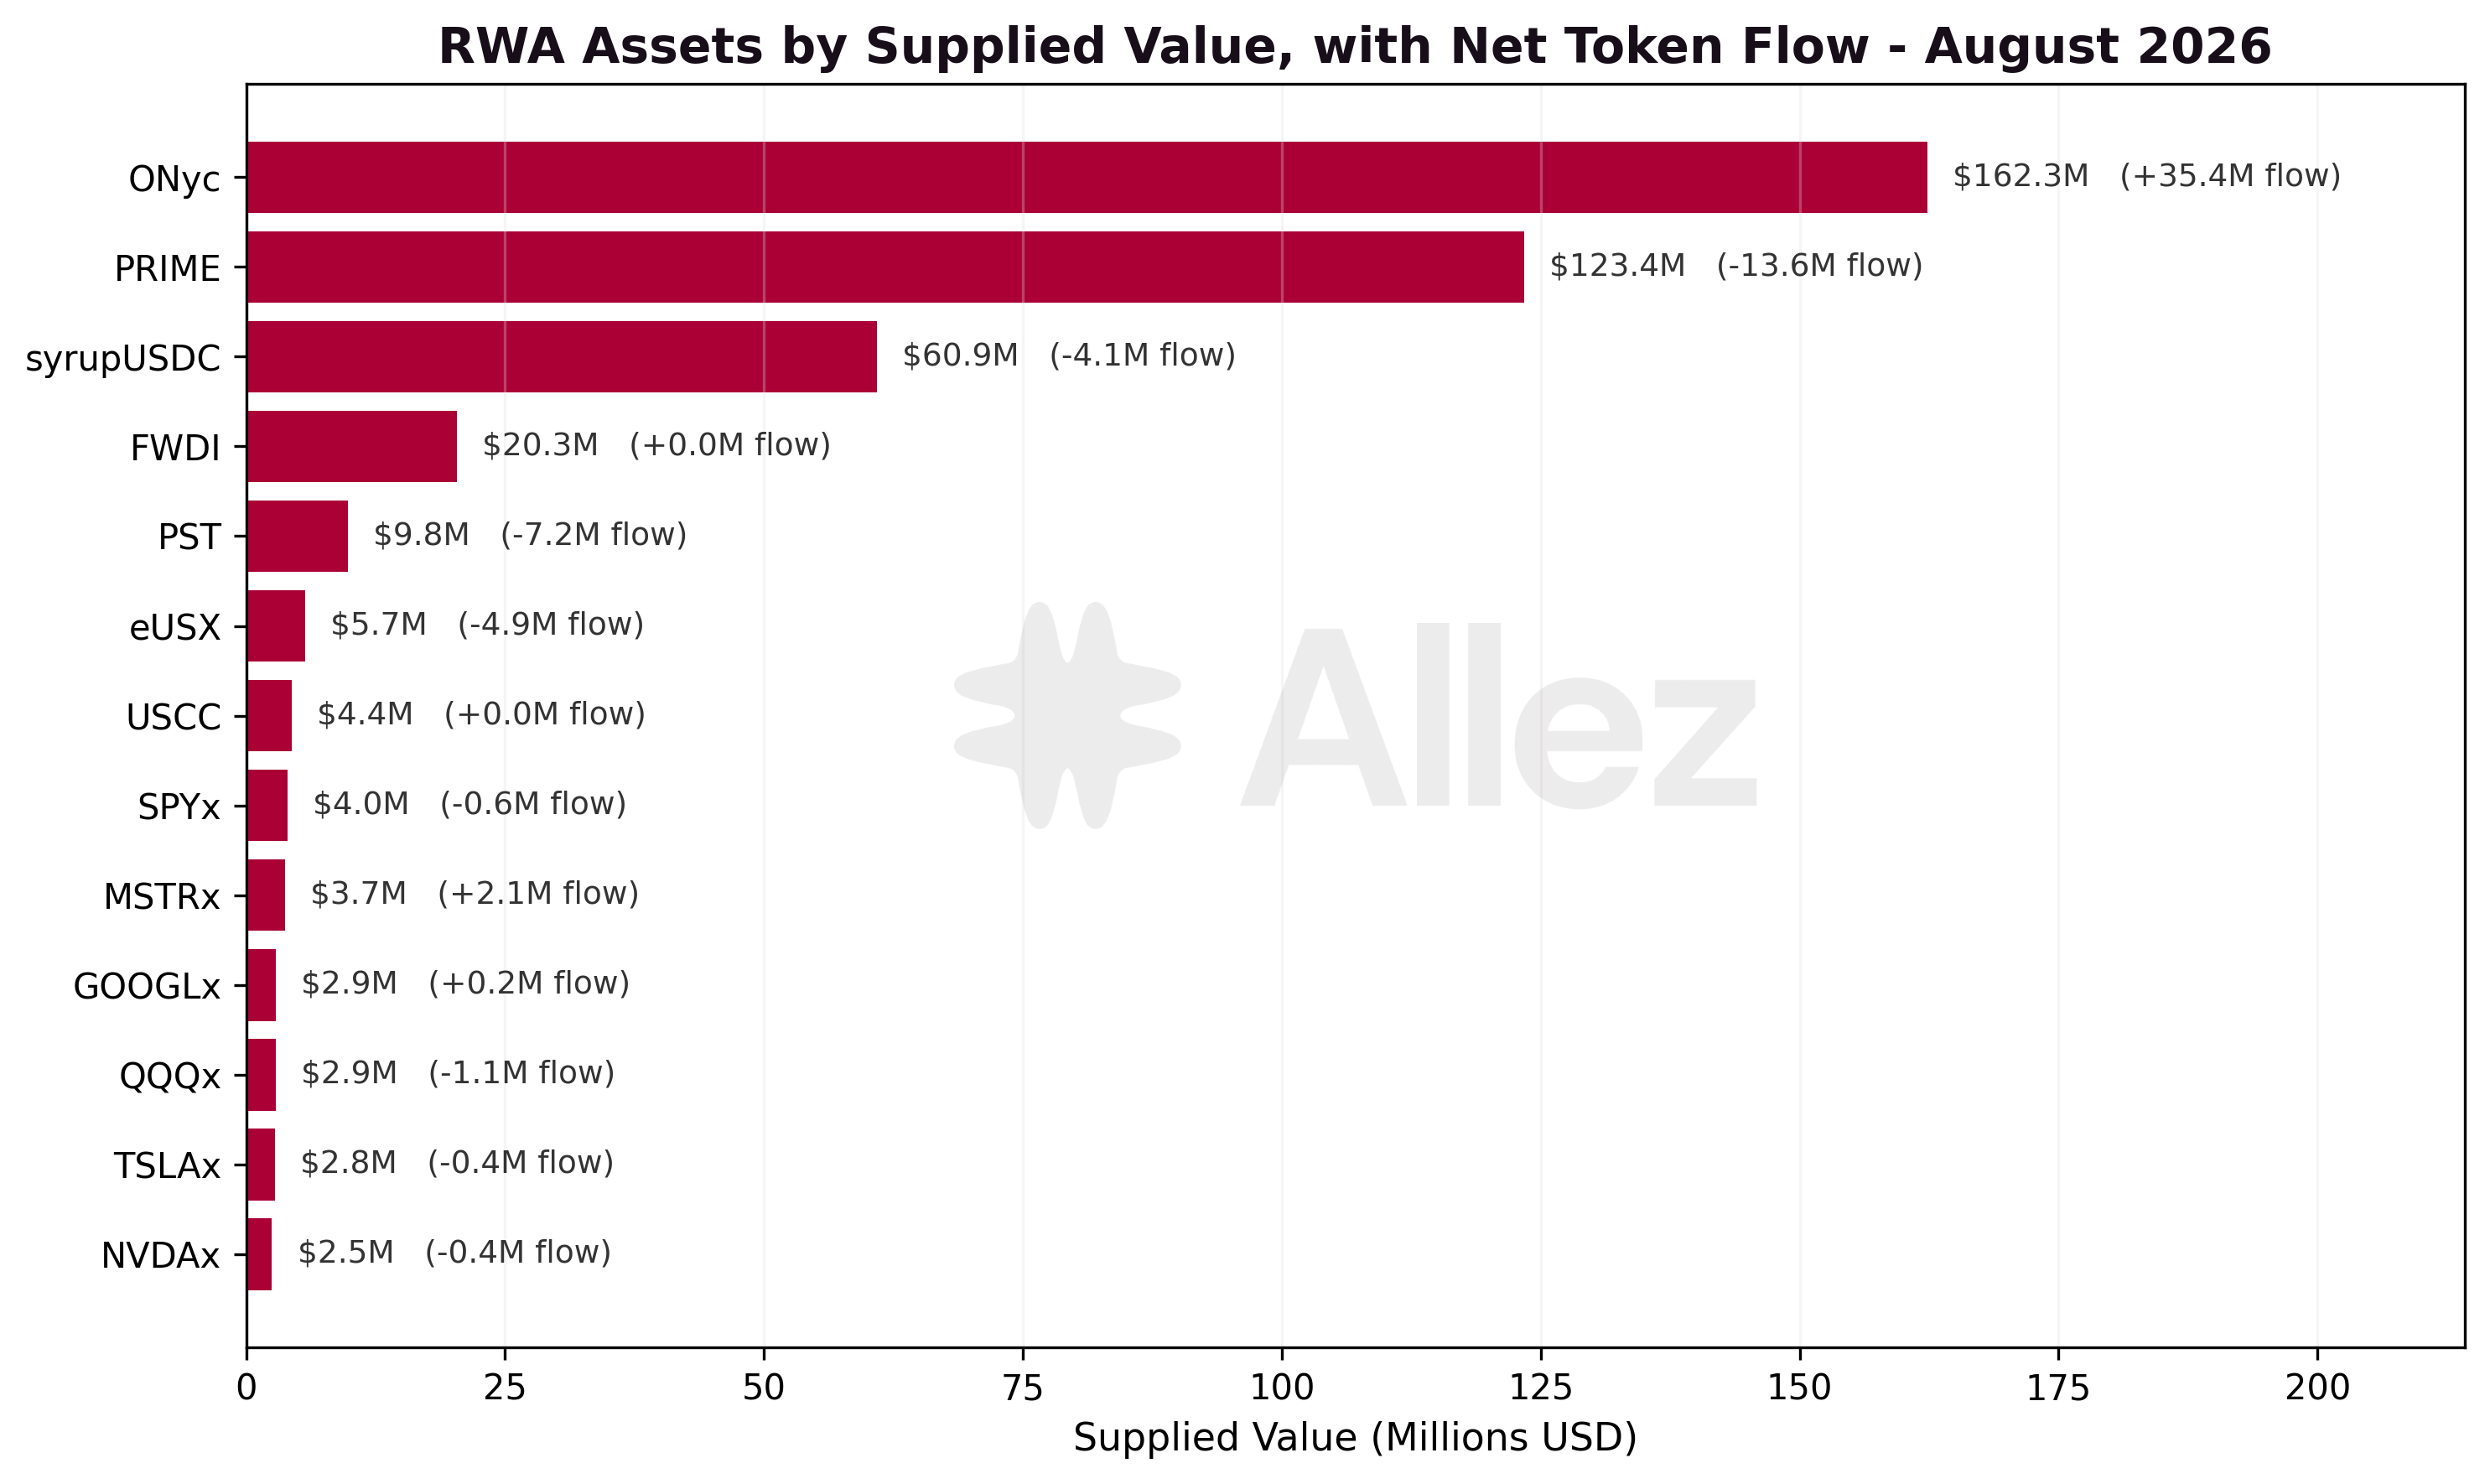
The RWA category's 1.9% aggregate rise (about $8.0M) masks a split within it. ONyc added $35.4M of net deposits and passed PRIME ($162.3M against $123.4M supplied) to become the largest RWA asset on Kamino, while PRIME (-$13.6M), PST (-$7.0M) and syrupUSDC (-$4.1M) contracted. ONyc is the one RWA with material deposit-led growth this month; the rest of the category was flat to negative.
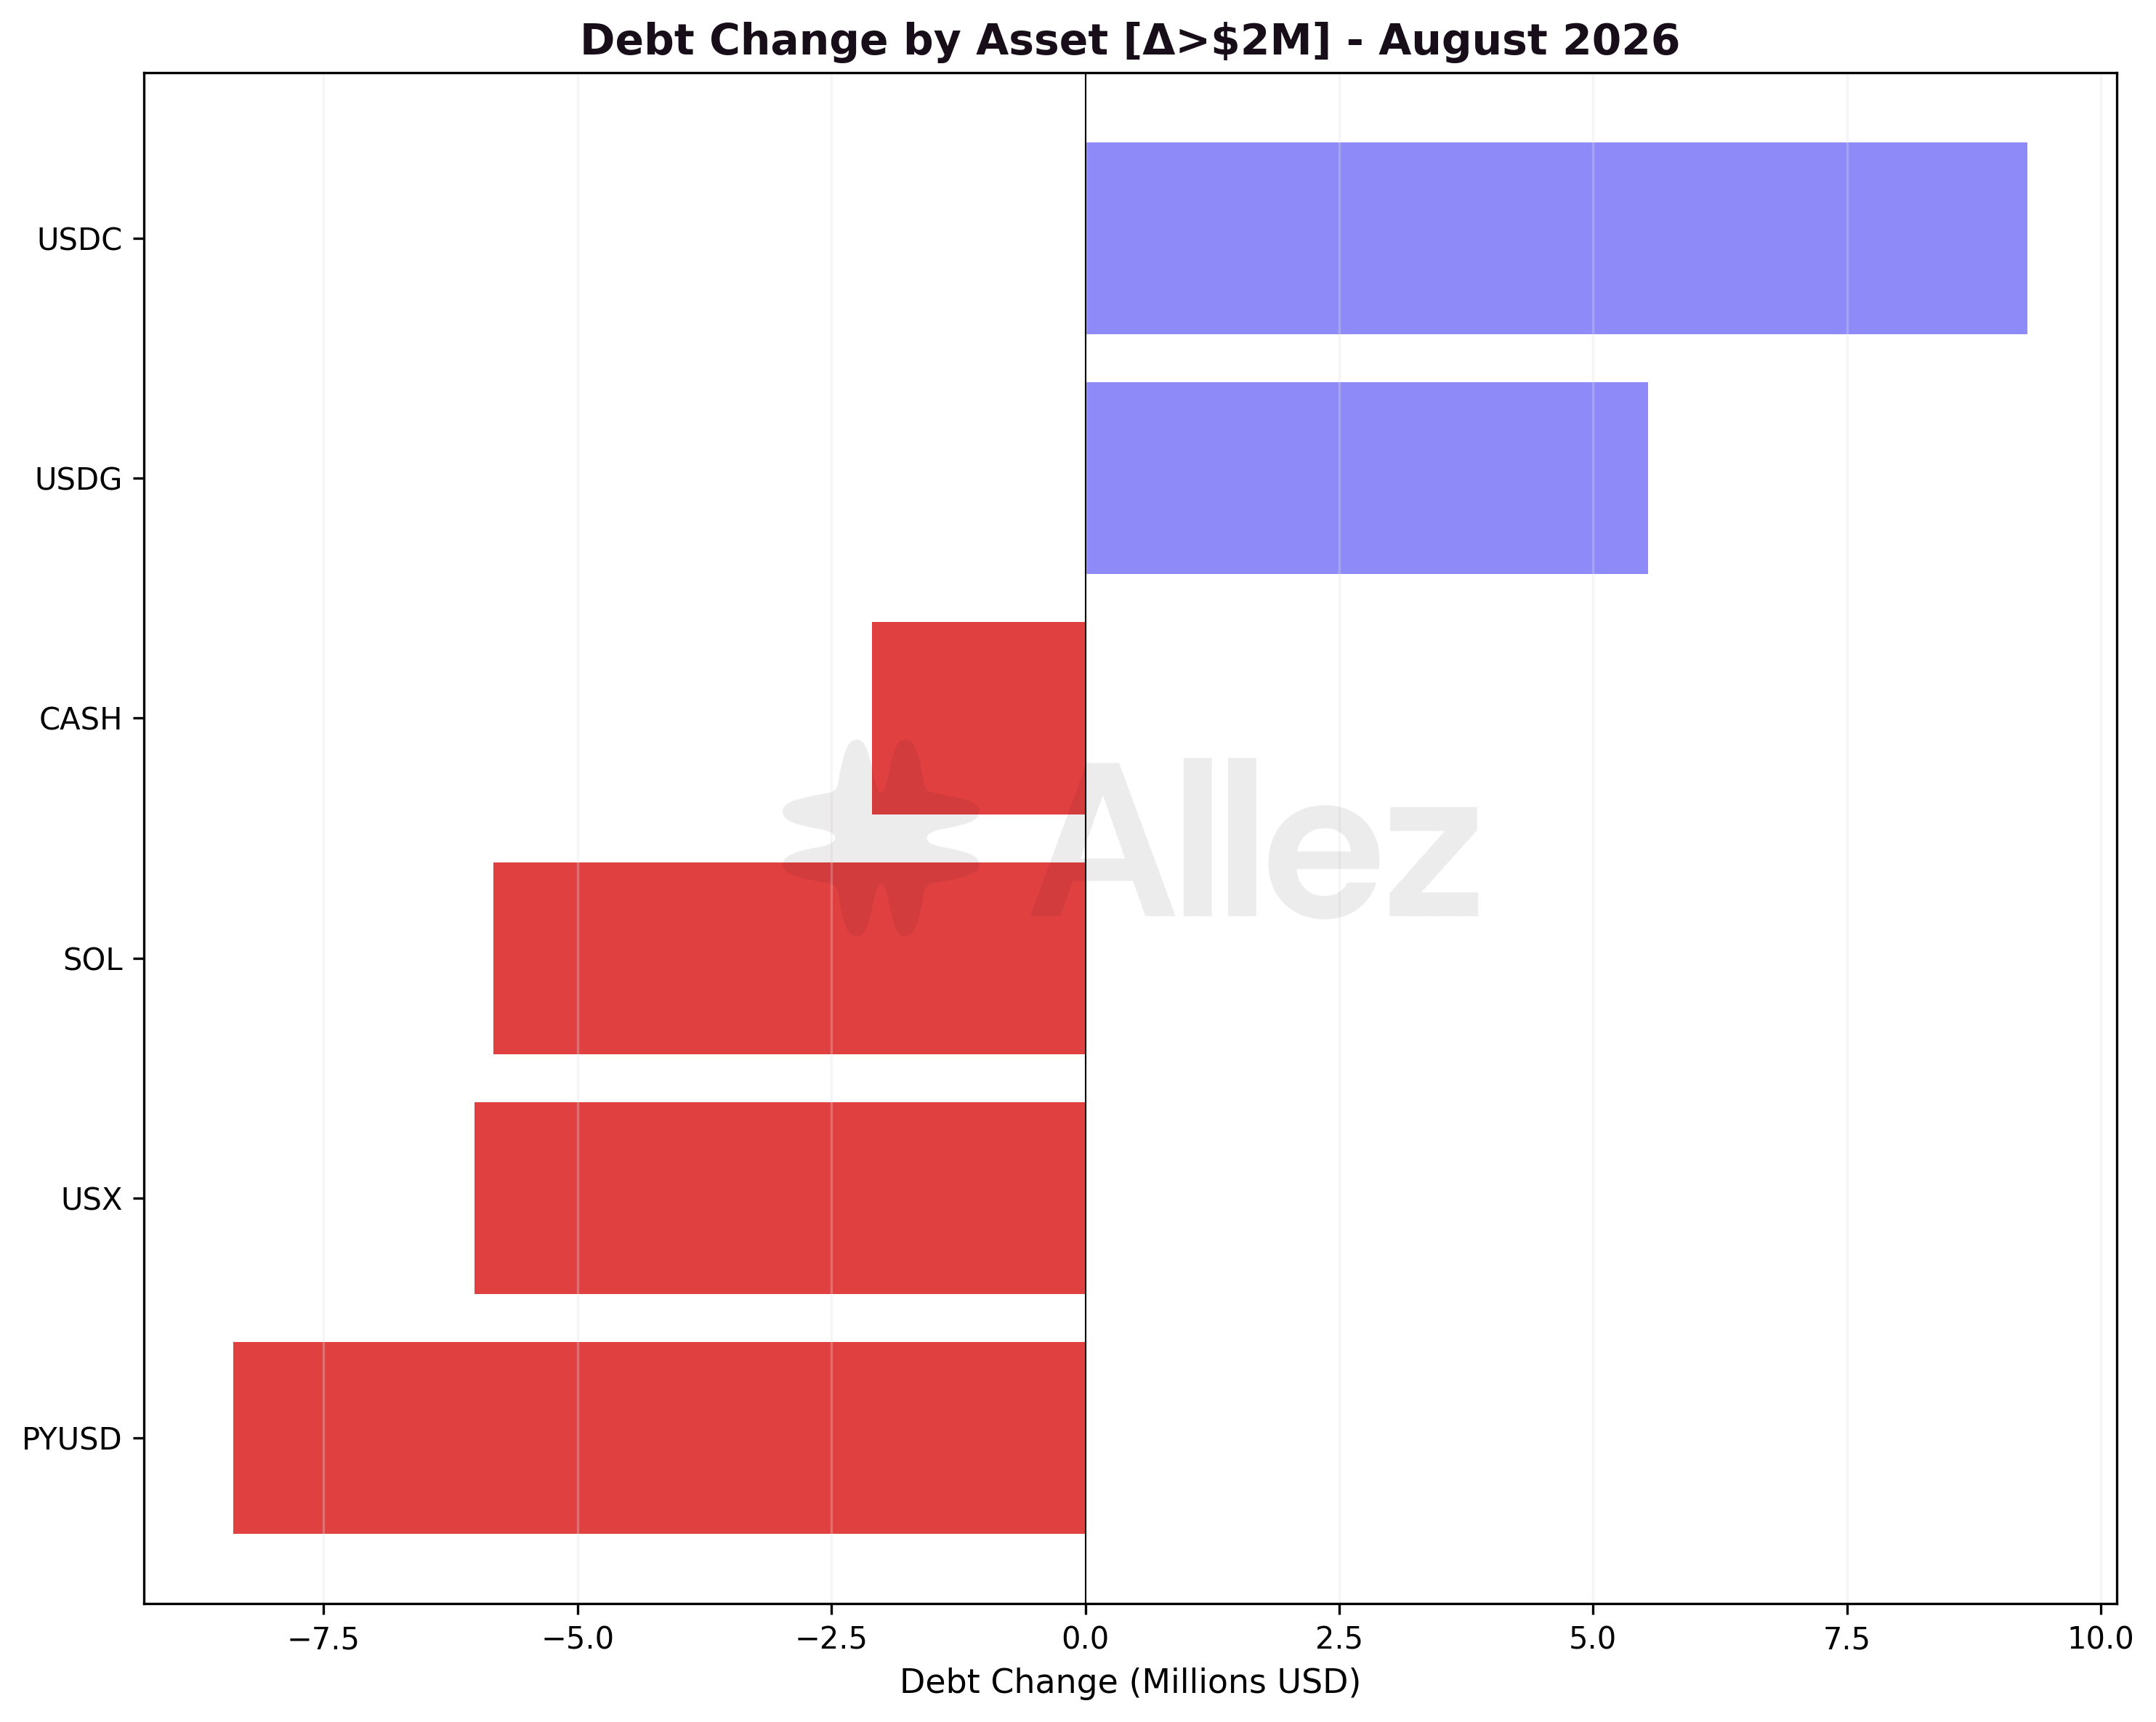
Borrowing rose in USDC (+$9.3M), USDG (+$5.5M) and USDT (+$1.2M), and fell in PYUSD (-$8.4M), USX (-$6.0M) and native SOL (a token-quantity decline valued at $5.8M using month-end prices). Net stablecoin borrowing barely moved once the USDC and USDG gains are set against the PYUSD and USX declines, matching the flat stablecoin debt line.
3. Risk and Liquidations
Distance to Liquidation (DTL): Correlated vs Uncorrelated Positions
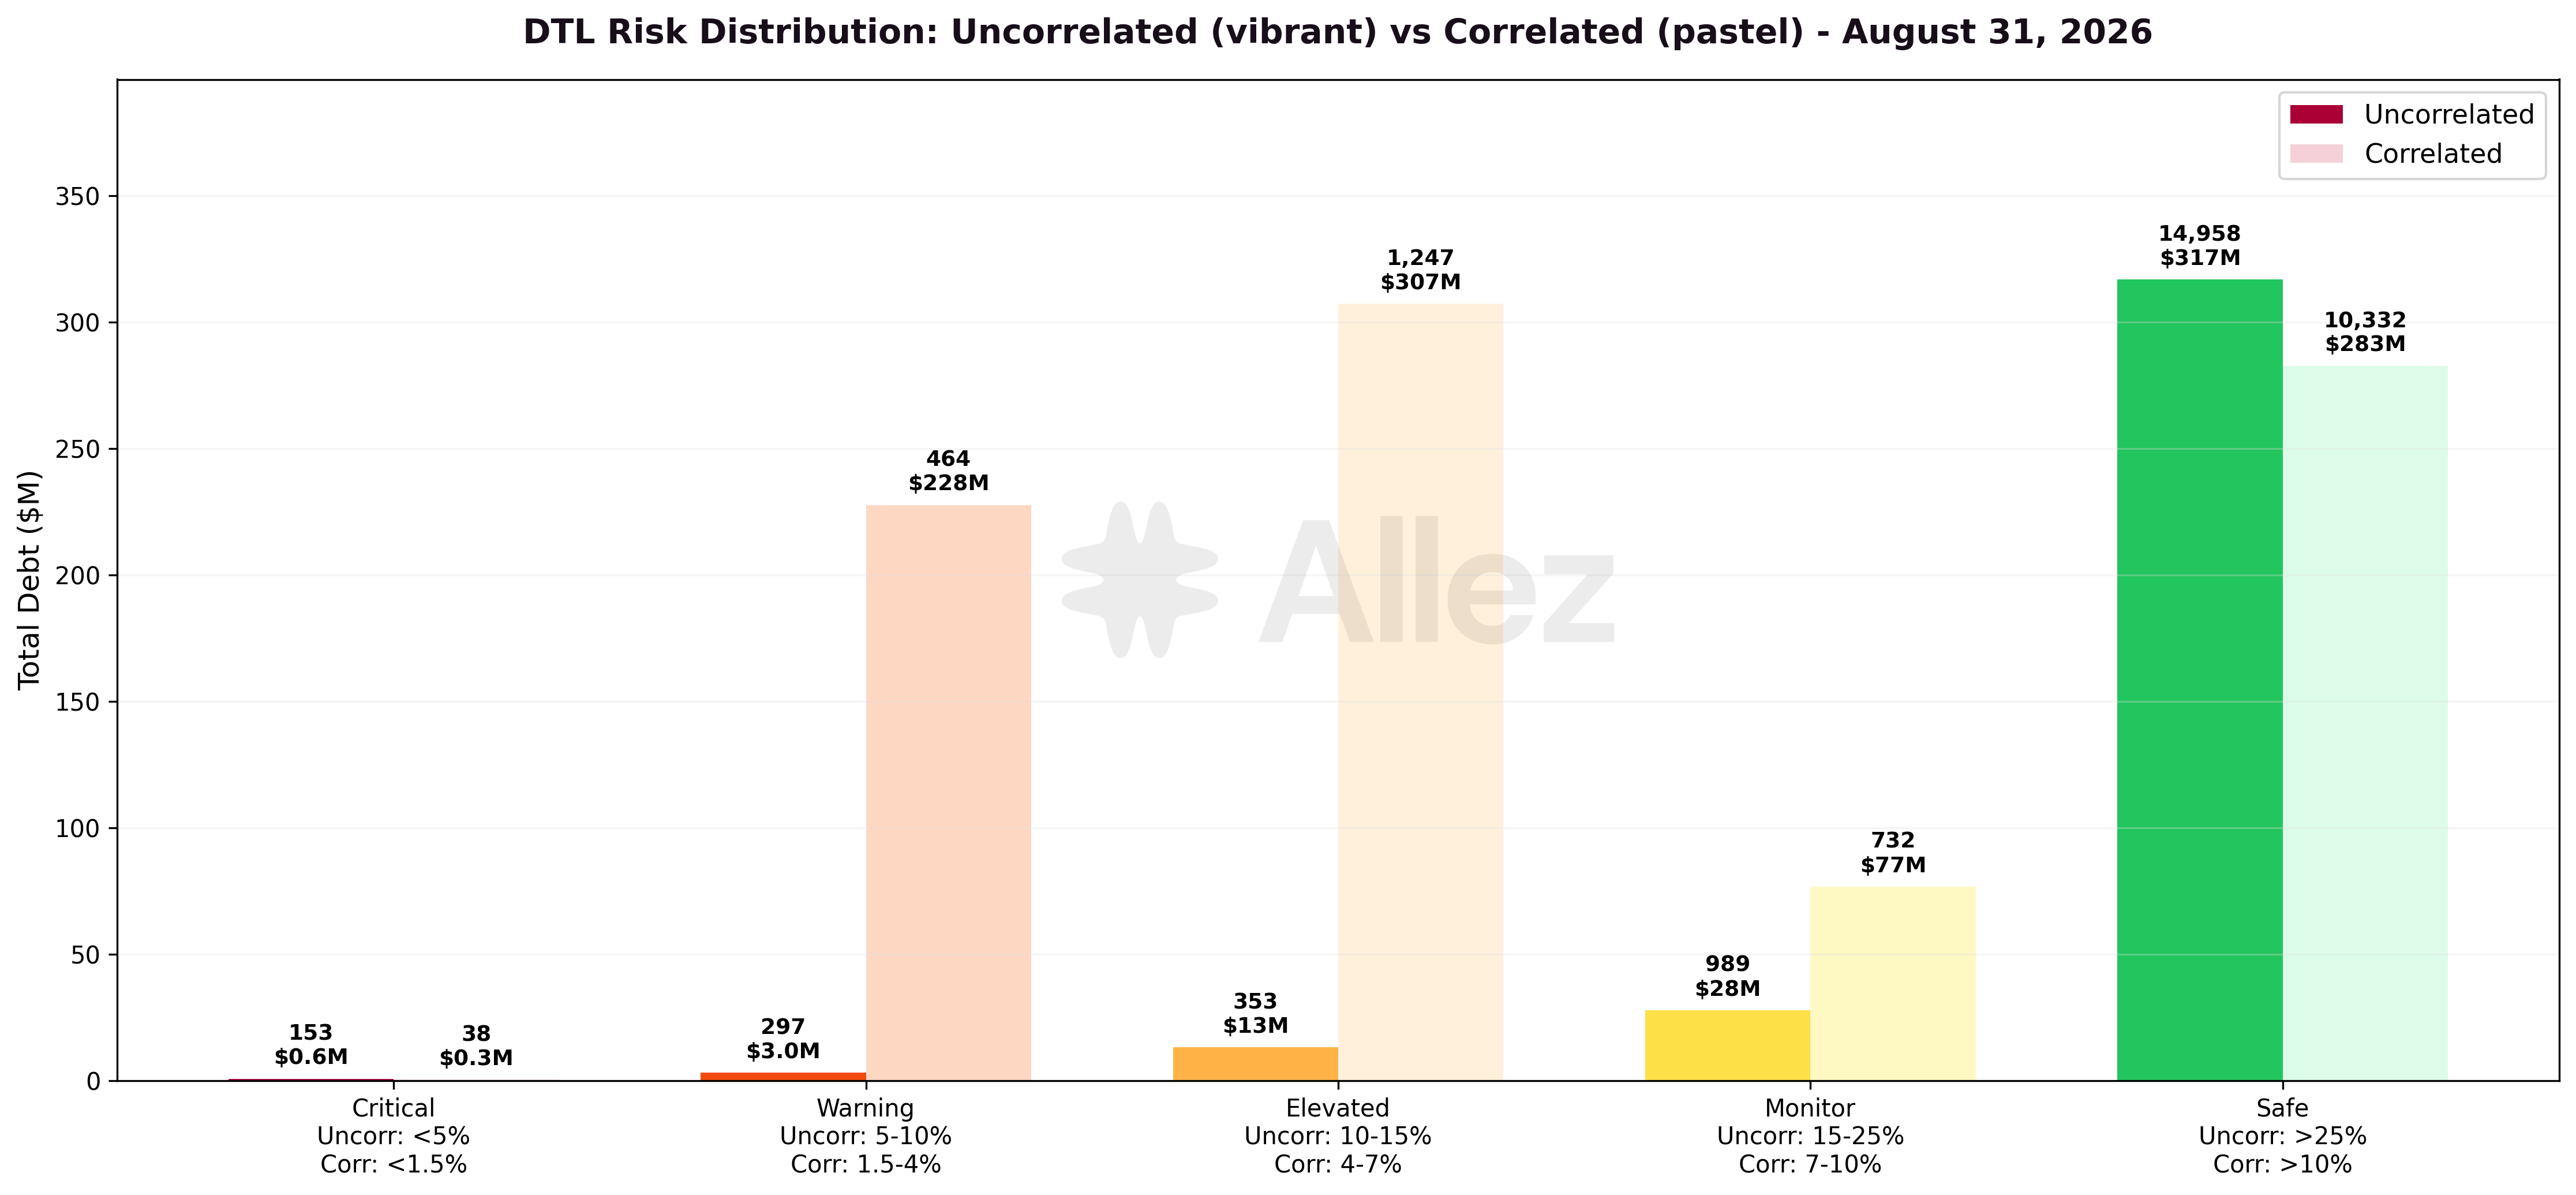
Positions are split into uncorrelated pairs, where collateral and debt move independently (SOL collateral against USDC debt), and correlated pairs where they move together (an LST against SOL, or a stablecoin against a stablecoin). Correlated pairs can safely run much closer to their liquidation threshold, so they are measured against a tighter set of tier bands. Values are measured per collateral-debt pair: a position with several collateral types appears in more than one row, so the tables partition exposure by pair rather than the protocol's $0.98B of debt and are not additive to it.
Uncorrelated positions (month-end):
| Tier | DTL range | Borrow value | July | MoM | Share | Positions |
|---|---|---|---|---|---|---|
| Critical | < 5% | $0.62M | $3.14M | -80.1% | 0.2% | 153 |
| Warning | 5-10% | $3.03M | $17.62M | -82.8% | 0.8% | 297 |
| Elevated | 10-15% | $13.10M | $16.92M | -22.6% | 3.6% | 353 |
| Monitor | 15-25% | $27.77M | $113.03M | -75.4% | 7.7% | 989 |
| Safe | > 25% | $316.83M | $184.66M | +71.6% | 87.7% | 14,958 |
Correlated positions (month-end):
| Tier | DTL range | Borrow value | July | MoM | Share | Positions |
|---|---|---|---|---|---|---|
| Critical | < 1.5% | $0.28M | $0.26M | +7.5% | <0.1% | 38 |
| Warning | 1.5-4% | $227.61M | $223.47M | +1.8% | 25.4% | 464 |
| Elevated | 4-7% | $307.29M | $250.91M | +22.5% | 34.4% | 1,247 |
| Monitor | 7-10% | $76.64M | $87.19M | -12.1% | 8.6% | 732 |
| Safe | > 10% | $282.72M | $280.87M | +0.7% | 31.6% | 10,332 |
The uncorrelated book de-risked sharply as SOL rose. Value in the safest tier grew 71.6% to $316.83M, 87.7% of the book, while every closer-in tier shrank: Critical fell 80.1% to $0.62M, Warning 82.8% and Monitor 75.4%. SOL and BTC longs against stablecoin debt moved further from their liquidation price as their collateral appreciated. Only $0.62M of uncorrelated value now sits within 5% of liquidation, held by 153 positions, mostly small SOL and cbBTC positions against stablecoins.
The correlated book carries more value in its Warning and Elevated tiers, typical of tight-band markets where both legs move together. Its distribution moved one tier closer to liquidation: the Elevated share rose from 29.8% to 34.4% of the book and Monitor fell from 10.3% to 8.6%. Total correlated value grew $51.8M over the month, so this is a shift in shares rather than evidence that specific positions migrated between tiers. Because both legs track SOL, these positions are far less exposed to a price move than uncorrelated pairs, and Critical-tier correlated value is negligible at $0.28M.
MoM percentages throughout are computed on unrounded values, so recomputing them from the rounded figures shown can differ by a few tenths of a point.
Liquidation summary (August):
| Metric | August | July | MoM |
|---|---|---|---|
| Events | 616 | 610 | +1.0% |
| Collateral seized | $0.47M | $0.39M | +20.9% |
| Debt repaid | $0.46M | $0.38M | +21.0% |
| Average size | $760 | $636 | +19.5% |
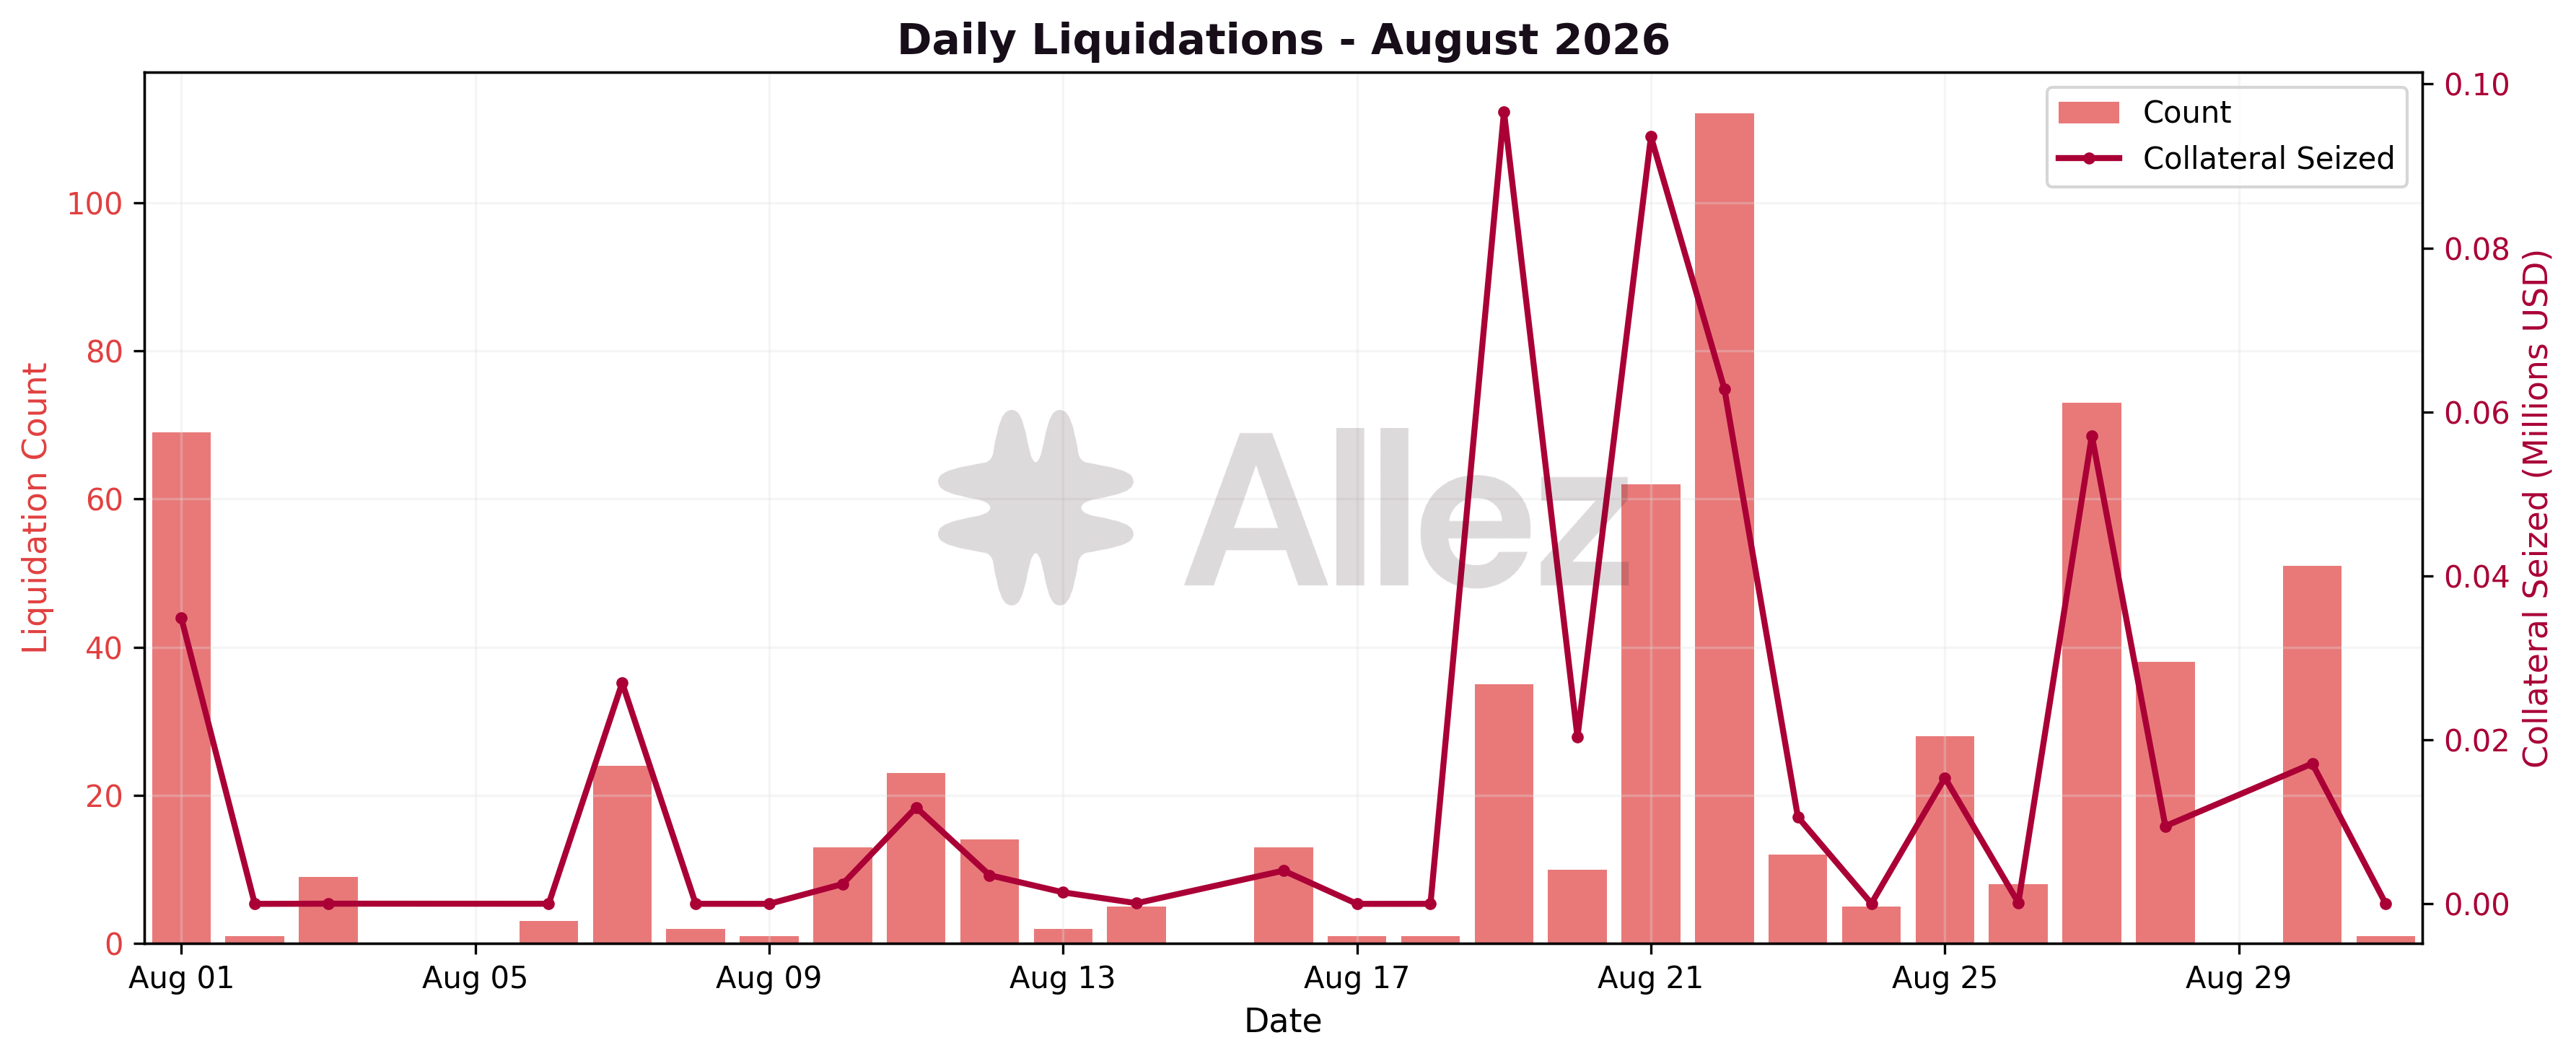
The month seized $0.47M of collateral across 616 events, level with July on count and 21% higher by value. The activity landed on positions caught by the rally rather than by a drawdown. The largest pair was USDC collateral borrowing SOL ($174K across 96 events), followed by SOL collateral borrowing USDC ($92K), as the SOL move squeezed both SOL borrowers and thinly-buffered SOL longs. The rest was small BONK/USDC and cbBTC-paired positions, none individually material.
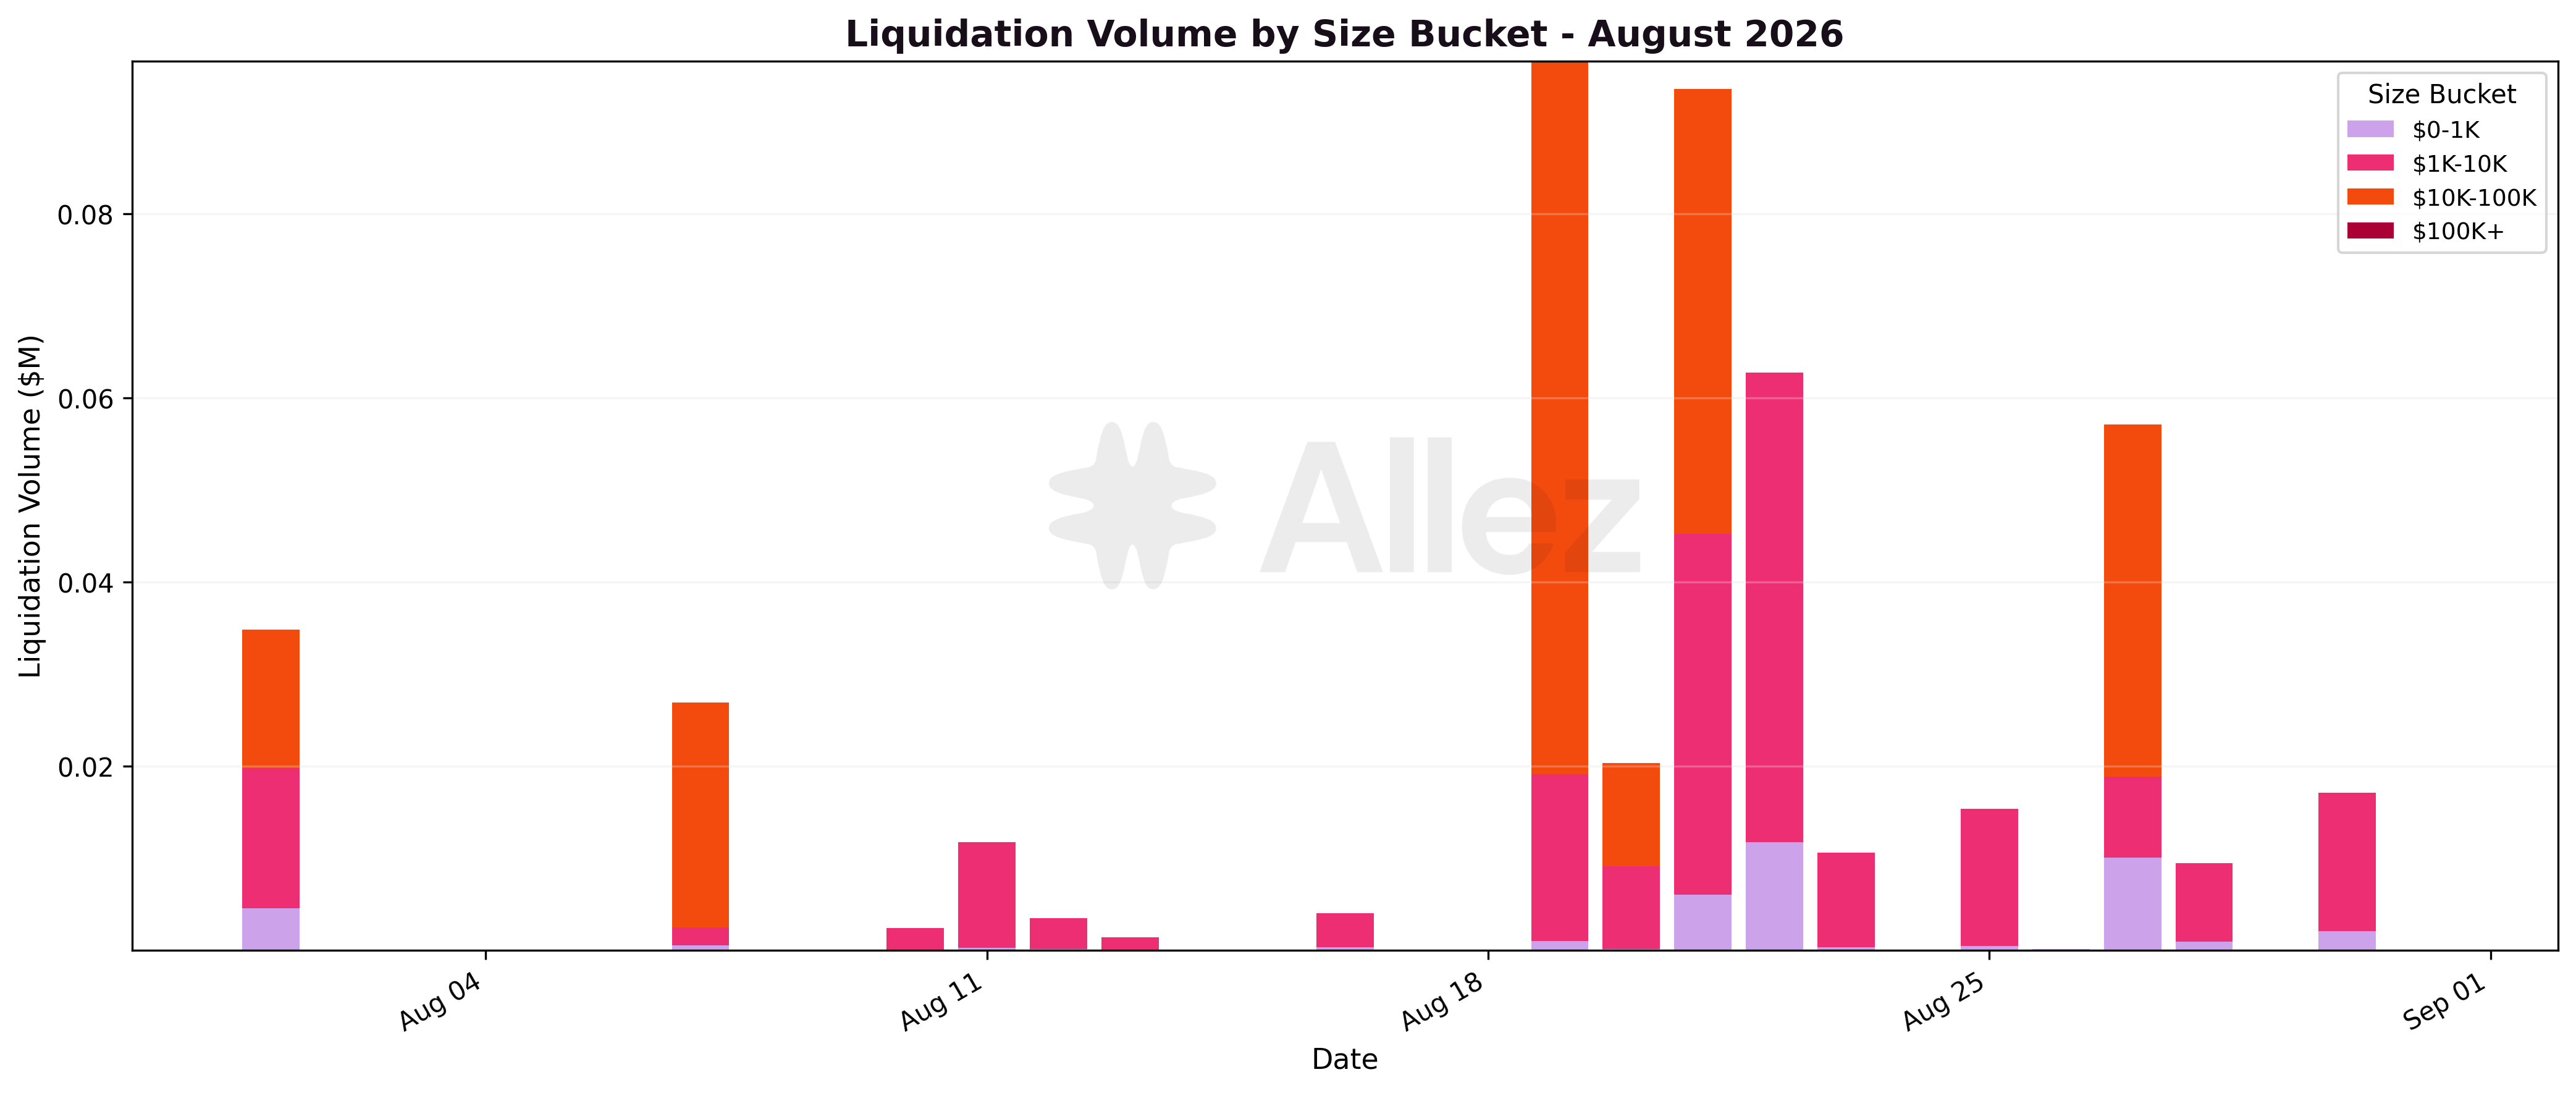
| Size bucket | Volume | Events |
|---|---|---|
| $0-1K | $38.9K | 552 |
| $1K-10K | $214.6K | 55 |
| $10K-100K | $214.8K | 9 |
The buckets sum to the month's $0.47M across 616 events, with the nine largest falling in the $10K-100K band.
Stress Testing:
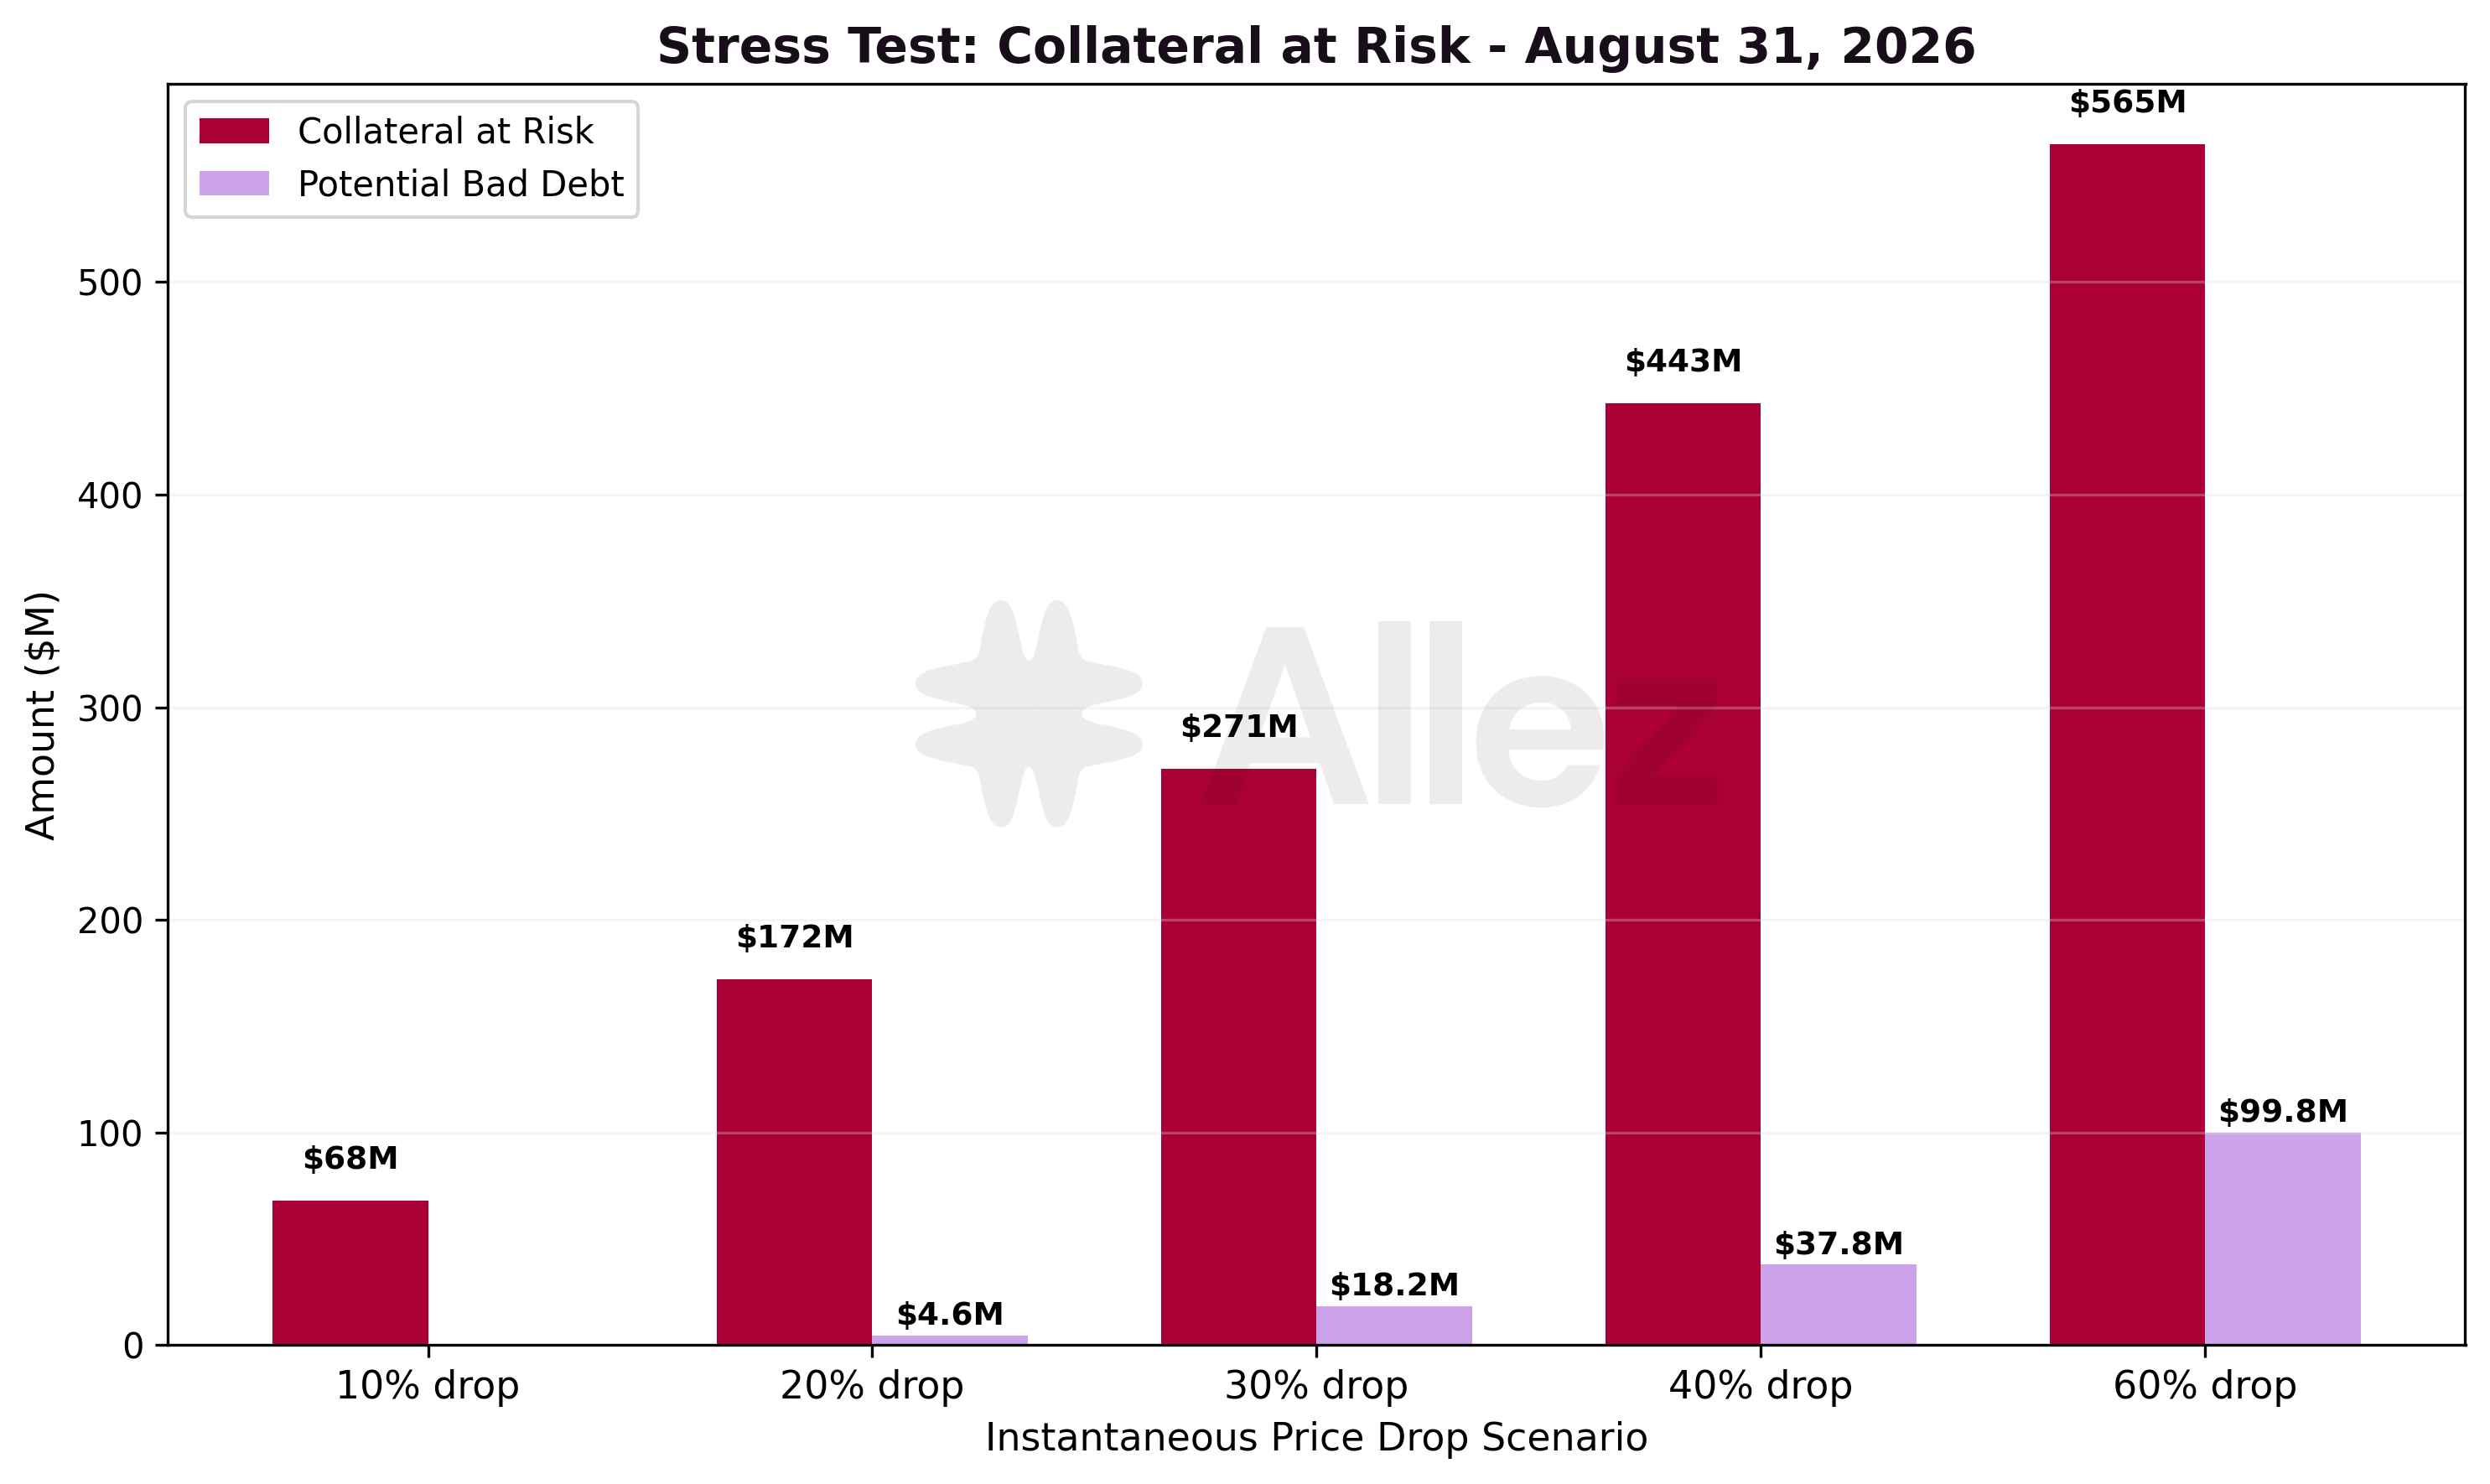
The stress test applies uniform price shocks to all collateral and measures cumulative collateral at risk and theoretical bad debt (per-obligation first-liquidation scenario, carried forward).
| Price shock | Collateral at risk | July | MoM | Potential bad debt | Positions liquidated |
|---|---|---|---|---|---|
| -10% | $68.0M | $95.3M | -28.6% | $0.0M | 363 |
| -20% | $172.0M | $193.4M | -11.1% | $4.6M | 1,034 |
| -30% | $271.2M | $449.9M | -39.7% | $18.2M | 3,316 |
| -40% | $442.8M | $534.4M | -17.1% | $37.8M | 5,044 |
| -60% | $565.0M | $563.8M | +0.2% | $99.8M | 10,512 |
Against July, collateral at risk fell at every shock except the deepest, with the largest declines in the shallow-to-mid range (-28.6% at -10%, -39.7% at -30%). The rally lifted positions away from the money, so fewer cross a threshold under a given shock. The -60% figure is flat because a 60% drop crosses the threshold for most collateralized positions regardless of starting buffer, liquidating 10,512. The shocks are instantaneous, uniform price moves and carry no probability weighting.
Liquidation Cascade and On-Chain Exit Depth (SOL)
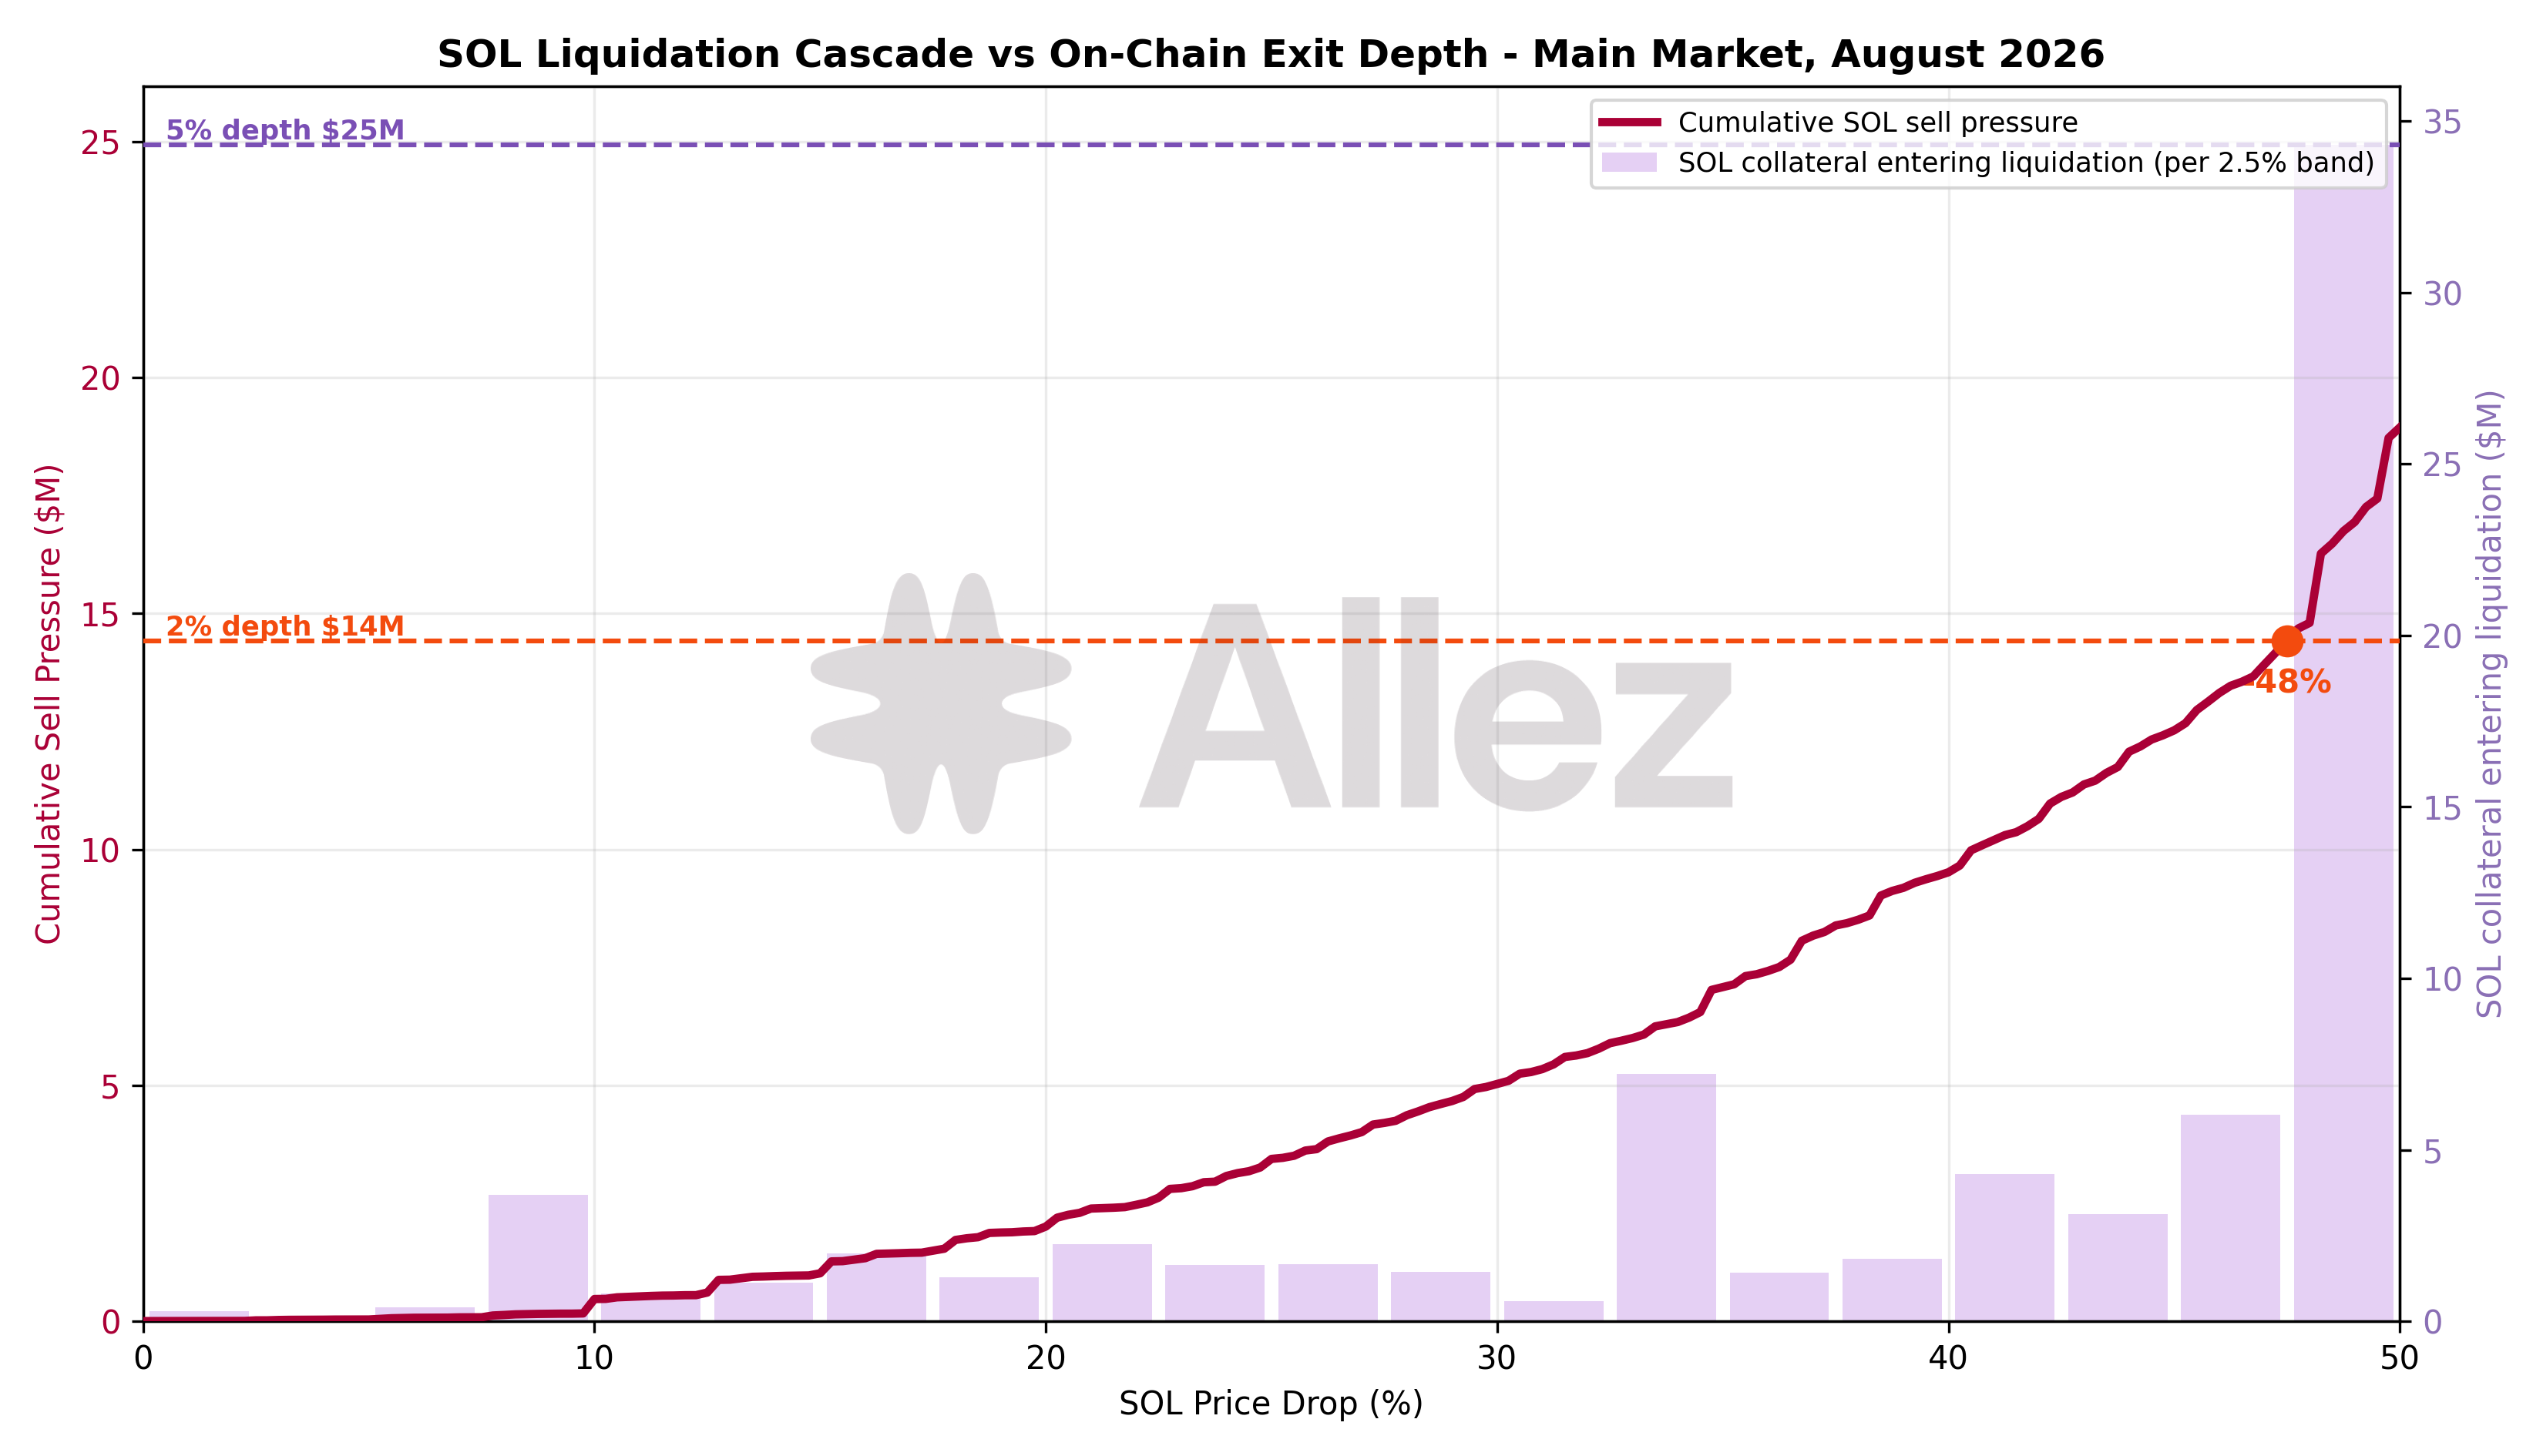
The stress test counts collateral that crosses a liquidation threshold but not how much of it reaches the market. The cascade model below estimates, for SOL, how much collateral liquidators would actually sell as the price falls, and compares that sell pressure against the depth available to exit SOL into dollars on-chain. SOL is the protocol's largest price-sensitive collateral.
The model steps the SOL price down in 0.25% increments and, at each level, liquidates each position in 10% close-factor waves until it returns below its liquidation threshold, carrying residual collateral and debt forward. Scope is the $190.4M of SOL collateral held by Main-market positions that carry debt, as Main holds nearly all of the protocol's SOL collateral; debt is allocated pro-rata to each position's SOL share, giving $64.3M of SOL-backed debt. The 10% wave matches the Main market's close factor and the 10.0% realized on SOL liquidations over the past year (n=101,389).
On exit depth, quoted at the month-end SOL price near $102: a 2% price impact absorbs $14.4M of SOL selling and a 5% impact absorbs $24.9M, with realizable output flattening near a $29.7M ceiling.
| SOL price drop | Cumulative SOL sell pressure | July | MoM | Price impact to clear | 2% depth coverage | 5% depth coverage |
|---|---|---|---|---|---|---|
| -10% | $0.47M | $0.9M | -48% | 0.11% | 30.5x | 52.8x |
| -20% | $2.1M | $3.0M | -30% | 0.34% | 7.0x | 12.2x |
| -30% | $5.0M | $8.9M | -44% | 0.56% | 2.9x | 5.0x |
| -40% | $9.5M | $21.2M | -55% | 1.11% | 1.5x | 2.6x |
| -50% | $18.9M | $38.6M | -51% | 2.47% | 0.8x | 1.3x |
Sell pressure fell across the whole curve as the rally moved SOL positions further from their thresholds. A 10% SOL drop generates $0.47M of sell pressure, clearing at 0.11% modeled price impact, and a 20% drop generates $2.1M at 0.34%; the 2% exit depth covers these 30x and 7x. At -30% the cascade reaches $5.0M, clears at 0.56% impact and is covered 2.9x by the 2% depth. Sell pressure crosses the 2% depth around a 45% drop.
Against July, sell pressure is lower at every level, roughly halved through the mid-range, because positions sit further from the money after the rally, and the 2% exit depth also rose, from $12.0M to $14.4M.
Two caveats bound the deep-scenario reading. The depth quoted is an atomic SOL-to-USDC exit at a single instant, while a real cascade unfolds over many blocks, during which arbitrage and fresh liquidity can refill the pools and liquidators can route into other stablecoin pairs. Realizable depth over a liquidation window could therefore be larger than any single-instant quote, though stressed conditions can also pull liquidity.
The model estimates 1.11% price impact to clear the cascade at a 40% SOL drop, within the 2% depth. On the modeled figures, on-chain liquidity absorbs the SOL sell pressure through the -40% range this month.
4. Per-Market Micro Analysis
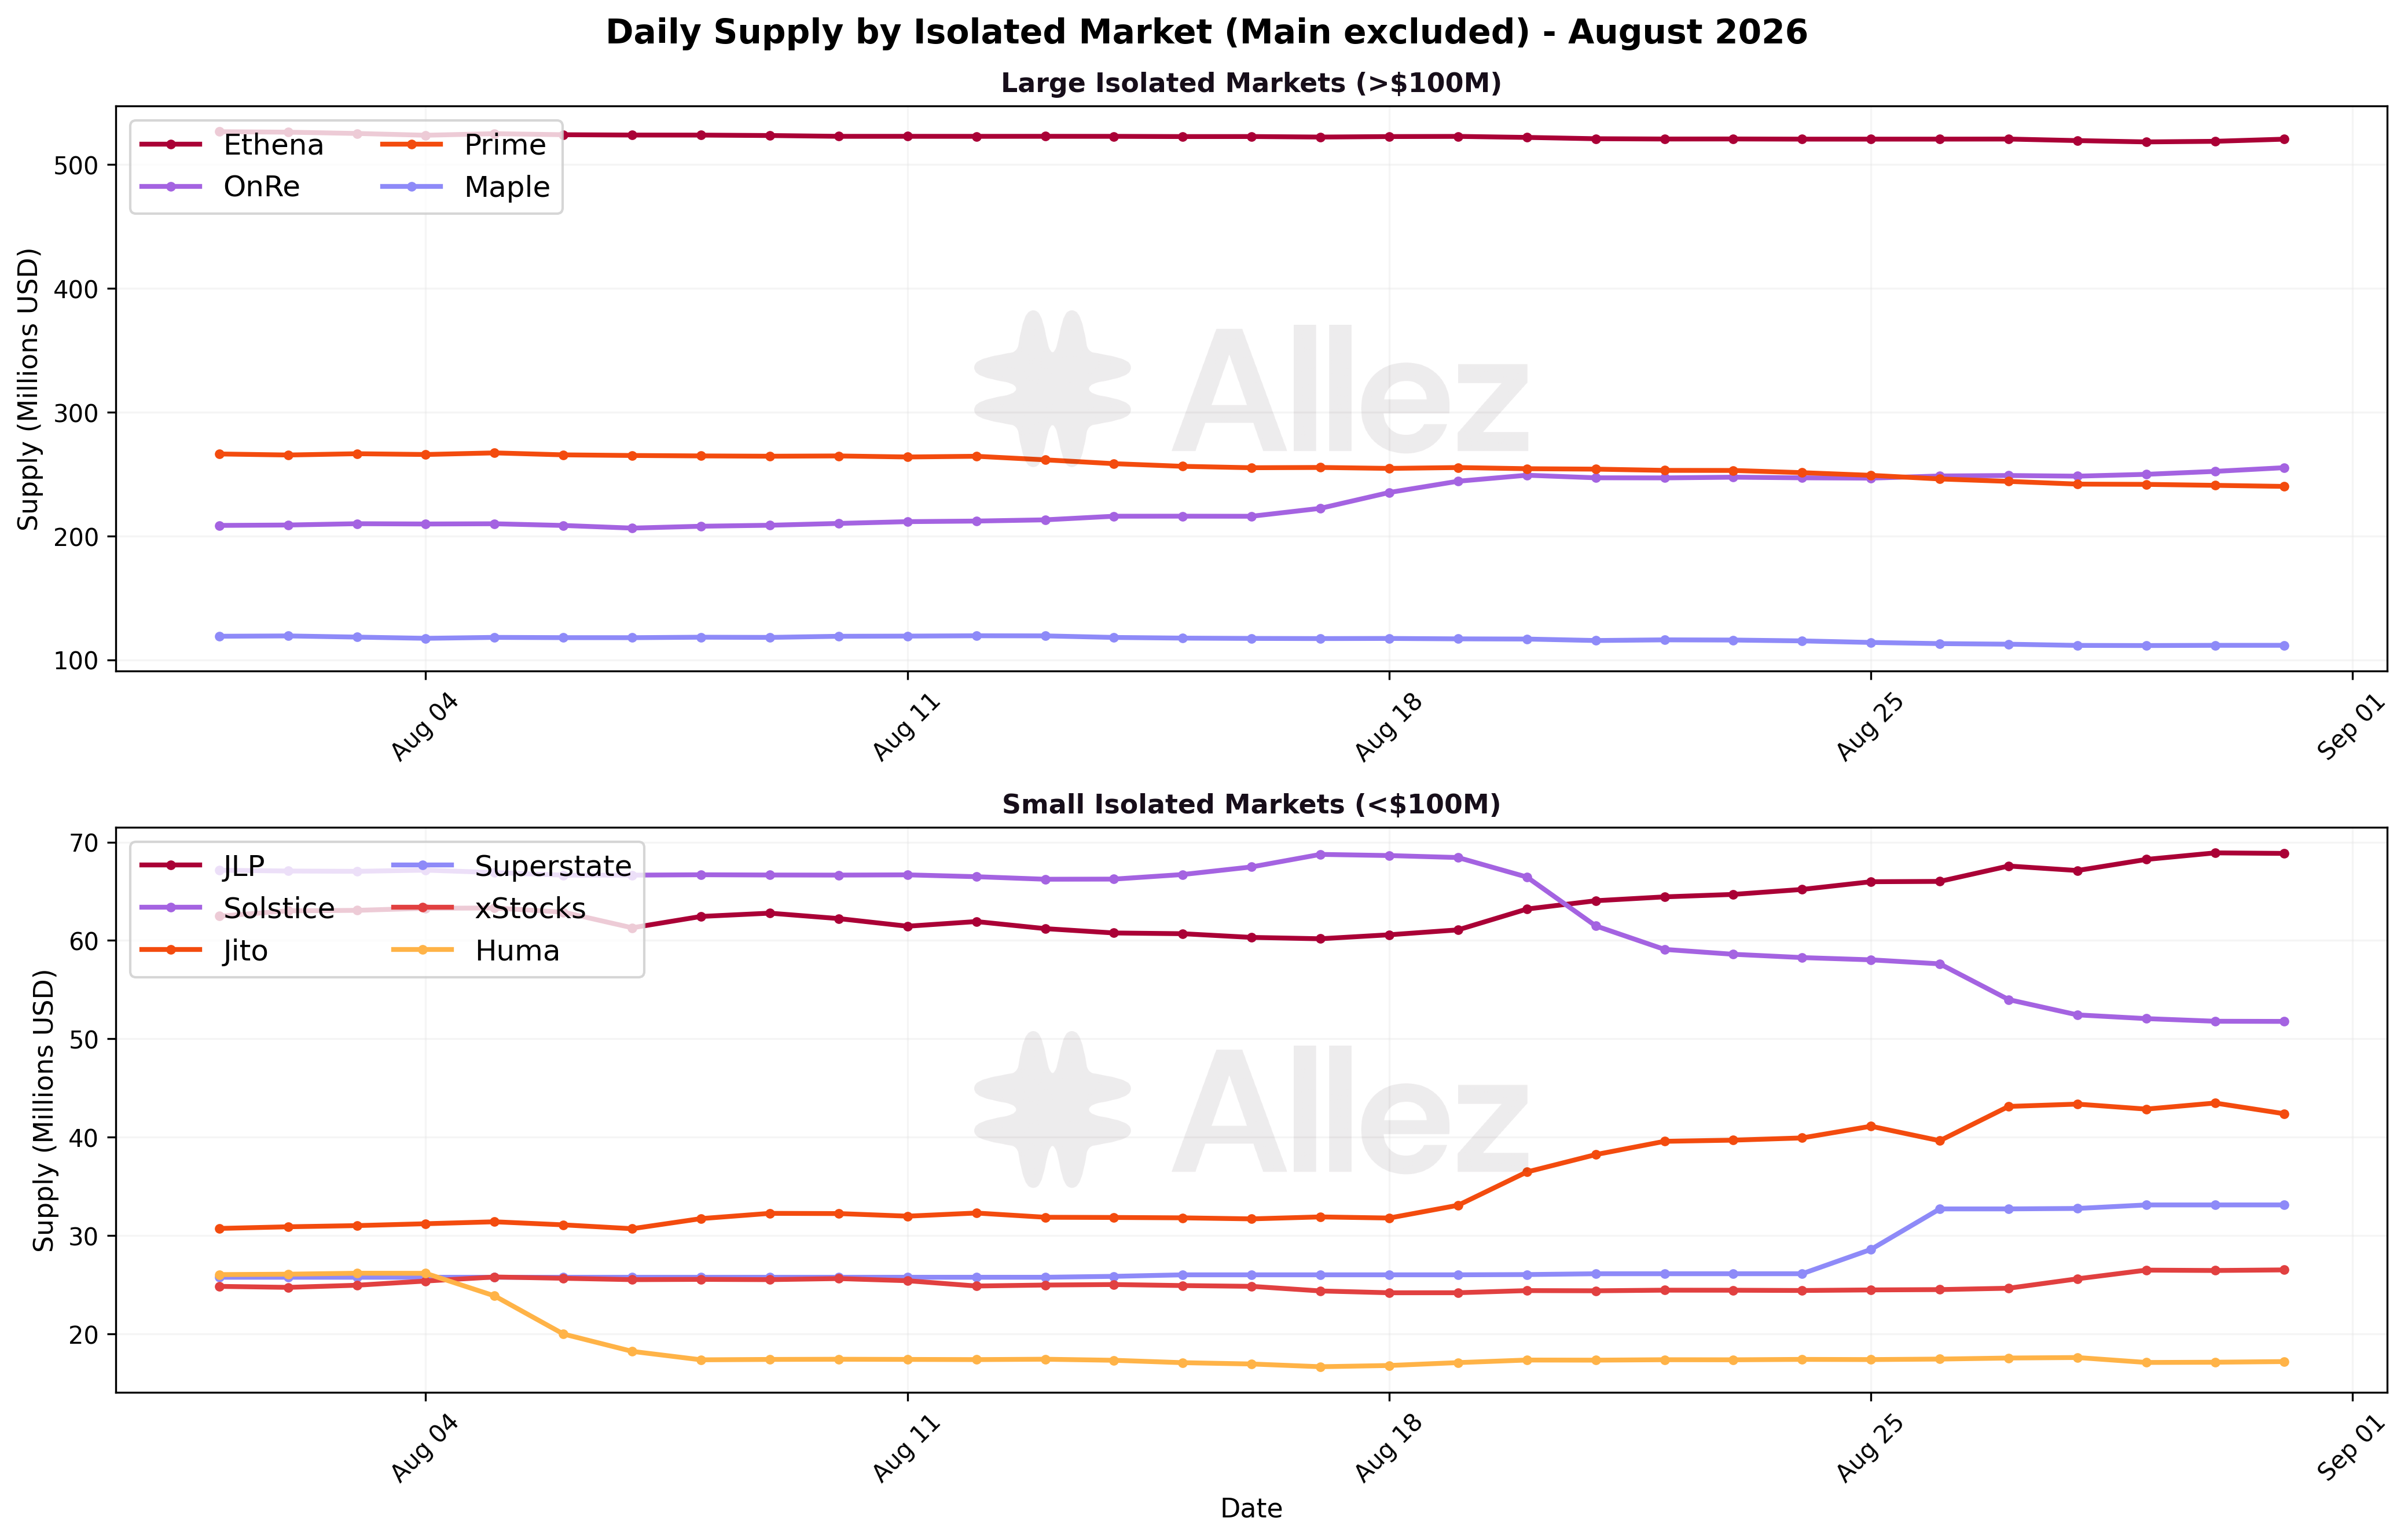
Growing markets: Jito (+37% to $42.4M), Superstate (+29% to $33.1M), Main (+28% to $1,082.0M), OnRe (+23% to $255.1M), SolBlaze (+19% to $14.9M), JLP (+9% to $68.9M).
Contracting markets: Huma (-34% to $17.2M), Solstice (-23% to $51.8M), Prime (-9% to $240.0M), Maple (-6% to $111.7M).
The Main market drove the protocol's growth, adding about $238M to $1,082.0M on the revaluation of its SOL and LST collateral. Jito and the other LST-heavy markets grew on the same rally. OnRe extended July's ramp, growing about 23% to $255.1M on $35.4M of net ONyc deposits, and crossed $250M to become the largest RWA market on Kamino (Kamino, August 31). The private-credit markets continued to ease, with Prime (-9%) and Maple (-6%) shedding a combined $30M, the outflow behind the PRIME token decline.
Market snapshot (month-end):
| Market | Supply | Supply MoM | Debt | Debt MoM | Util |
|---|---|---|---|---|---|
| Main | $1,082.0M | +28% | $416.9M | +21% | 39% |
| Ethena | $520.4M | -1% | $237.4M | 0% | 46% |
| OnRe | $255.1M | +23% | $84.1M | +18% | 33% |
| Prime | $240.0M | -9% | $103.3M | -9% | 43% |
| Maple | $111.7M | -6% | $46.1M | -5% | 41% |
| JLP | $68.9M | +9% | $21.9M | 0% | 32% |
| Solstice | $51.8M | -23% | $18.3M | -27% | 35% |
| Jito | $42.4M | +37% | $19.5M | +40% | 46% |
| Superstate | $33.1M | +29% | $8.0M | +12% | 24% |
| xStocks | $26.5M | +7% | $5.2M | +8% | 20% |
| reUSD* | $22.8M | new | $9.7M | new | 43% |
| Huma | $17.2M | -34% | $6.7M | -18% | 39% |
| SolBlaze | $14.9M | +19% | $6.8M | +51% | 46% |
Coverage of the market rollup. Protocol totals here cover the 29 named Kamino lending markets in our monthly dataset. Six further markets are live on Kamino's public market page but carry no market name in that dataset, so they currently fall outside every total, category and chart: reUSD ($22.8M supply / $9.7M debt), Obligate ($12.2M / $4.6M), Raiku ($6.7M / $2.7M), AUTO ($6.7M / $2.2M), PAXG ($1.6M / $0.4M) and STRCx ($1.0M / $0.2M), about $51.0M of supply and $19.7M of debt combined. The reUSD row above (marked *) is the same market, read separately.
Two additional markets, kiyCredit ($100.7M supply / $27.7M debt) and kpvCredit ($27.1M / $6.7M), carry real balances but are not shown on Kamino's public market page. Whether this institutional credit belongs in public protocol supply is still under review, so it is excluded here, alongside a handful of test and mispriced reserves.
Headline supply and debt are stated on the named-market basis and are not restated for this gap. Folding the six live markets in is in progress, and next month's report will state a single basis.
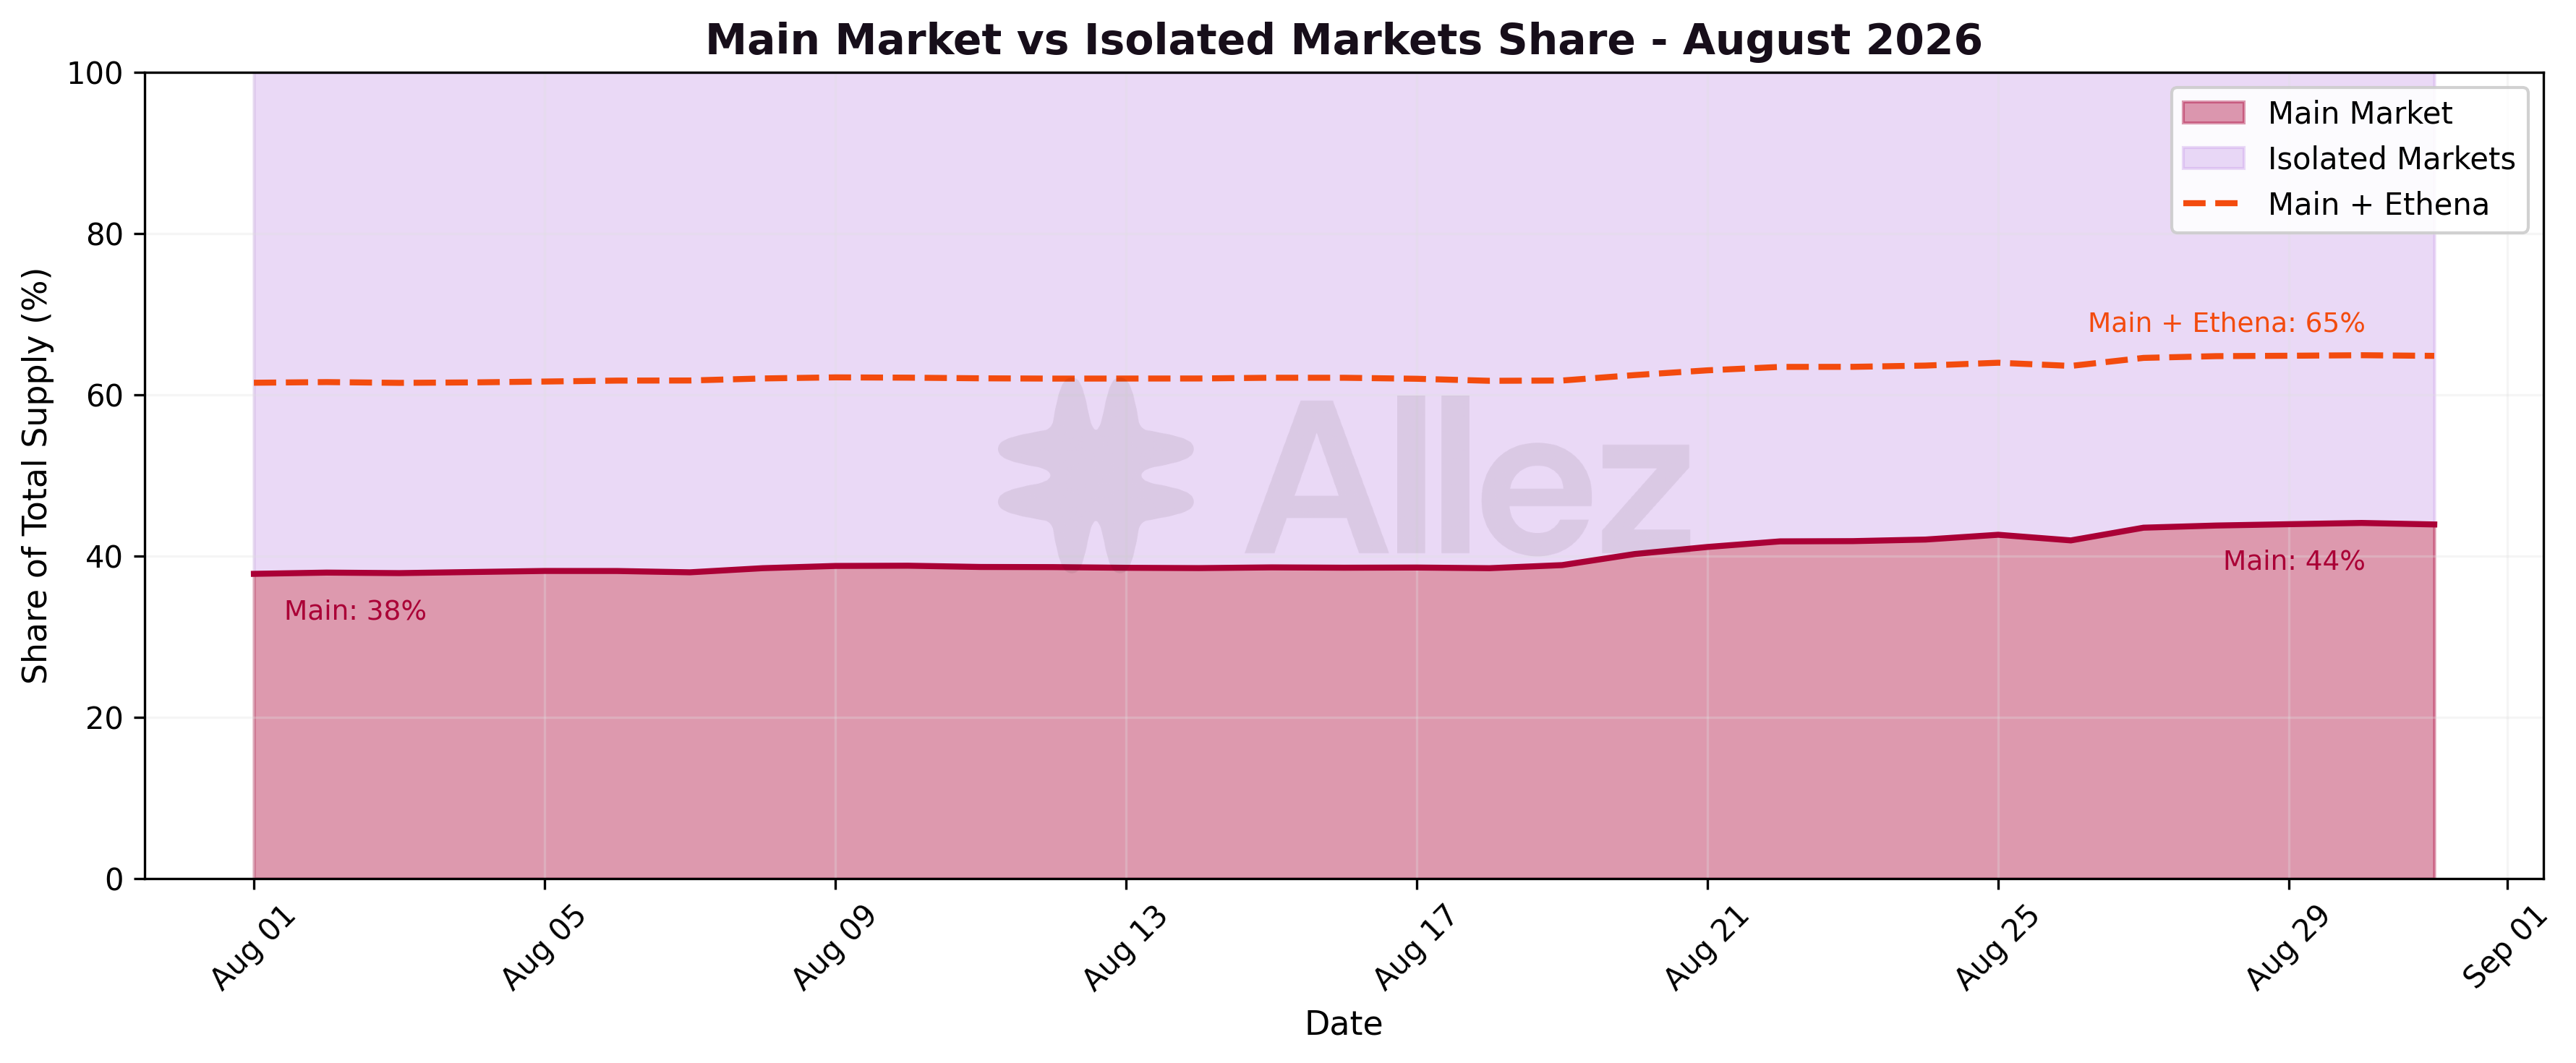
Main's share of protocol supply rose to 43.7% from 38.0% in July, as its SOL and LST collateral revalued on the rally. Ethena remained the second-largest market at $520.4M (21.0% of supply), down 1%, holding the PYUSD borrow leg it adopted in June and now carrying more than $250M of supplied USDe against a raised rewards rate. Main and Ethena together account for about 65% of protocol supply, with the remainder split across the RWA, credit and LST markets.
5. Kamino Lending Vaults
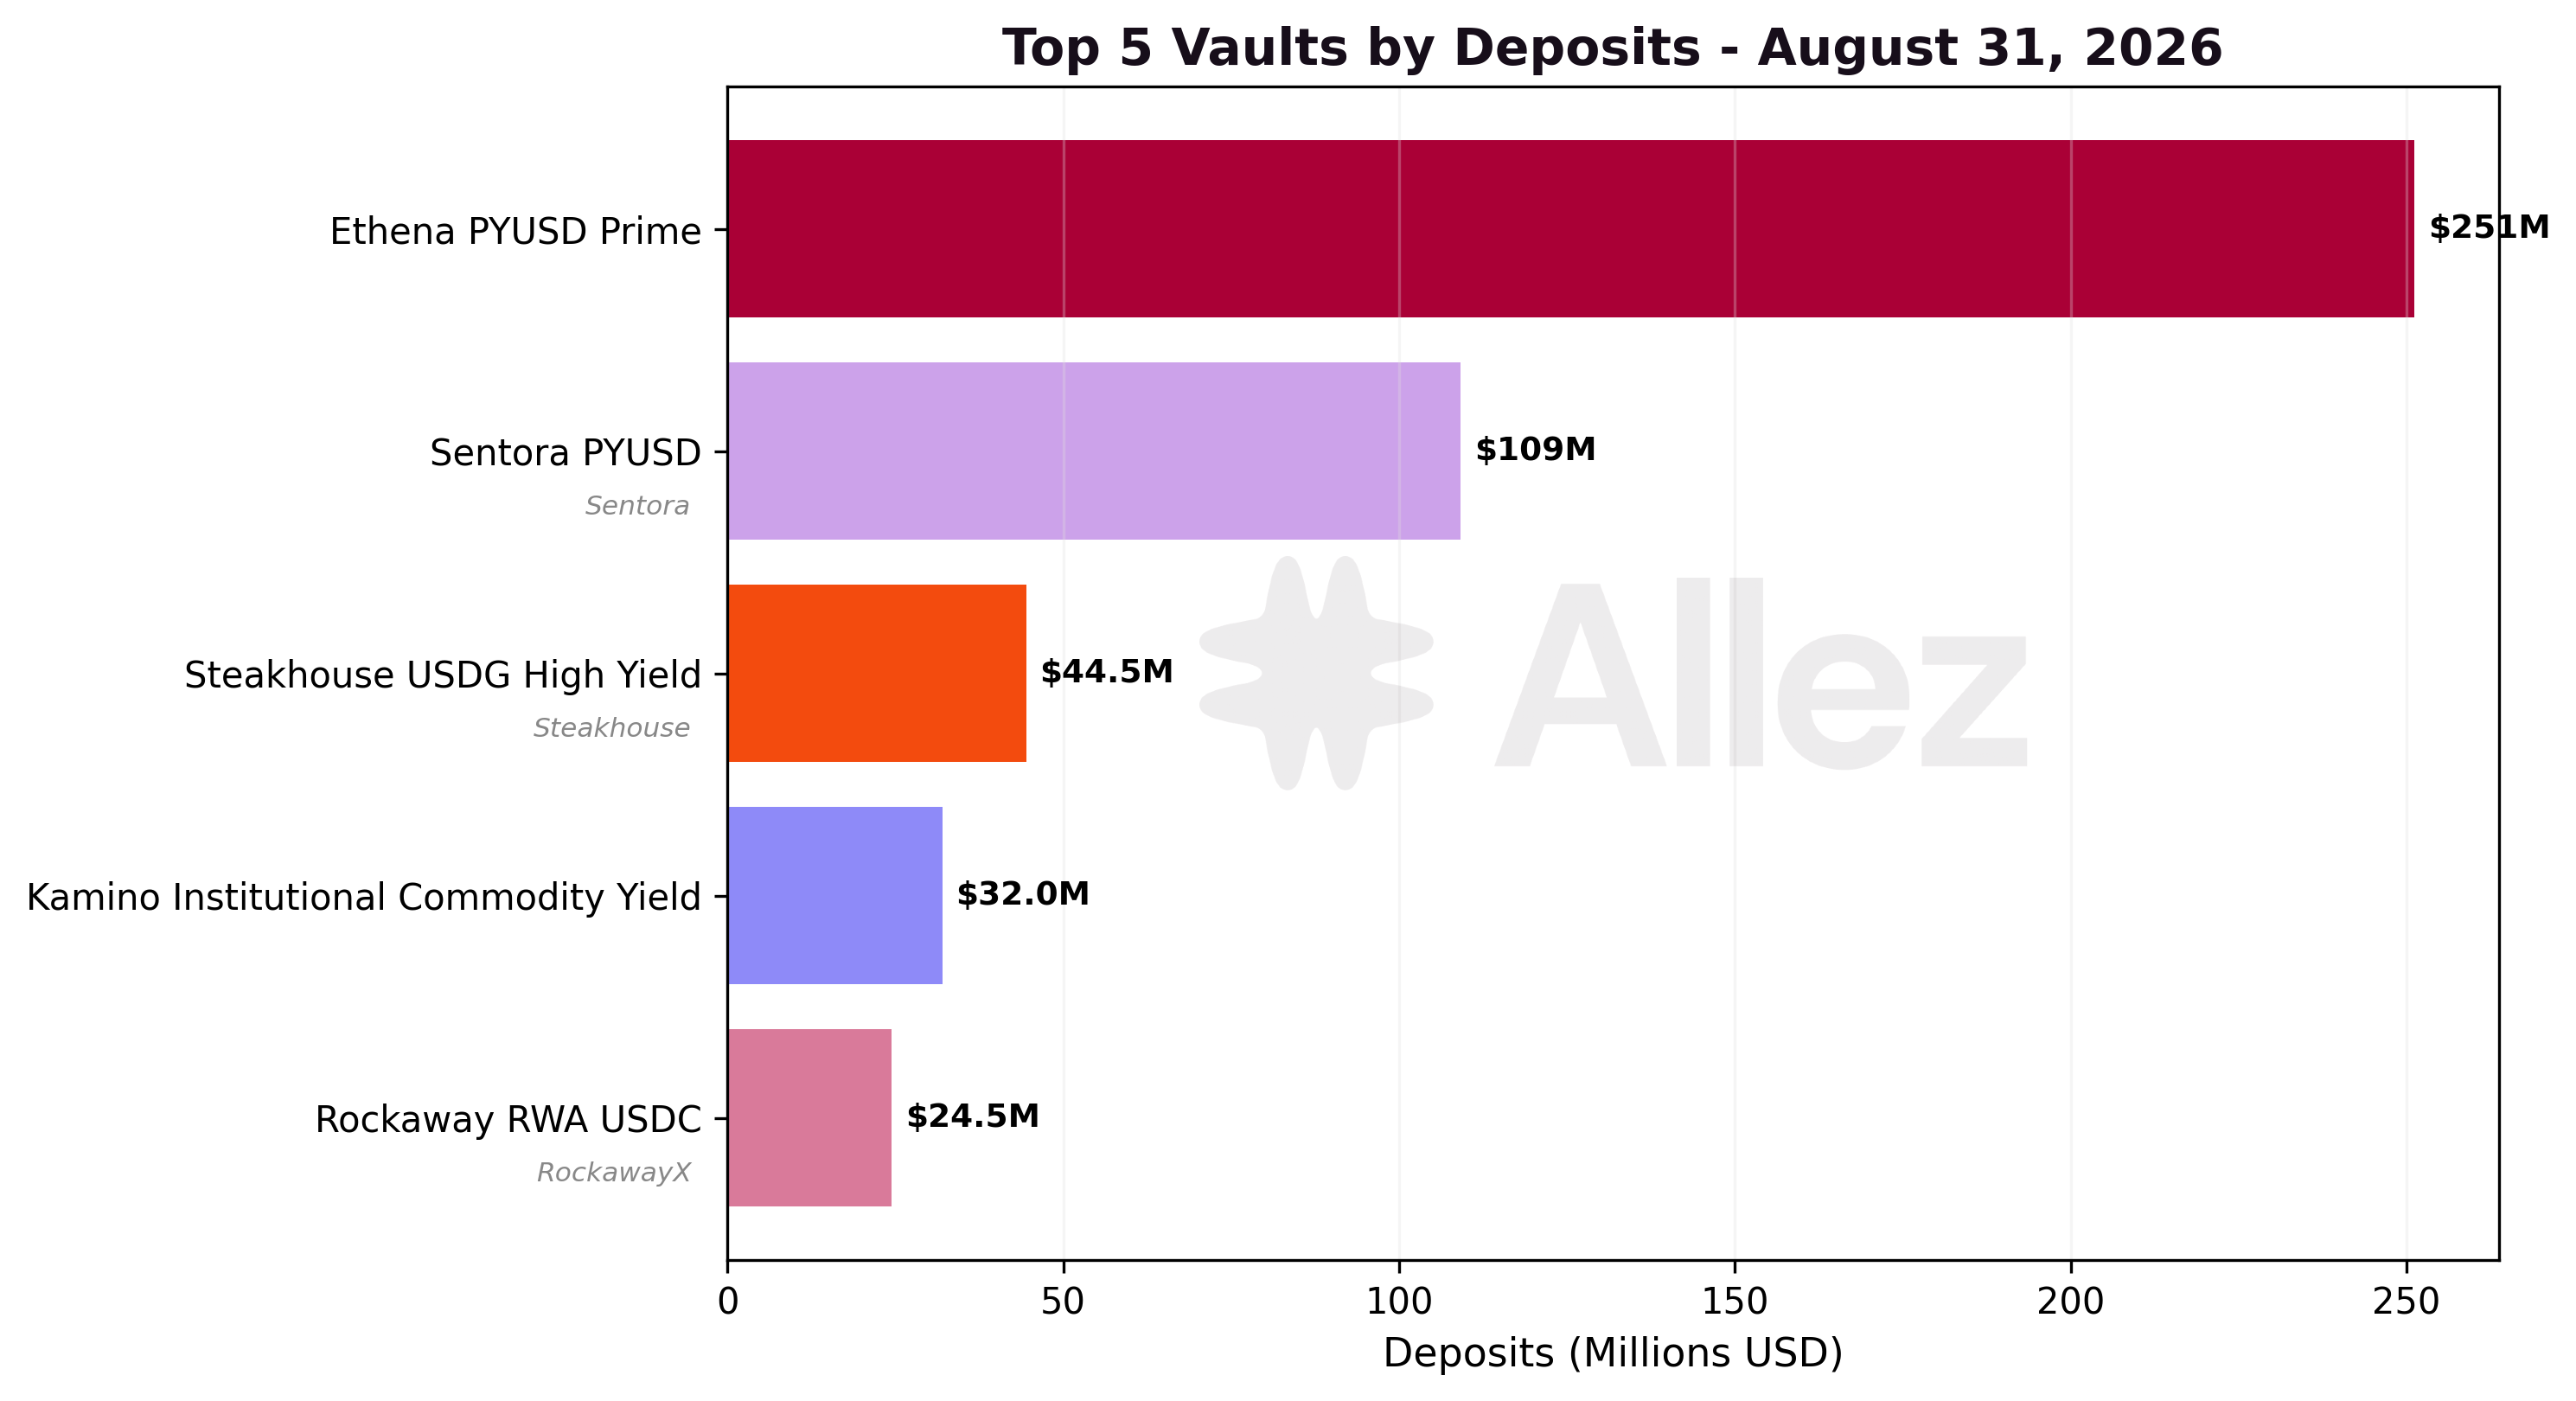
| Vault | Token | Deposits | MoM | Net APY |
|---|---|---|---|---|
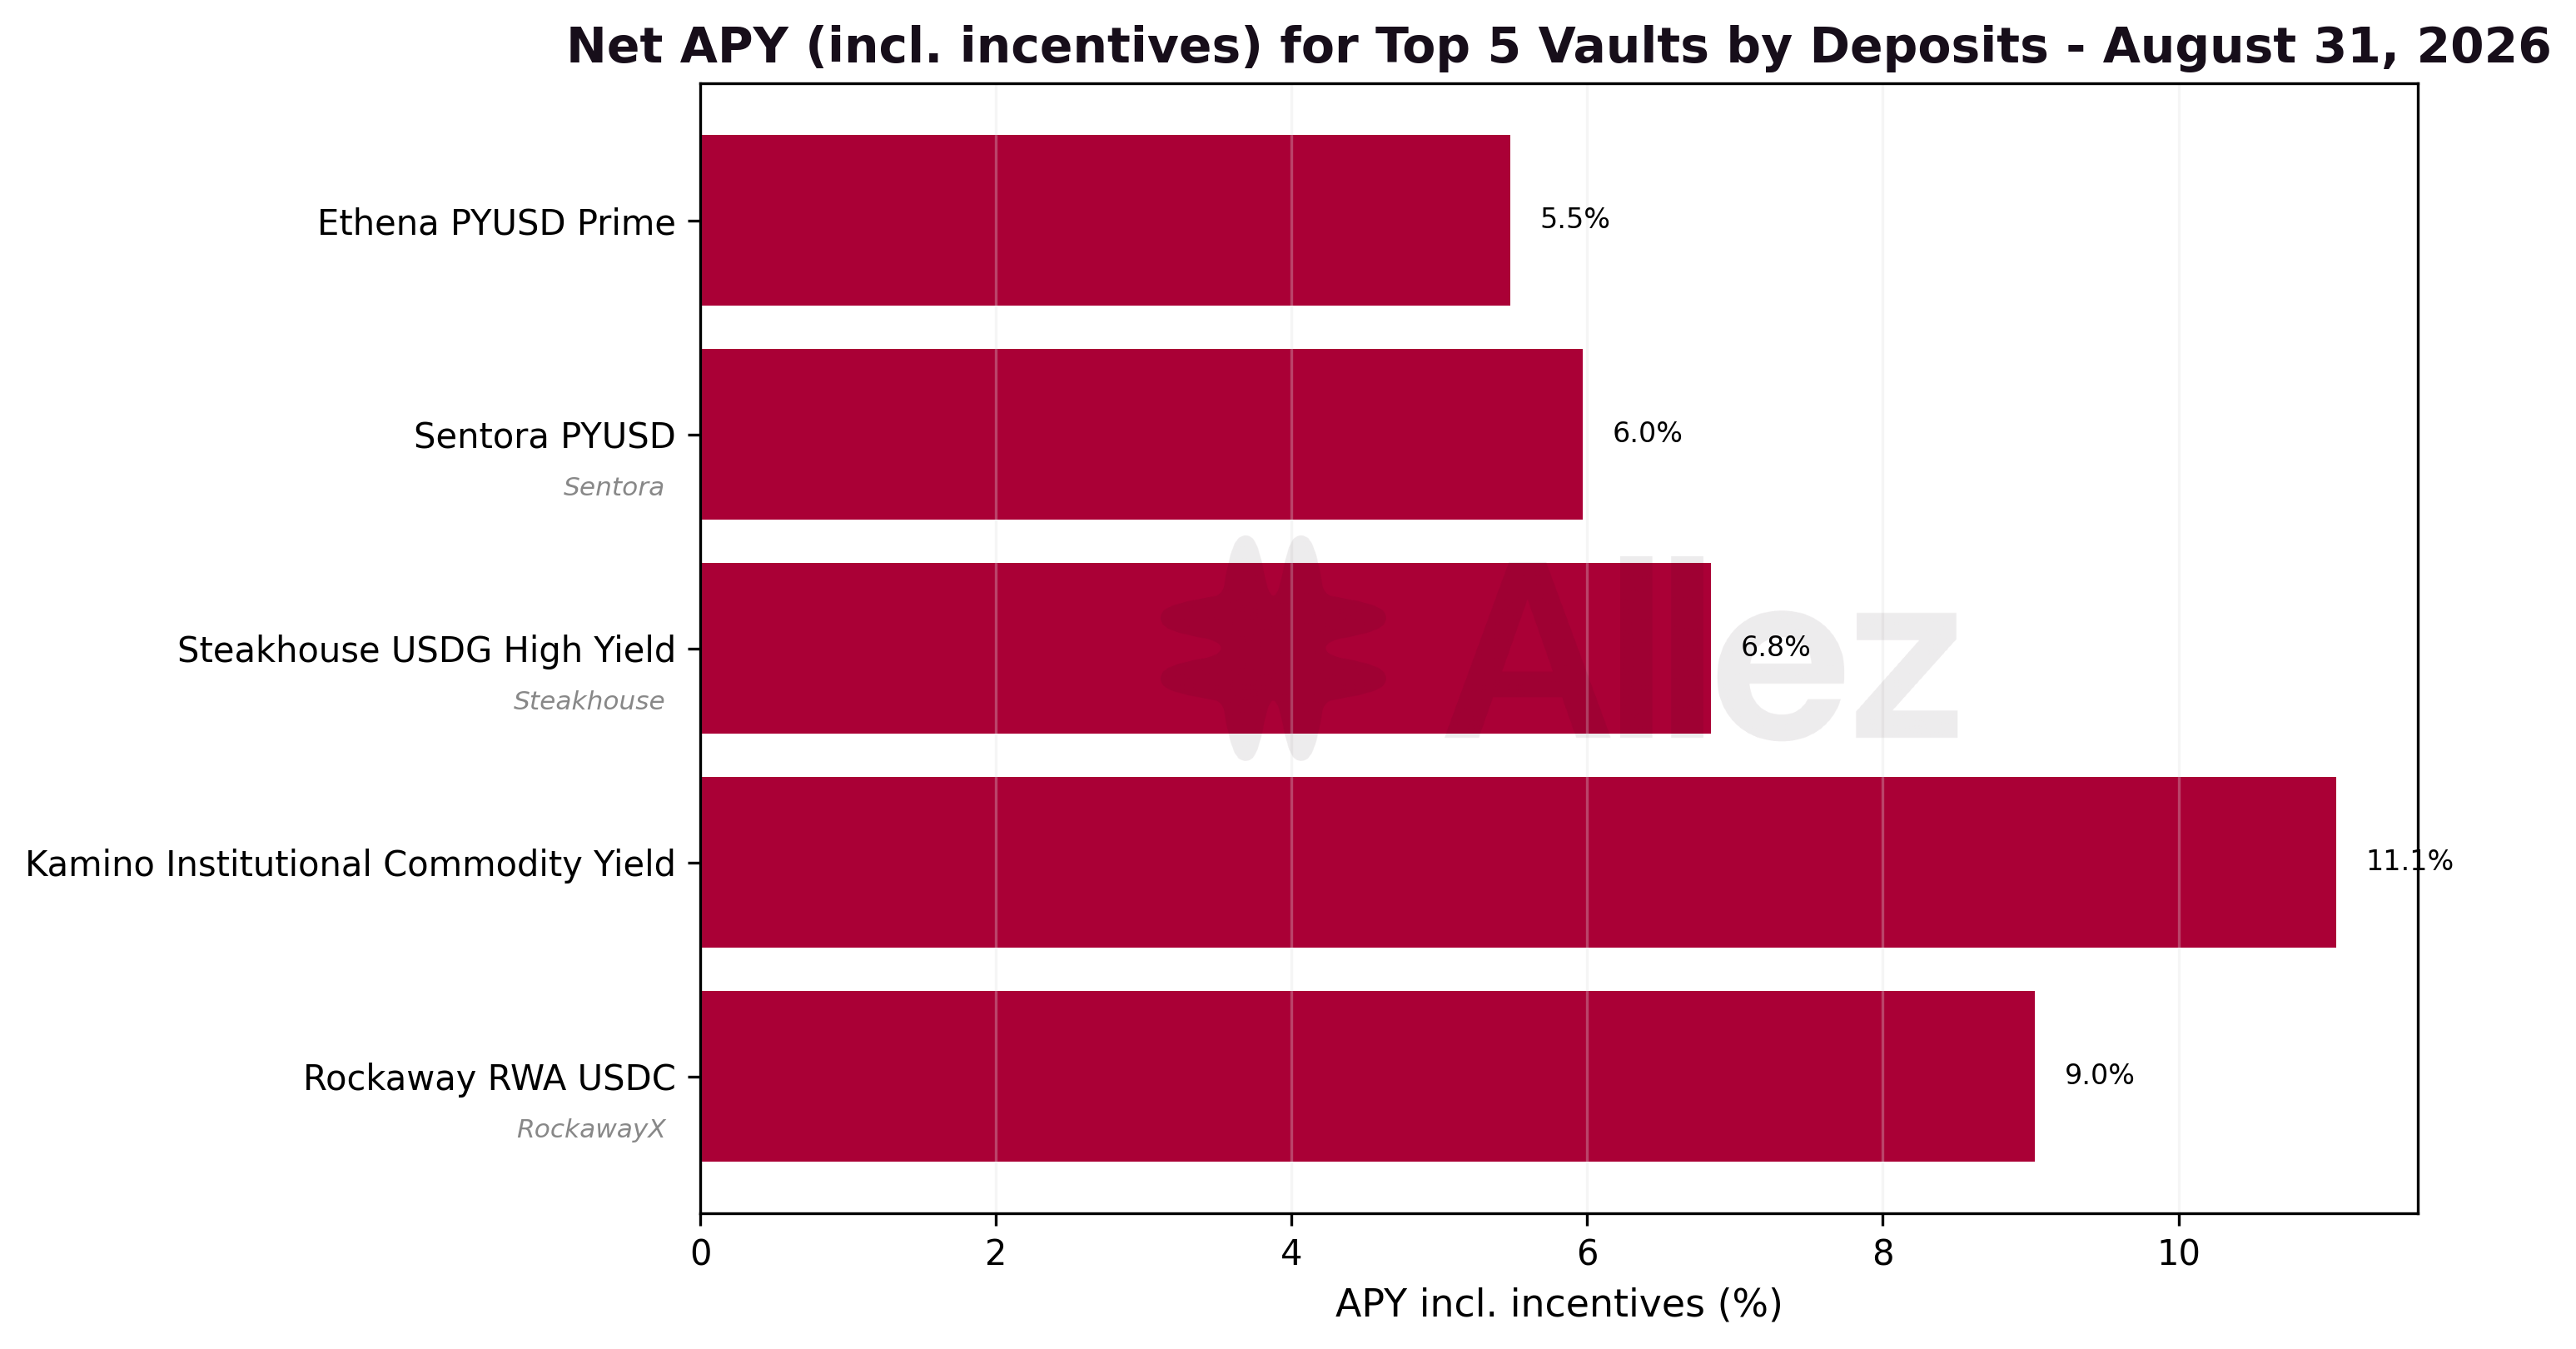
| Ethena PYUSD Prime | PYUSD | $251.2M | +0.2% | 5.48% |
| Sentora PYUSD | PYUSD | $109.2M | -5.1% | 5.97% |
| Steakhouse USDG High Yield | USDG | $44.5M | +31.2% | 6.84% |
| Kamino Institutional Commodity Yield | USDC | $32.0M | new | 11.07% |
| Rockaway RWA USDC | USDC | $24.5M | -11.5% | 9.03% |
| Steakhouse USDC | USDC | $18.7M | -7.1% | 5.59% |
| Allez USDC | USDC | $10.3M | -34.2% | 9.15% |
| Allez SOL | SOL | $7.9M | +22.2% | 8.53% |
| Kamino Private Credit USDC | USDC | $7.2M | -0.7% | 12.02% |
| Elemental USDC Optimizer | USDC | $5.6M | -0.4% | 10.18% |
Ethena PYUSD Prime, the largest vault, held $251.2M flat at a 5.48% net APY. The Ethena-market PYUSD reserve it lends into ran at 94.3% month-end utilization (up from 93.4%) with its month-end borrow APY at 6.36% (up from 3.15%), consistent with firmer borrow demand. This month-end reading is a different basis from the month-average borrow APR used in Section 6.
The month's new entrant, the Kamino Institutional Commodity Yield vault, reached $32.0M at an 11.07% yield after launching August 3. Steakhouse USDG High Yield extended its ramp to $44.5M (+31%), while the Allez USDC vault gave back deposits (-34%). Net APYs (median over the month-end day, including incentives) ran from about 5.5% on the large stablecoin vaults to 10-12% on the credit and optimizer vaults.
6. Transaction Volume
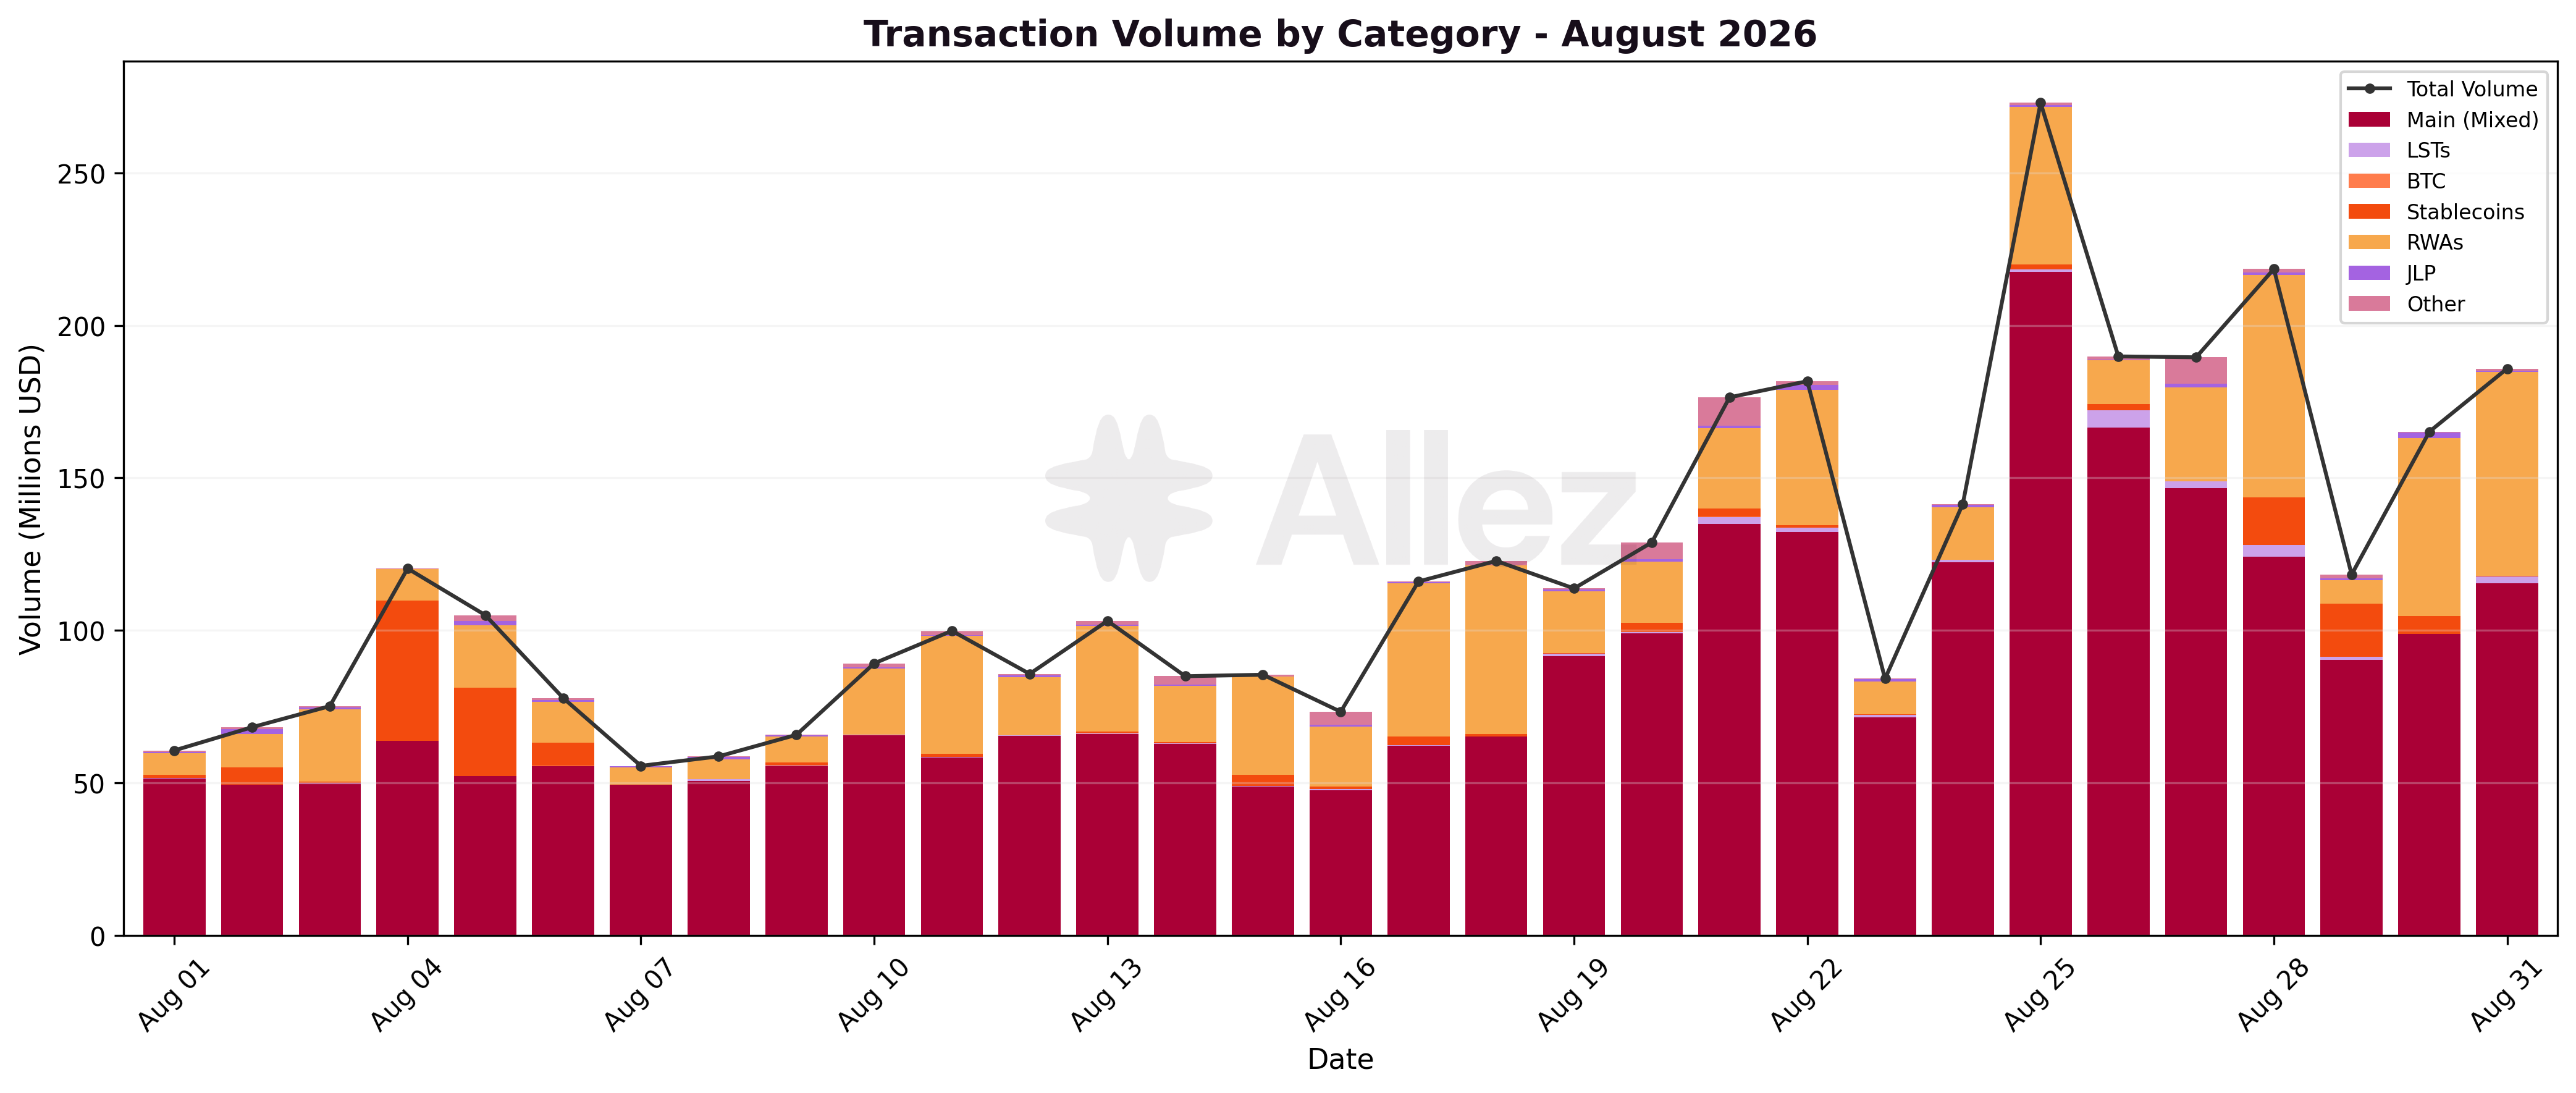
Total transaction volume was $3.71B, down 3.9% from July's $3.86B, with the pullback concentrated in large-ticket flows while mid-size activity rose.
Volume by type:
| Type | Volume | MoM |
|---|---|---|
| Deposit | $1.59B | +0.4% |
| Withdraw | $1.40B | -11.8% |
| Repay | $0.44B | +14.1% |
| Borrow | $0.29B | -5.3% |
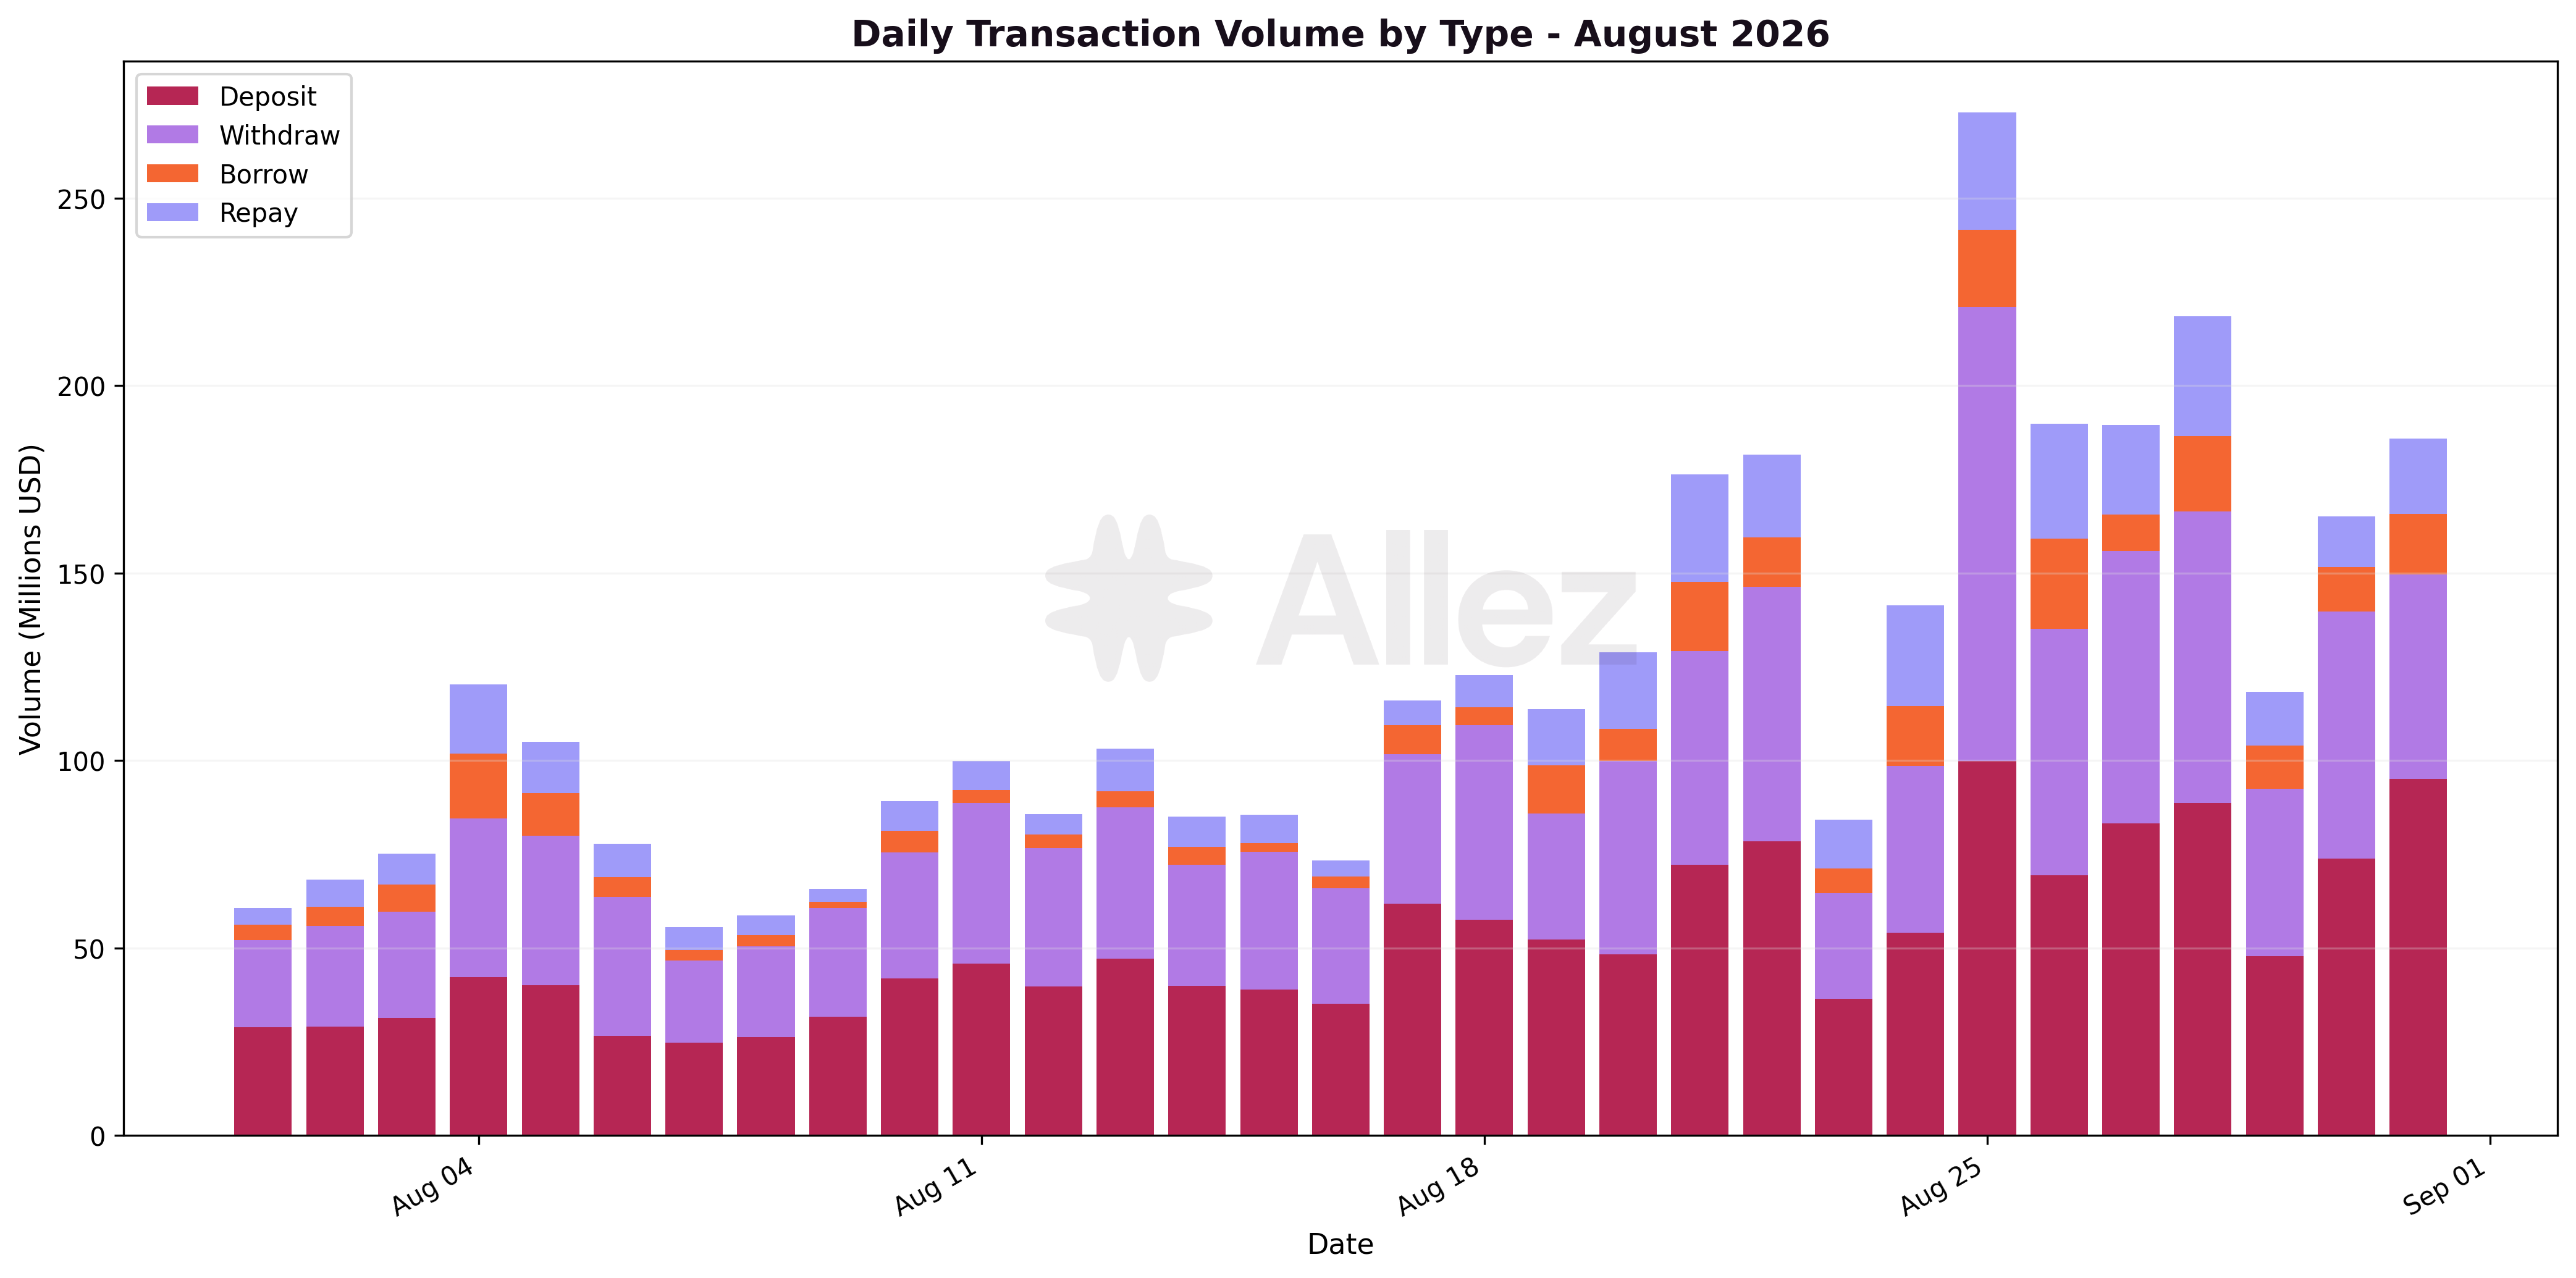
Deposits edged past withdrawals, a shift from July's balance. As noted in Section 1, this gross gap is not a net capital measure. Repay volume again exceeded borrow volume.
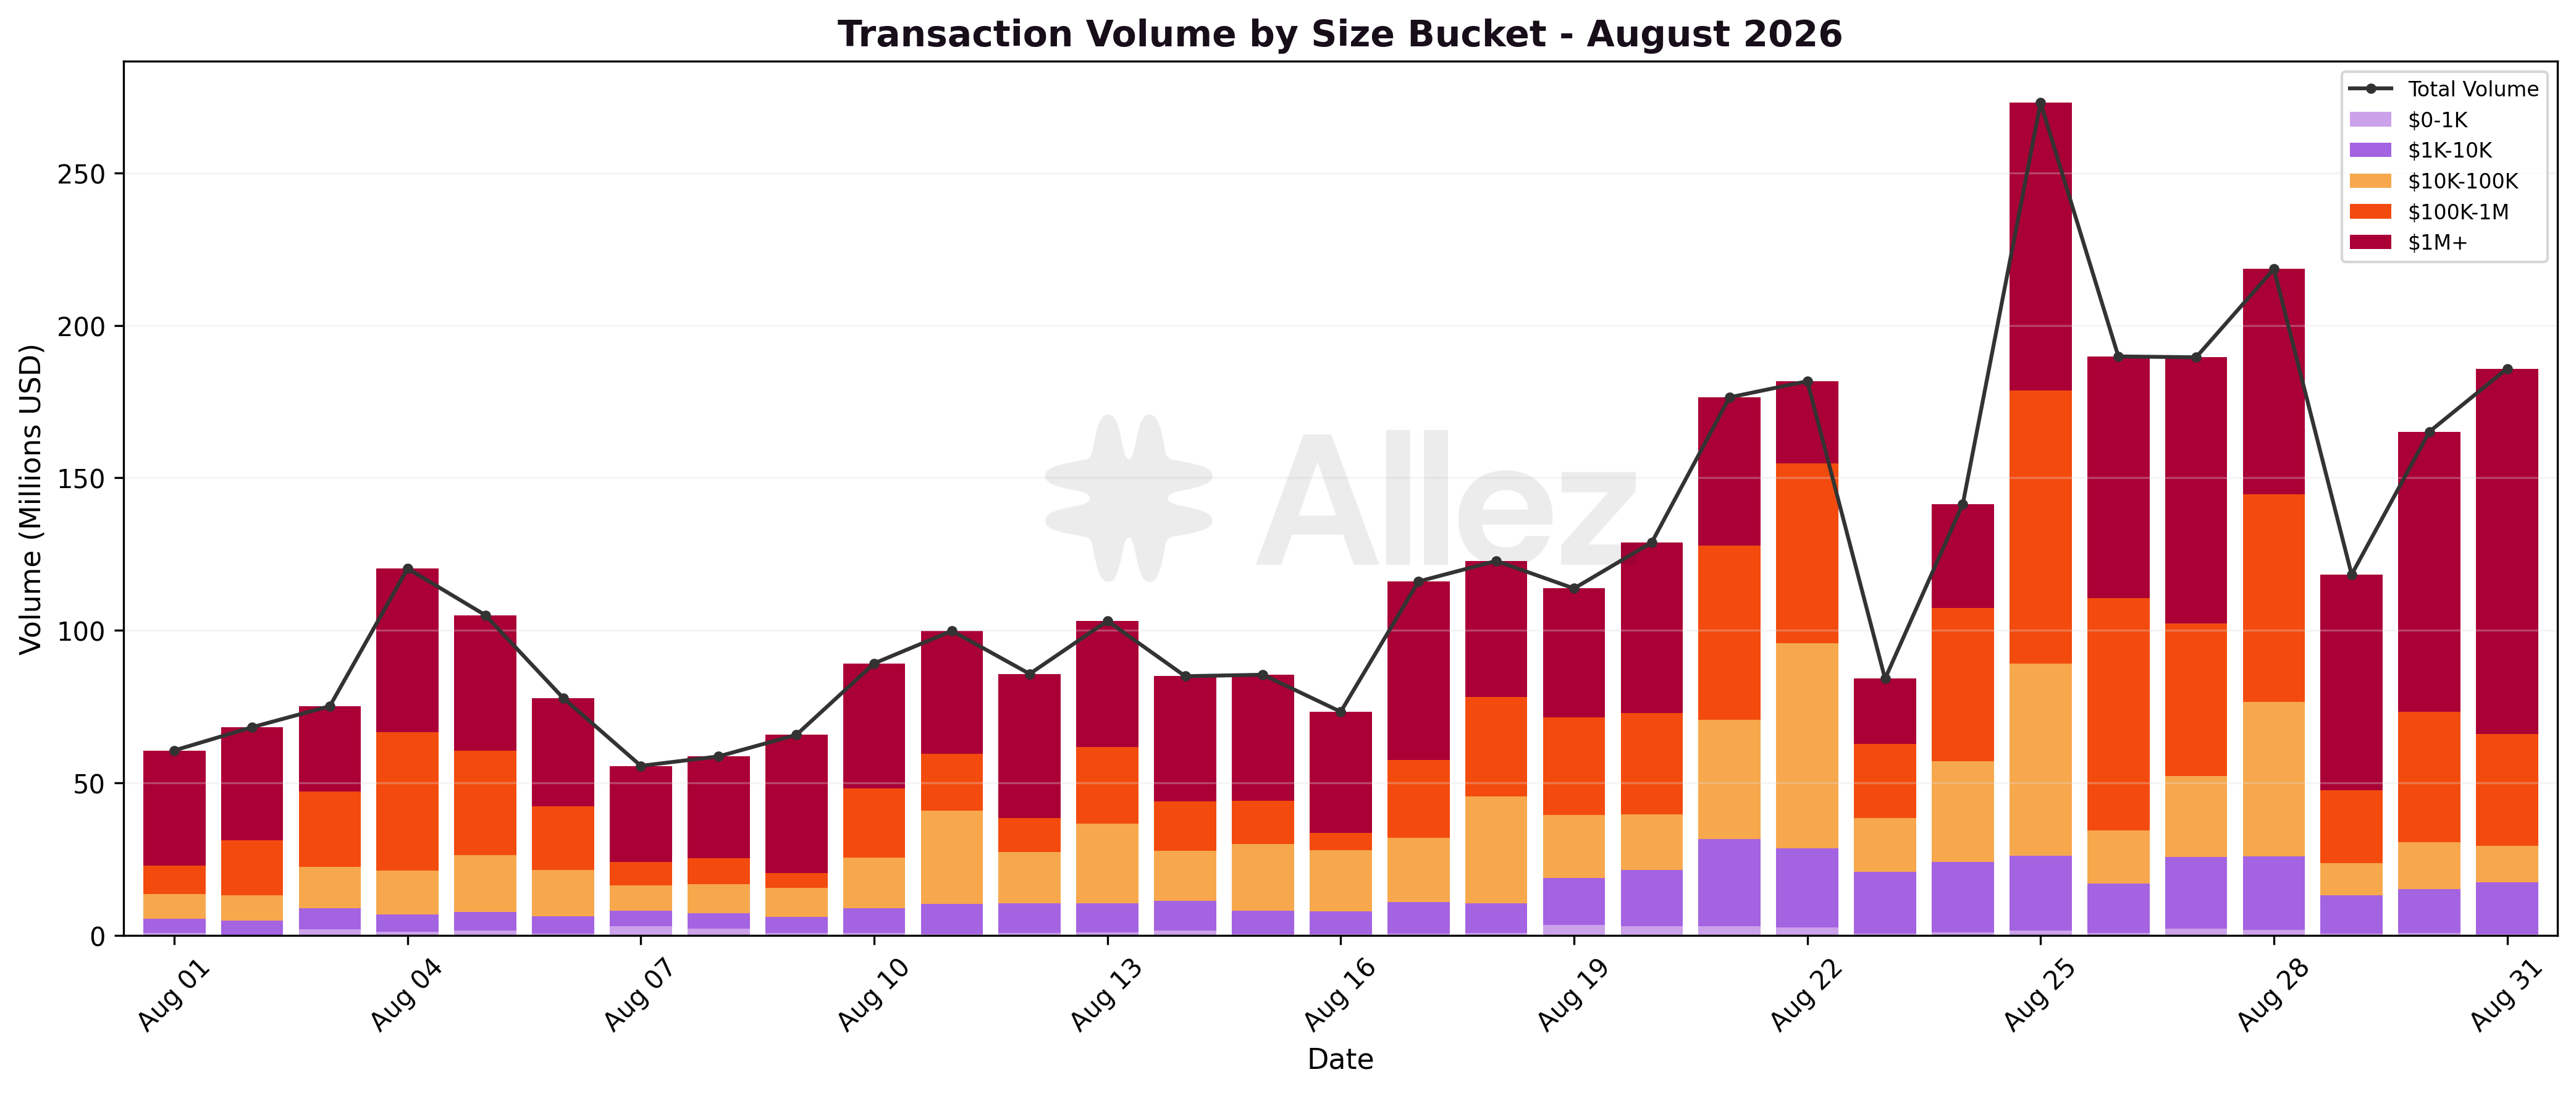
| Size bucket | Volume | MoM |
|---|---|---|
| $1M+ | $1.59B | -24.3% |
| $100K-1M | $0.99B | -13.3% |
| $10K-100K | $0.70B | +65.0% |
| $1K-10K | $0.40B | +192.9% |
| $0-1K | $0.04B | -30.2% |
Large tickets still dominate, but less than before: the $1M+ and $100K-1M buckets together accounted for $2.58B, about 69% of total volume, down from 84% in July. The $1M+ and $100K-1M buckets fell 24.3% and 13.3%, while the $10K-100K rose 65% and the $1K-10K 193%.
Klend interest fees were $4.16M against July's $4.53M, down 8.1%, but the decline comes from July's elevated base. July 3 to 9 ran $170K to $228K per day against a July median of $127.0K, lifting the July total. On a median-day basis interest rose, from $127.0K in July to $130.0K in August.
The accrual view agrees with the median day. Averaging reserve-level borrowed balances and borrow APRs over each month, average debt rose from $922.8M to $939.1M, up 1.8%, while the debt-weighted blended borrow APR eased from 5.705% to 5.624%, a fall of 8.2 bps. Implied accrual is flat, $4.39M in July against $4.40M in August.
A shift-share decomposition of the 8.2 bps splits into a -15.9 bps rate effect, a +9.0 bps mix effect and a -1.2 bps interaction. Main SOL drove the rate effect, -51 bps as its borrow APR eased from 9.68% to 7.11%, against Ethena PYUSD at +27 bps (2.42% to 3.48%).
7. Conclusions and Forward Look
August's risk profile improved. Liquidations were minimal and the rally moved the uncorrelated book further from its thresholds, with 87.7% of its value in the safest tier and $0.62M within 5% of liquidation.
The 11.7% supply and 7.8% debt growth was mostly price: SOL, LST and BTC revaluation supplied about 95% of the $258.6M supply gain, and those three categories now make up 37.2% of the protocol. Deposit-led growth was narrow, led by ONyc into OnRe and the LSTs dfdvSOL and JitoSOL. July's report asked whether Prime and Maple would stabilise; they did not, shedding a combined $30M as private credit kept easing.
Outlook
For September, the watch items are whether the SOL-linked supply holds if the price retraces, and whether the new products (the Institutional Yield vault, Fixed Rates and the reUSD market) convert their first balances into durable ones. The market rollup must also resolve the unnamed isolated markets described in Section 4 before September's totals can be compared with August's.
Appendix: Asset Category Classification
| Category | Month-end Supply | Share | Supply MoM | Representative assets |
|---|---|---|---|---|
| Stablecoins | $1,076.0M | 43.4% | -0.2% | USDC, PYUSD, USDG, USDT, USDS, USX, CASH |
| LSTs | $551.6M | 22.3% | +38.2% | JitoSOL, jupSOL, mSOL, dfdvSOL, dSOL, INF |
| RWAs | $426.1M | 17.2% | +1.9% | PRIME, ONyc, PST, syrupUSDC, tokenized stocks, eUSX |
| SOL | $286.7M | 11.6% | +34.7% | SOL |
| BTC | $82.6M | 3.3% | +31.3% | cbBTC, xBTC, WBTC, zBTC, fBTC |
| Other | $54.9M | 2.2% | +15.4% | ETH, JLP, BONK, JUP, KMNO |
Classification notes: LSTs are Solana liquid-staking tokens representing staked SOL (such as JitoSOL, mSOL, dfdvSOL and INF); this covers tokens ending in SOL other than SOL itself, plus INF. RWAs are tokenized real-world assets, including private-credit tokens (PRIME, syrupUSDC), insurance tokens (ONyc), and tokenized equities; syrupUSDC is a Maple credit token classified as an RWA despite its USDC suffix. Stablecoins are USD-pegged tokens. Pendle PT tokens are classified under the category of their underlying.
This report represents independent risk analysis by Allez Labs for the Kamino Finance community.
Prepared by: Allez Labs Risk Team
Report Date: August 31, 2026
Next Report: September 2026 Monthly Report