Kamino Lend Monthly Risk Insights - April 2026
Kamino navigated April's DeFi-wide stress cleanly. Two external incidents drove ecosystem-wide deleveraging this month: a UXD market price compression on April 1 (preceding the Drift exploit by ~3 hours, then compounding with it into a 48-hour Solana stress window) was absorbed smoothly via 9,628 micro-liquidations, and KelpDAO's $292M rsETH bridge exploit on April 18 left Aave V3 facing $200M in potential bad debt and triggered billions in DeFi withdrawals - among which Maple Finance’s subsequent DeFi exposure reduction.
Against this backdrop, Kamino's risk metrics improved: the share of debt sitting within 4% of its liquidation threshold fell -47%, and stress-test potential bad debt contracted -17% to -36% across all scenarios. Total supply contracted -16.9% to $2.43B and total debt -15.2% to $0.97B as users repositioned conservatively. The smaller specialized markets (OnRe +15.5%, Solstice +51.4%, Huma +6.4%) continued to grow, adding supply independently of the stablecoin contraction.
1. Market Context & SOL Price
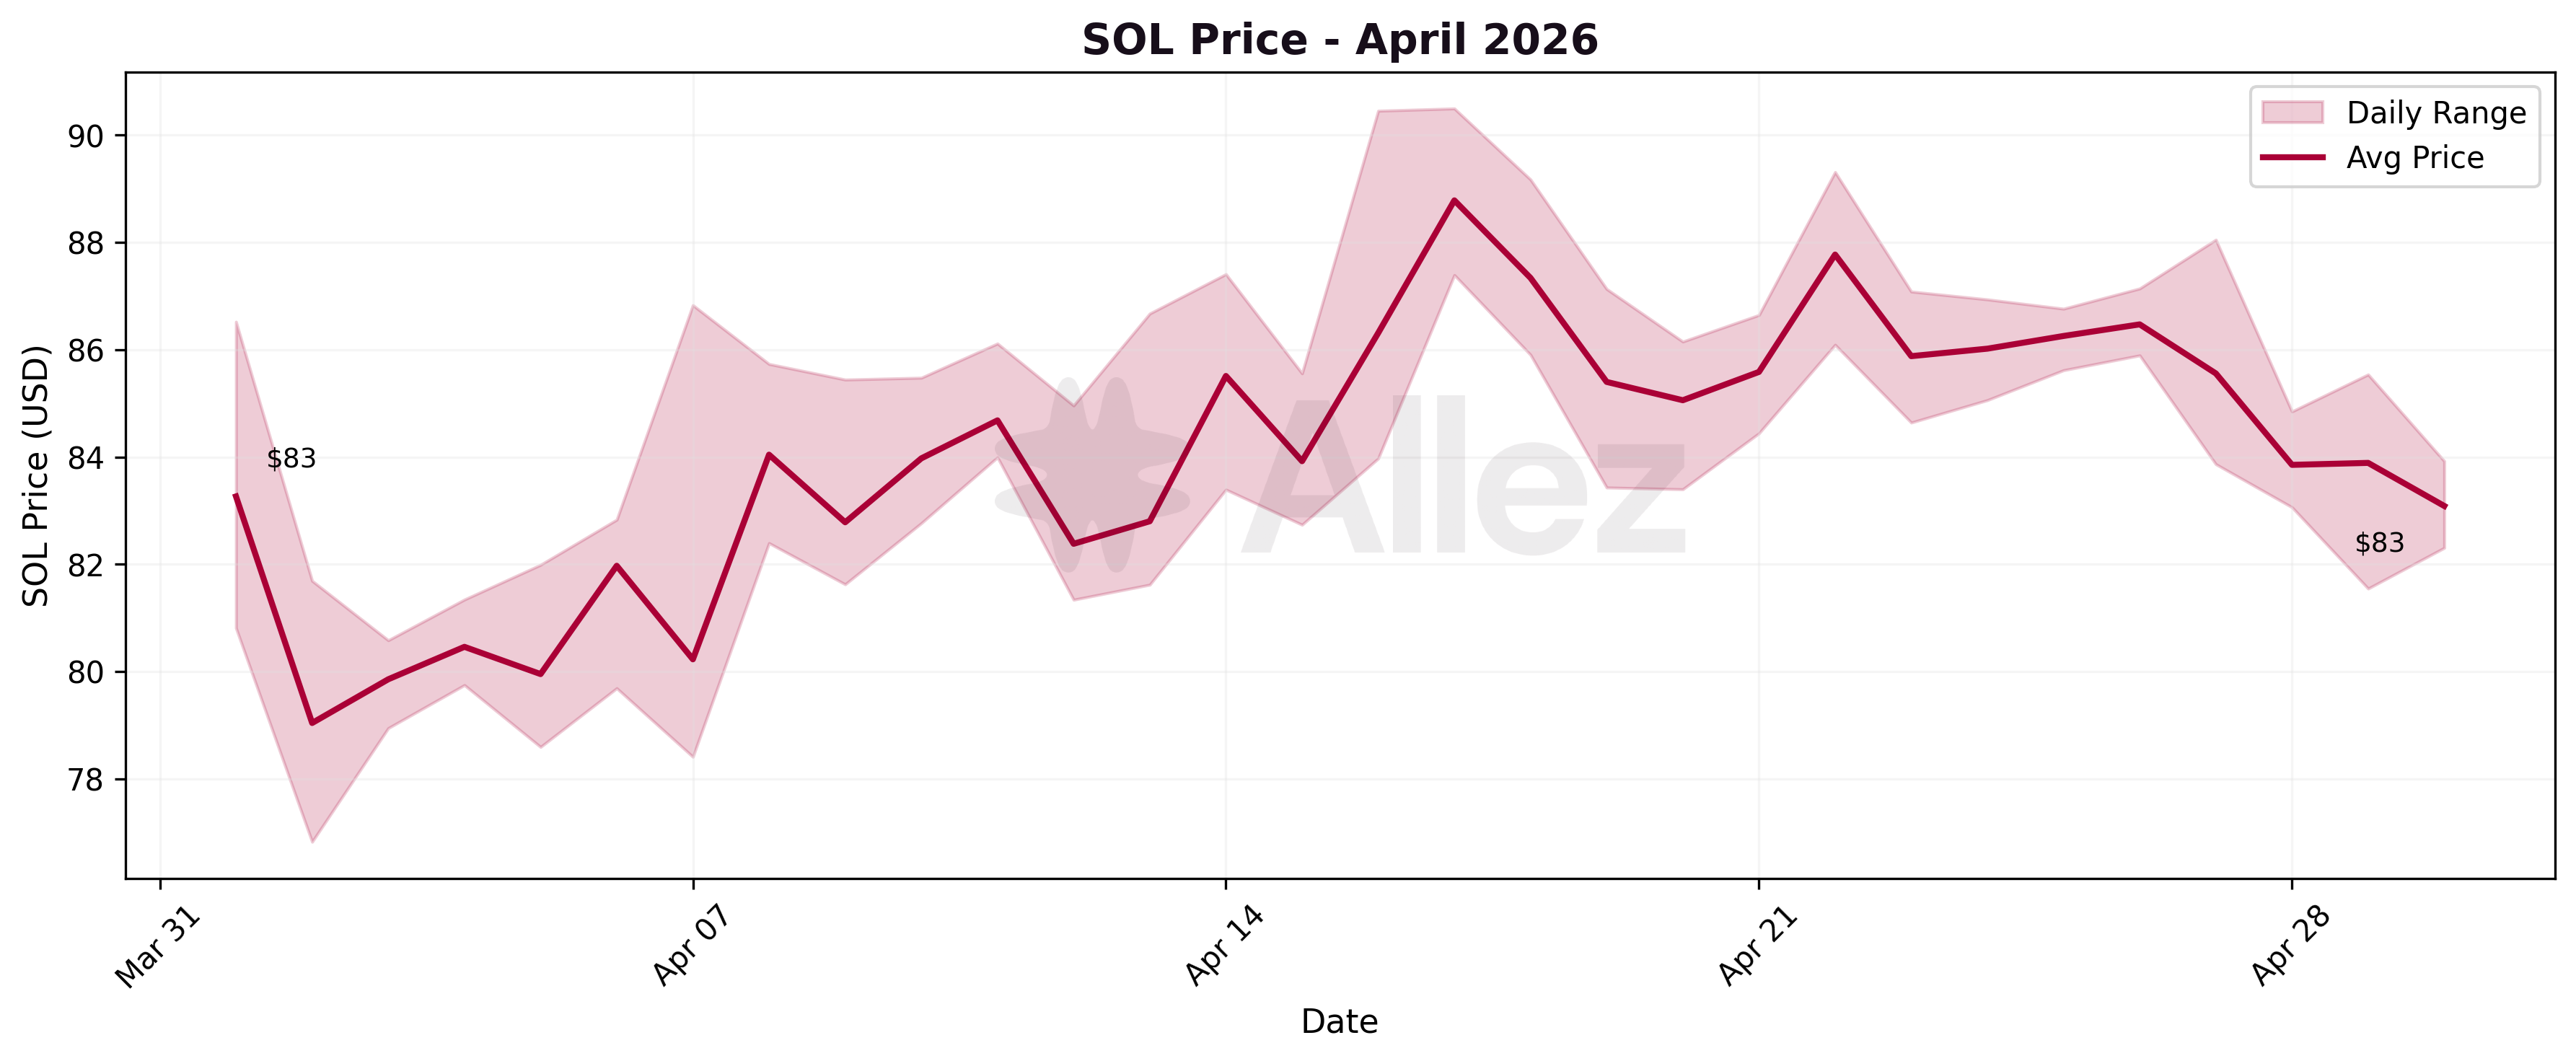
April was a challenging month for the DeFi ecosystem, with two large protocol-external exploits against an otherwise stable price backdrop. SOL traded in a $77-$91 range (daily averages $79-$89) ending the month up 1%. The month opened at $82.00 (March 31 daily-average close), dipped following the Drift exploit, recovered to a high of $91 around mid-month, and closed at $83. SOL's MoM price change was negligible (+1.3%), so SOL/LST supply and debt changes reflect user activity rather than mark-to-market effects. BTC appreciated ~12% across April, so cbBTC dollar-denominated changes are addressed in token-quantity terms below.
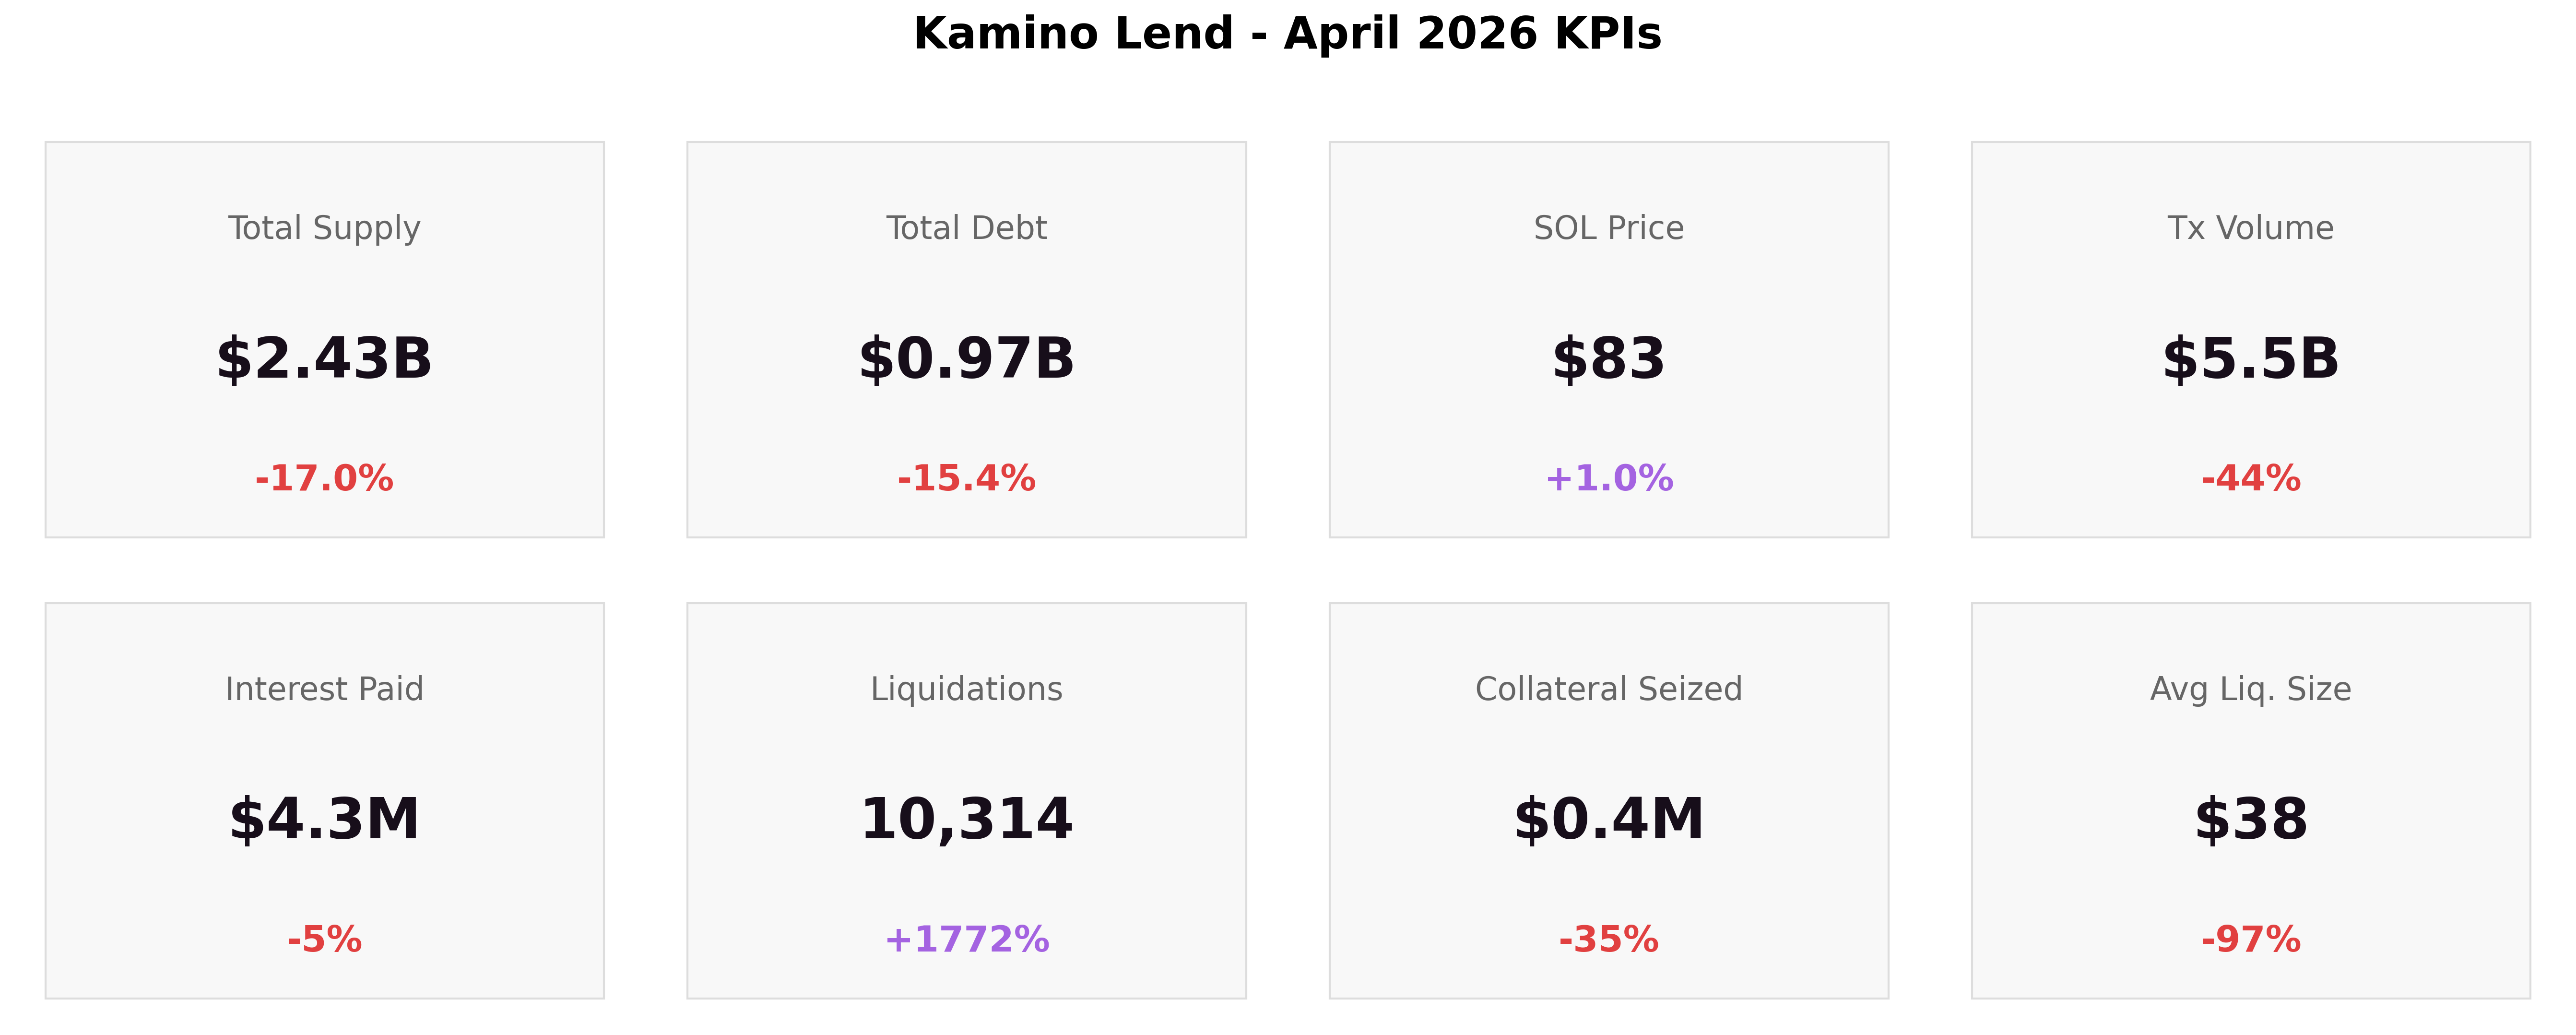
Kamino closed April with:
-
Total Supply: $2.43B (-16.9%)
-
Total Debt: $0.97B (-15.2%)
-
SOL Price: $83 (+1.3% MoM)
-
Transaction Volume: $5.5B (-45%)
-
Interest Paid: $4.78M (+4% MoM)
-
Liquidations: 10,311 (+1,772%)
-
Collateral Seized: $0.4M (-35%)
-
Avg Liquidation Size: $38 (-97%)
Supply (-16.9%) and debt (-15.2%) moved roughly in parallel, with protocol-wide utilization edging up from 38.9% to 39.9% (+1pp) as supply contracted slightly faster than debt.
The headline liquidation count (10,311) breaks down into 9,628 micro-liquidations on April 1-2 when UXD temporarily lost its ~1.7% premium against USDC, a -1.4% relative move sufficient to push correlated stablecoin-pair positions past their liquidation thresholds. Beyond that, April recorded only 683 additional liquidations, the second-quietest month on record.
The $4.8M interest paid in April (+4% MoM versus March's $4.6M) is driven by a shift in the borrow mix, not by debt growth: average daily debt actually fell from $1.16B to $1.03B (-10.6%), but as Maple Market's low-rate stablecoin-on-stablecoin borrows exited, the residual debt skewed toward Main and Prime markets where SOL/USDC and PRIME-collateral borrows carry materially higher rates. The implied average borrow APR rose from ~4.6% to ~5.6% (+21%), more than offsetting the smaller debt base.
DeFi-wide context: April's DeFi incidents
April was defined by two major external incidents that shaped lending market behavior across the ecosystem.
The Drift exploit on April 1 (~$285M drained in ~12 minutes around 16:05 UTC, attributed to a multi-month social-engineering campaign that compromised admin keys via a fake collateral token) triggered Solana-wide stress. SOL dipped to $77 within 24 hours of the event. Earlier the same day, between 10:00 and 13:00 UTC, UXD market price had already lost its ~1.7% premium versus USDC and compressed from ~$1.017 to ~$1.003 - several hours before the Drift exploit. This -1.4% relative move versus USDC was sufficient to push thousands of correlated stablecoin-pair positions across Kamino's tight DTL thresholds, generating close to 10k micro-liquidations documented in the Risk & Liquidations section below. The two events compounded into a single 48-hour stress window across Solana DeFi.
The KelpDAO/rsETH exploit on April 18 saw an attacker exploit a LayerZero verifier configuration on rsETH's cross-chain bridge to mint 116,500 rsETH (~$292M) without backing collateral, then deposit it on Aave V3/V4 to borrow ~$190-196M in WETH and wstETH. ~$6B in deposits exited Aave within 24 hours, and LlamaRisk scoped Aave's potential bad debt at $123-230M depending on the recovery scenario - the largest single incident in Aave's recent history, with a DeFi United coalition recovery plan in execution by month-end. The DeFi-wide deleveraging that followed is what propagated to Kamino through Maple Finance's downstream response (covered below).
Kamino had no exposure to this event: no rsETH or KelpDAO assets are listed on Kamino. As a precaution, Kamino placed all three LayerZero-bridged reserves then listed on Kamino (USDS, LBTC, and FBTC) into reduce-only mode on April 18 (21:26 UTC), allowing withdrawals and repayments while disabling new deposits and borrows. The broader ecosystem-wide risk-off positioning translated to withdrawals from yield-seeking capital as users reevaluated their risk/return appetites. Maple Finance's publicly announced reduction of all DeFi exposure on April 20 manifested as the largest Kamino market contraction of the month (-$200M PYUSD across the protocol, -$165M Maple Market supply between April 18-22).
Kamino Ecosystem Updates:
-
Whitelisted Reserves (April 9): A new contract-level security feature for lending vaults which restricts vault allocations exclusively to pre-approved reserves at the protocol level, preventing allocations into unvetted markets. Kamino enabled the feature across all vaults shown on its frontend, including vaults managed by Allez Labs, Sentora, Gauntlet, Steakhouse, and RockawayX. More details here.
-
OnRe incentive increase (April 30): Monthly incentives for the OnRe Market rose to $25,000 total ($18,750 USDC supply rewards + $6,250 USDC borrow rewards), supporting the ONyc collateral strategy. The market grew +$16M in supply during the month to $122M.
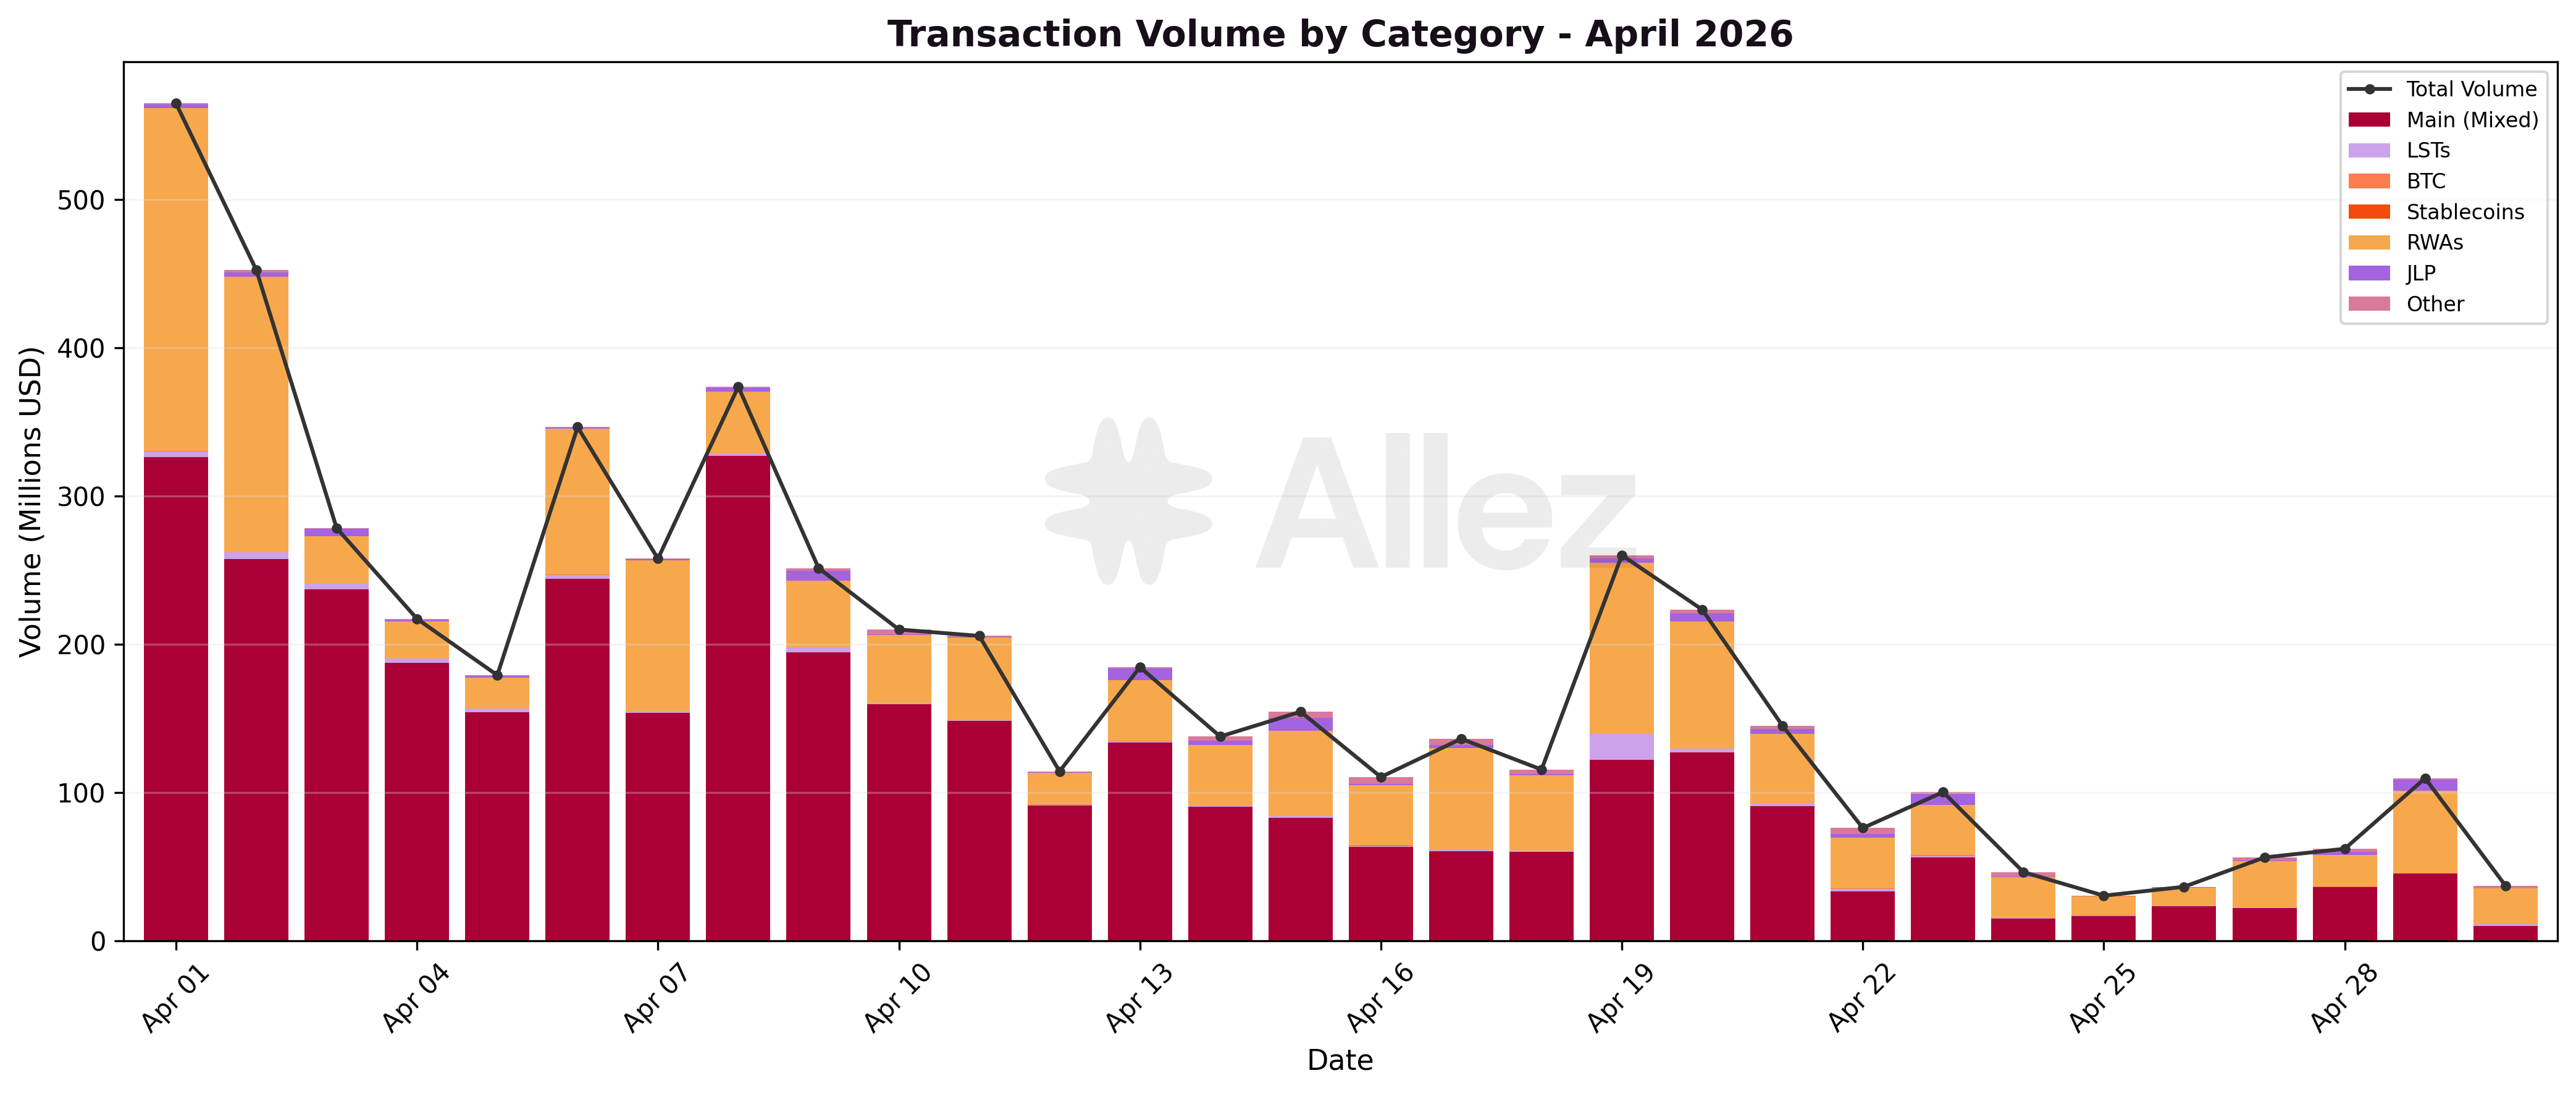
2. Macro View: Liquidity by Category
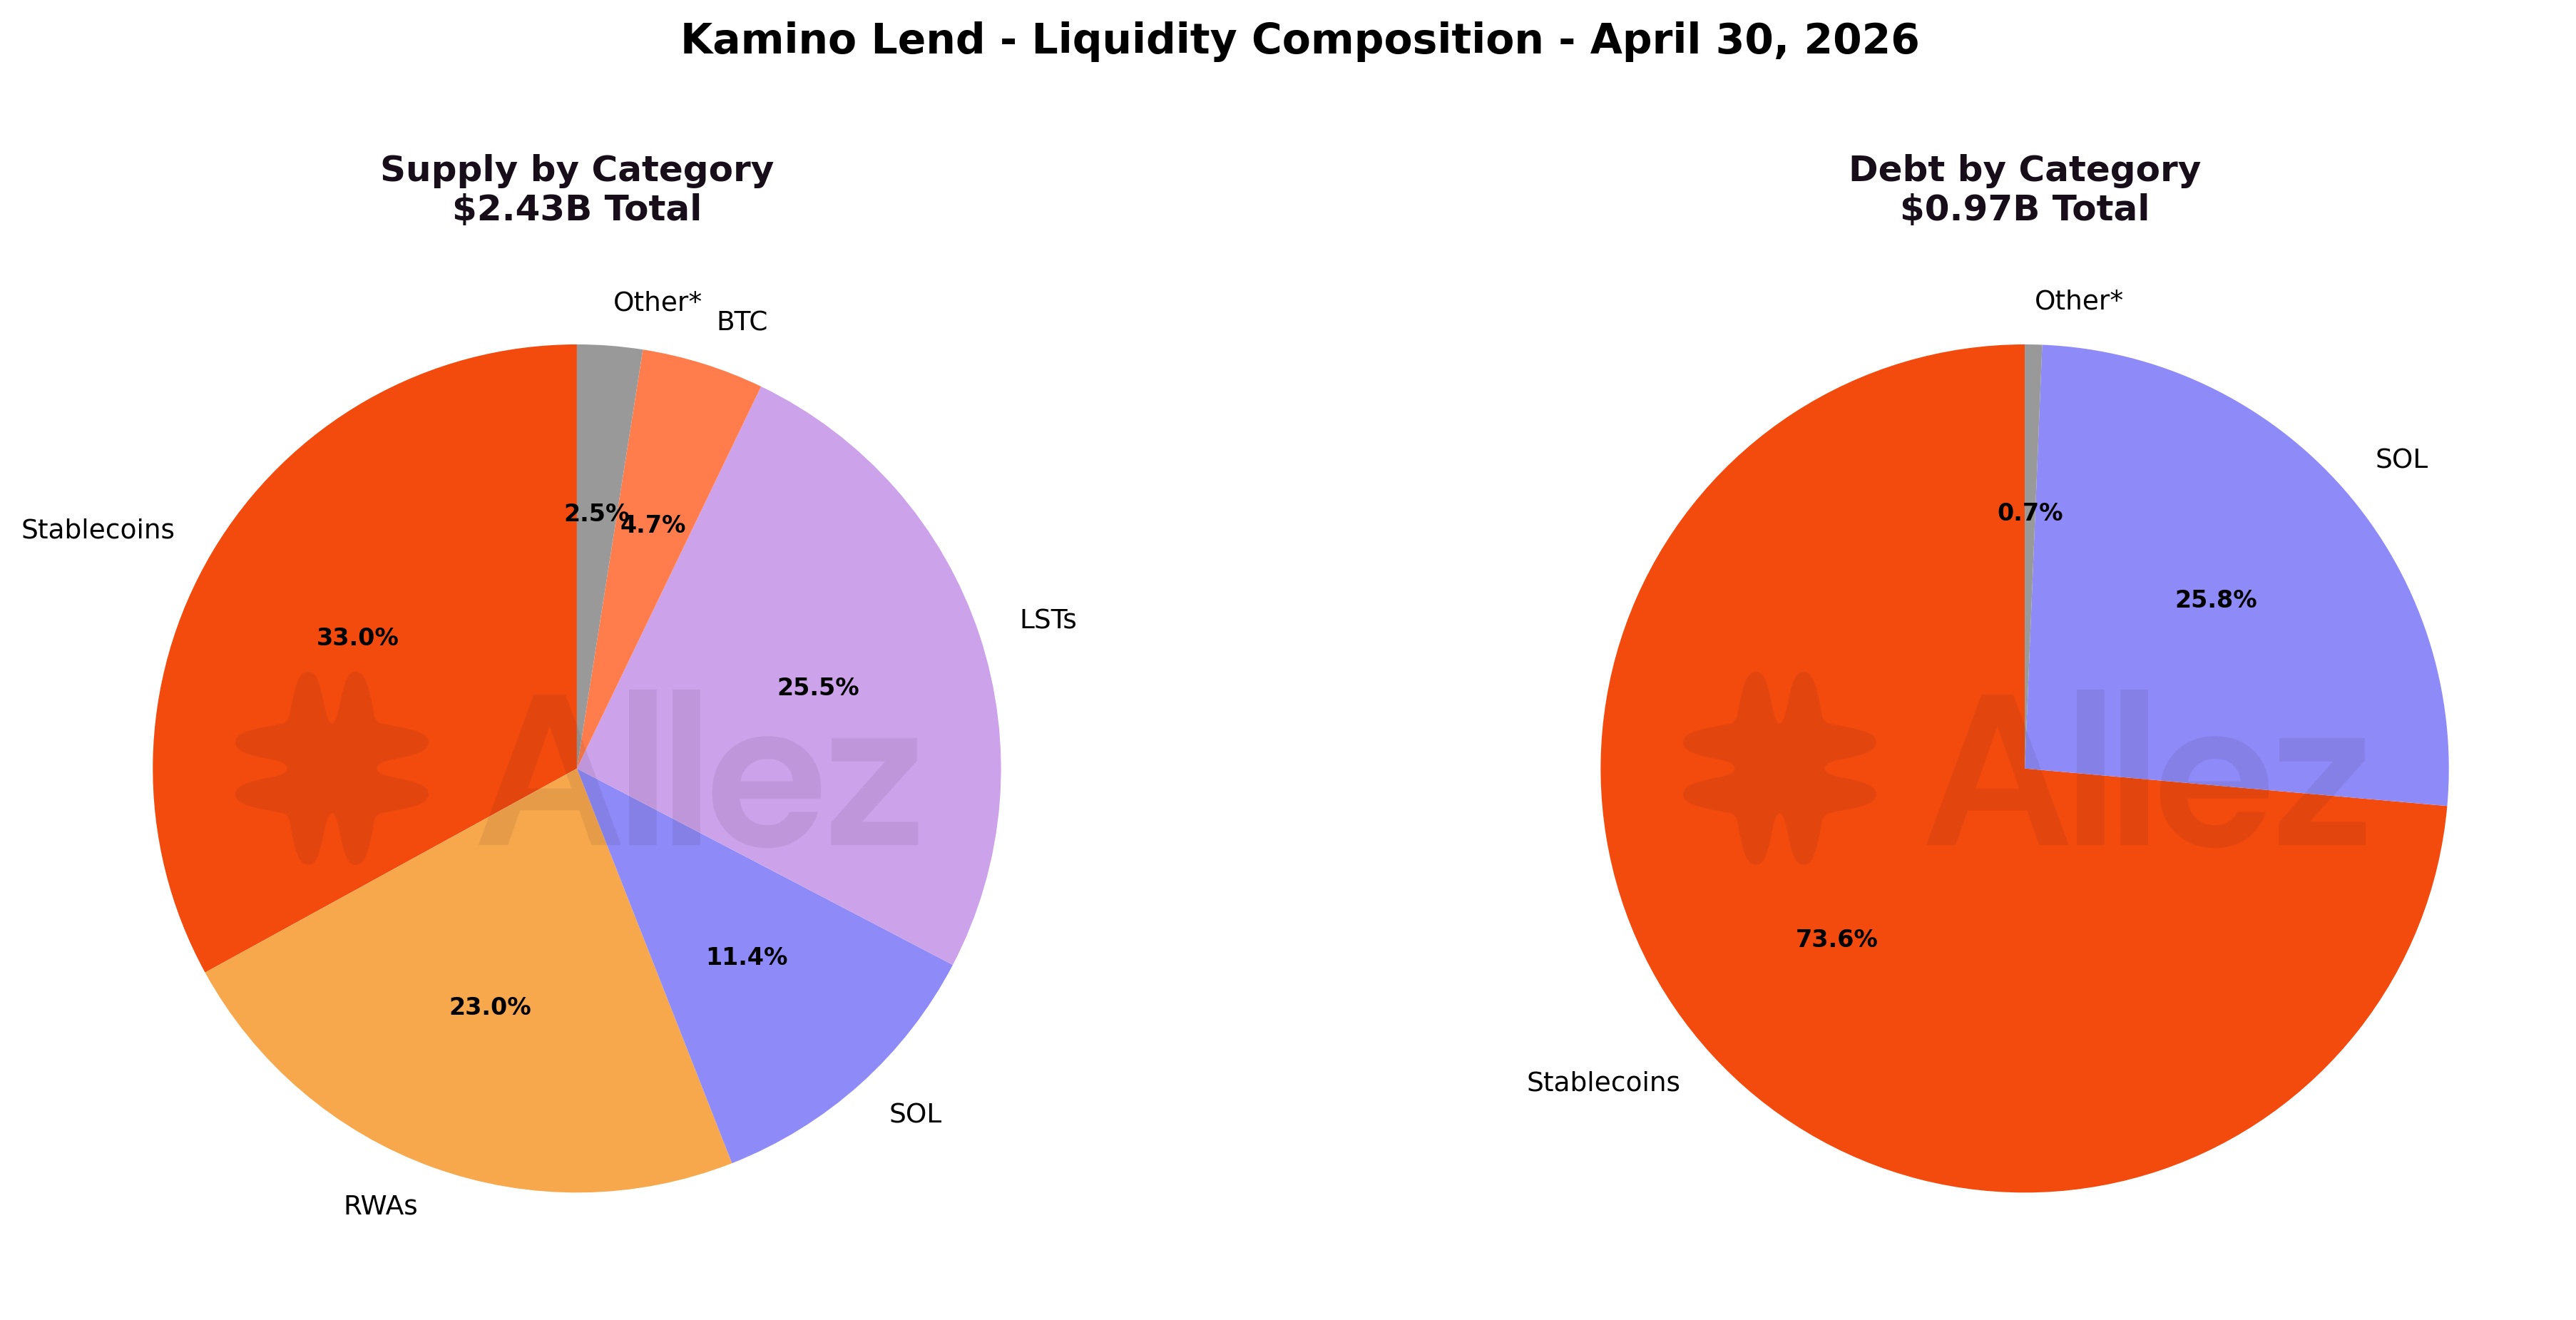
Composition split (April 30 vs March 31):
| Category | Supply | Share | MoM Share | Debt | Debt Share | MoM Debt Share |
|---|---|---|---|---|---|---|
| Stablecoins | $803M | 33.0% | -4.7pp | $717M | 73.6% | -3.4pp |
| LSTs | $620M | 25.5% | +4.0pp | $2.1M | 0.2% | +0.0pp |
| RWAs | $558M | 23.0% | +0.5pp | $0.3M | <0.1% | - |
| SOL | $277M | 11.4% | +1.4pp | $251M | 25.7% | +3.2pp |
| BTC | $113M | 4.6% | -1.0pp | $3.2M | 0.3% | +0.1pp |
| Other | $60M | 2.5% | -0.2pp | $0.7M | 0.1% | - |
The stablecoin category drove almost the entire supply contraction, falling from 37.7% to 33.0% of protocol liquidity, a 4.7 percentage-point share decline. LSTs gained share (21.5% to 25.5%) without growing in absolute terms (-1.4%), because the denominator shrank faster. USD-denominated supply (stablecoins + RWAs) fell from 60.2% to 56.0%, unwinding the March Maple migration that had previously pushed USD-side capital into the protocol. March had added +$148M across the two main Maple reserves (Maple PYUSD $113M → $200M, +$87M, and Maple syrupUSDC $128M → $189M, +$61M). April removed -$161M from those same reserves (Maple PYUSD $200M → $105M, -$95M, and Maple syrupUSDC $189M → $123M, -$66M), erasing the March gain in full and leaving both reserves slightly below their February baseline.
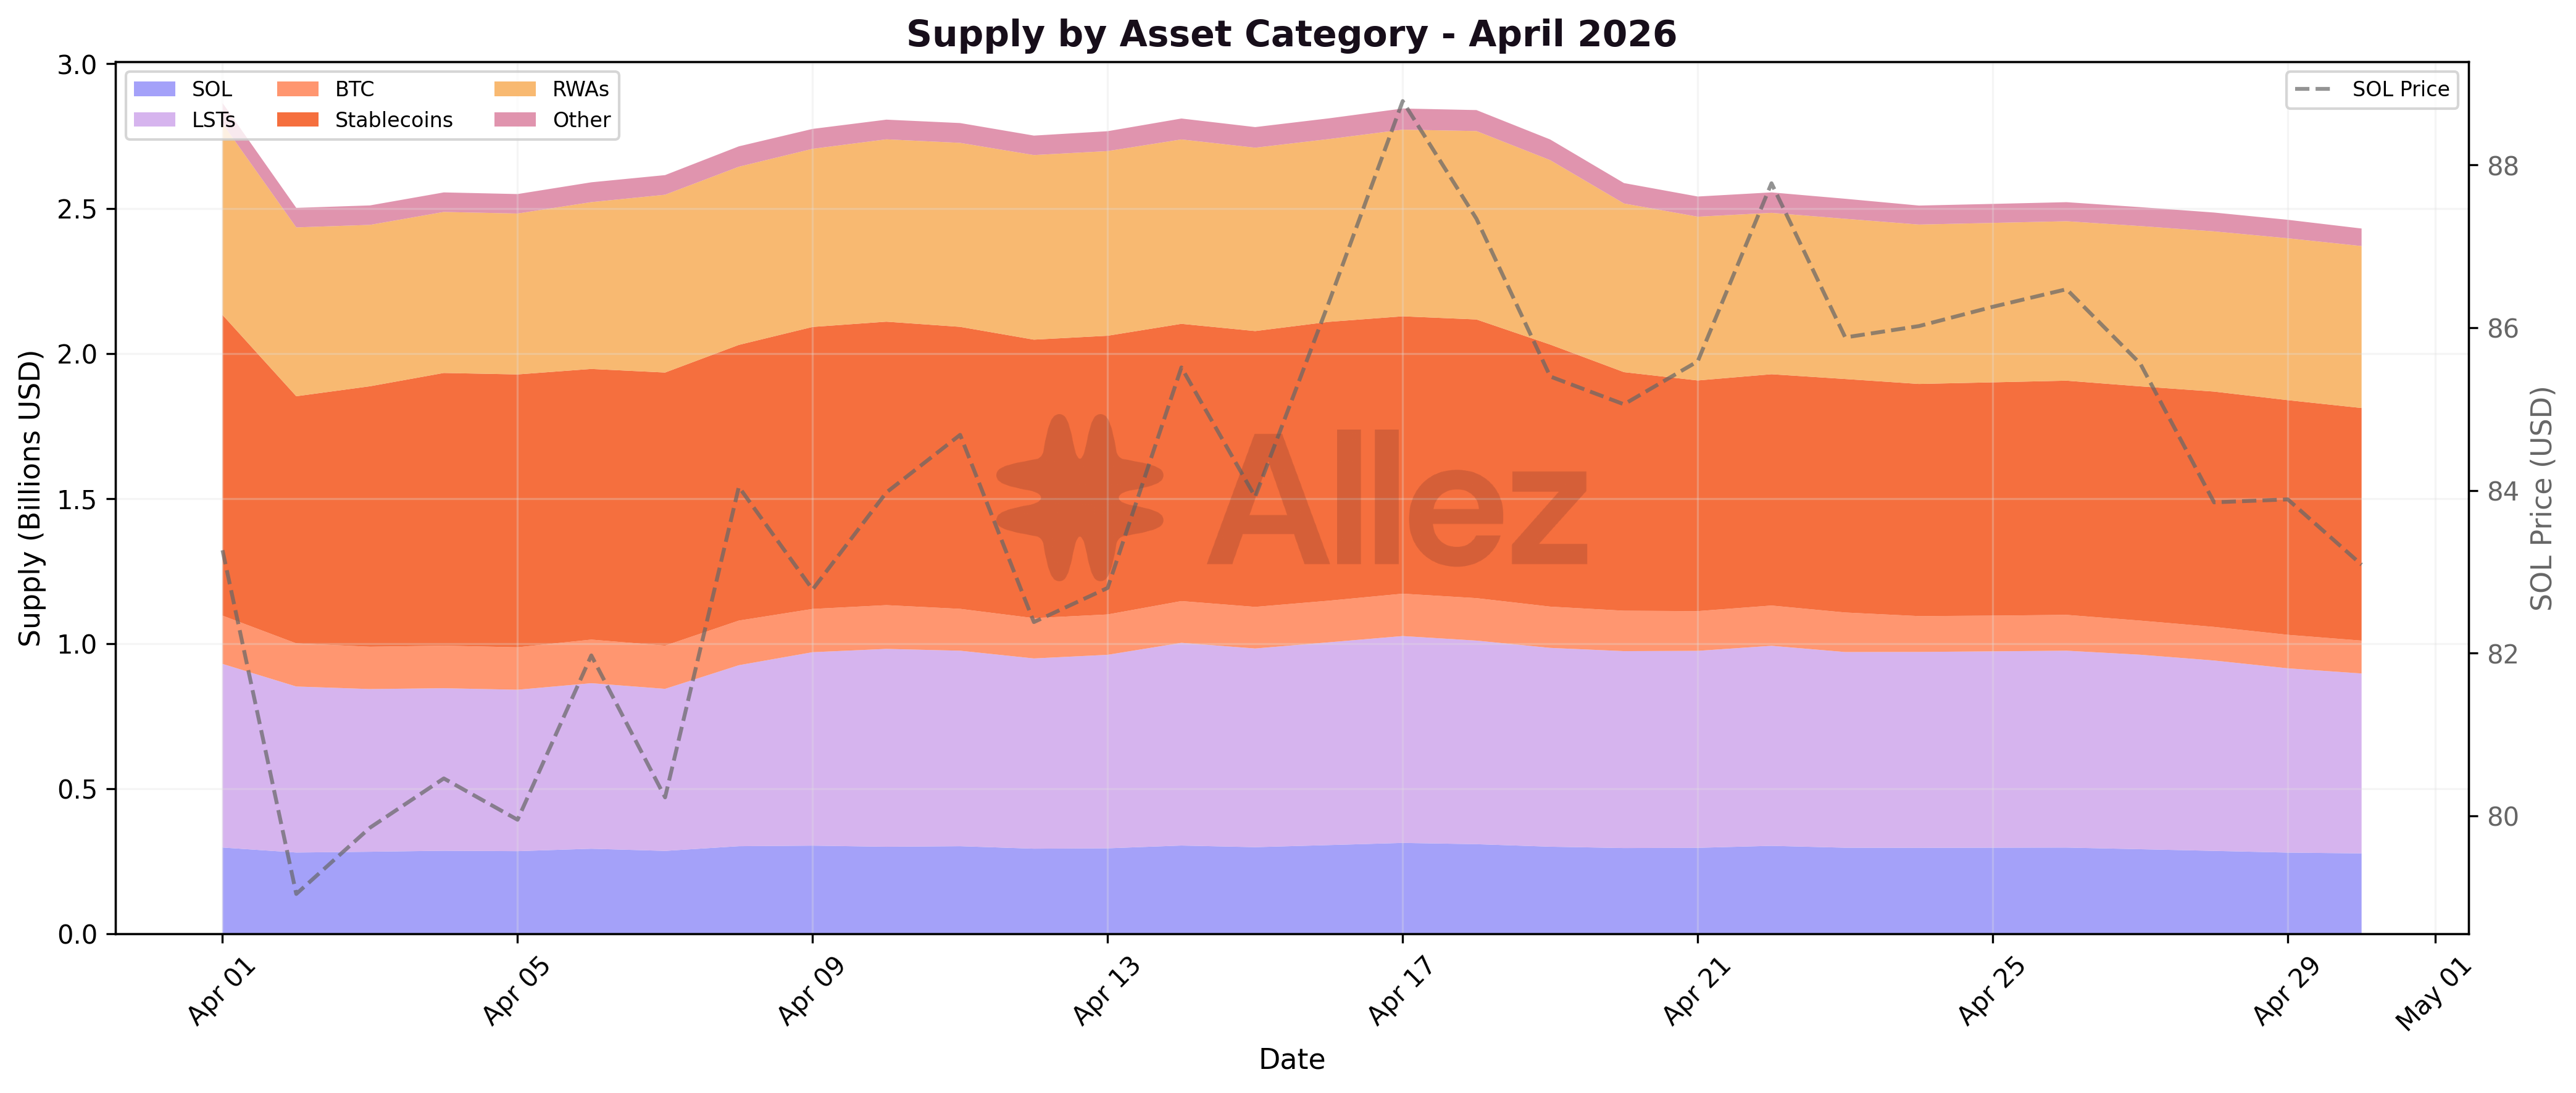
Daily category trends show a step-down on April 2-3 (the Drift / UXD compression window) followed by a steady drift lower through mid-month for stablecoins, with a second wave around April 18-22 driven by Maple's public DeFi exposure reduction. RWAs declined more gradually without a single cliff event, with the -15% drop spread across the month rather than concentrated on a specific date. The contraction was concentrated in a handful of asset moves rather than a category-wide rotation.
Monthly supply changes by category:
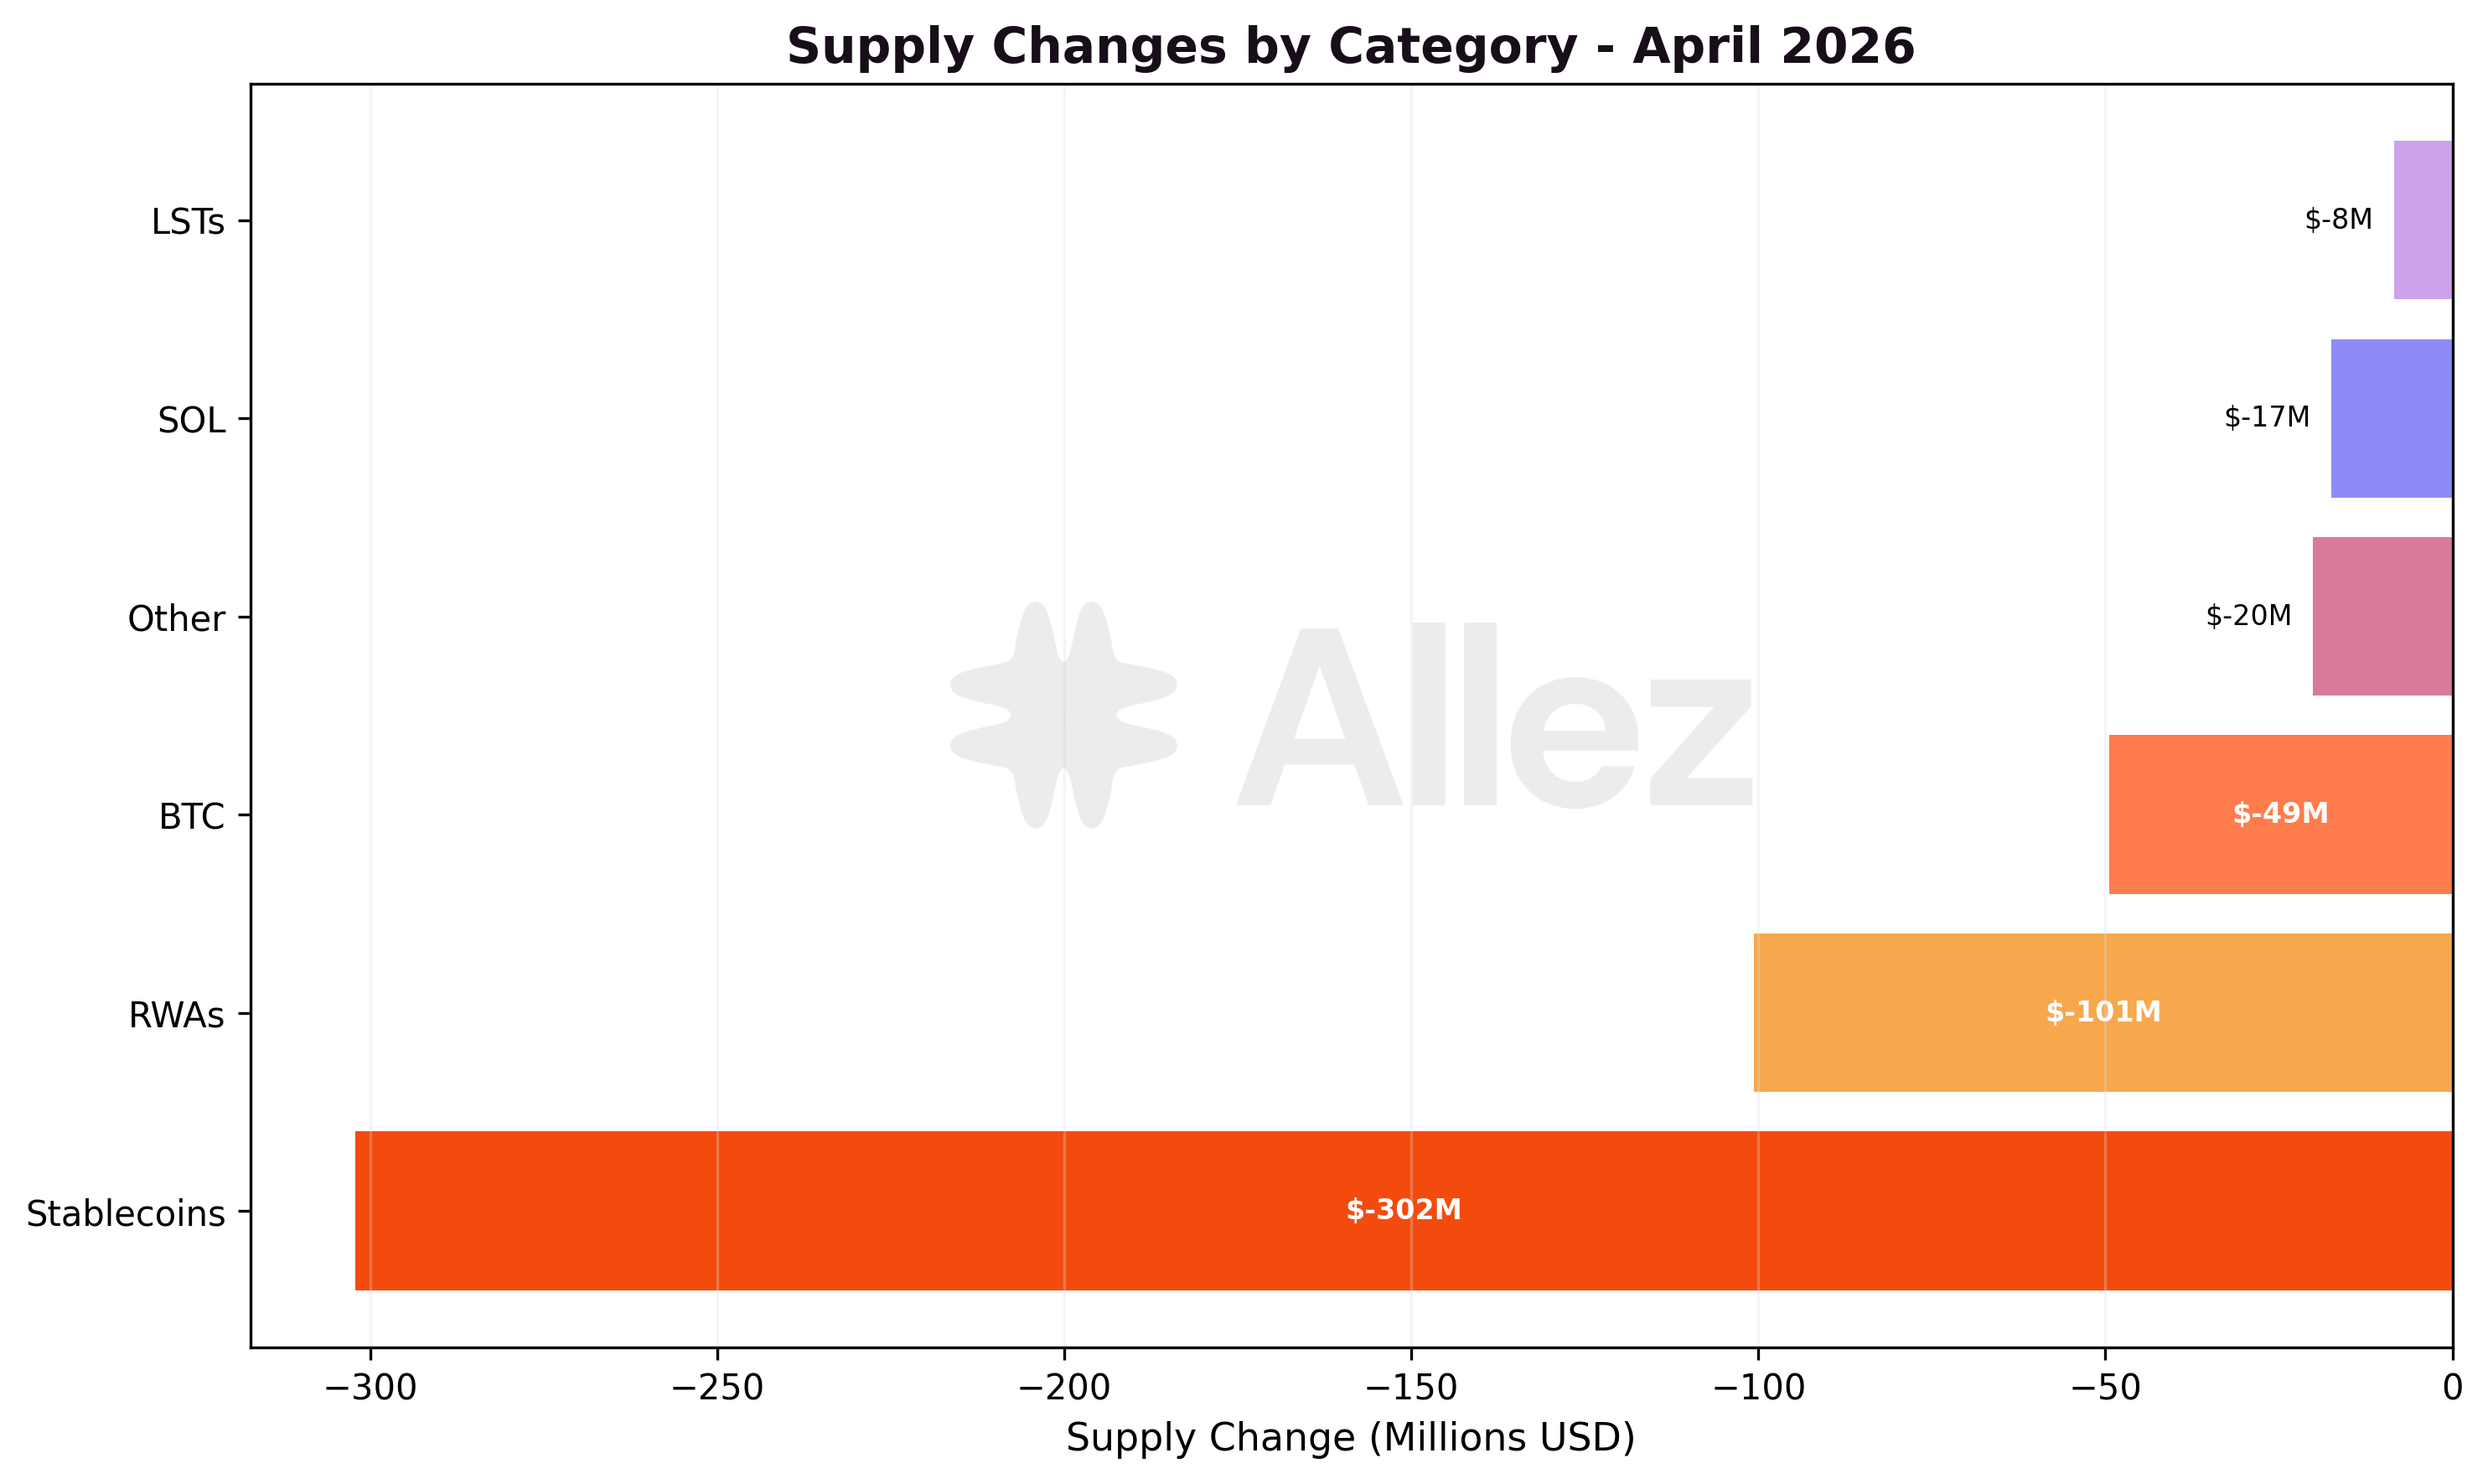
Key category-level movements:
-
Stablecoins: -27.3% ($1,104M to $803M). PYUSD led with -$200M (Maple unwind: Maple PYUSD reserve -$100M, Main PYUSD reserve -$100M), followed by USDC -$54M and CASH -$13M. This category absorbed the bulk of the protocol's outflow.
-
RWAs: -15.0% ($659M to $558M). syrupUSDC led with -$70M and PRIME -$53M as institutional positions reduced exposure, with eUSX +$5M and ONyc +$8M offsetting part of the decline.
-
BTC: -30.6% ($163M to $113M). cbBTC contracted by 816 tokens (~-$62M valued at April-30 prices). With BTC appreciating across April (implied price moved from ~$68K to ~$76K based on cbBTC reserve token-quantity vs dollar-value ratios), the dollar-term decline was $128M to $82M (-$46M).
-
SOL: -6.1% ($294M to $277M). Native SOL supply fell -$20M MoM.
-
LSTs: -1.4% ($629M to $620M). Aggregate LST supply held flat, with a shift in composition: fwdSOL -$76M and dSOL -$20M offset by mSOL +$41M and JupSOL +$19M.
-
Other: -25.0% ($81M to $60M). JLP contracted -$11M alongside the JLP market itself contracting.
Asset-level flows:
Note: Per-asset figures reflect token quantity changes valued at end-of-period prices, isolating user deposit/withdrawal behavior from price effects.
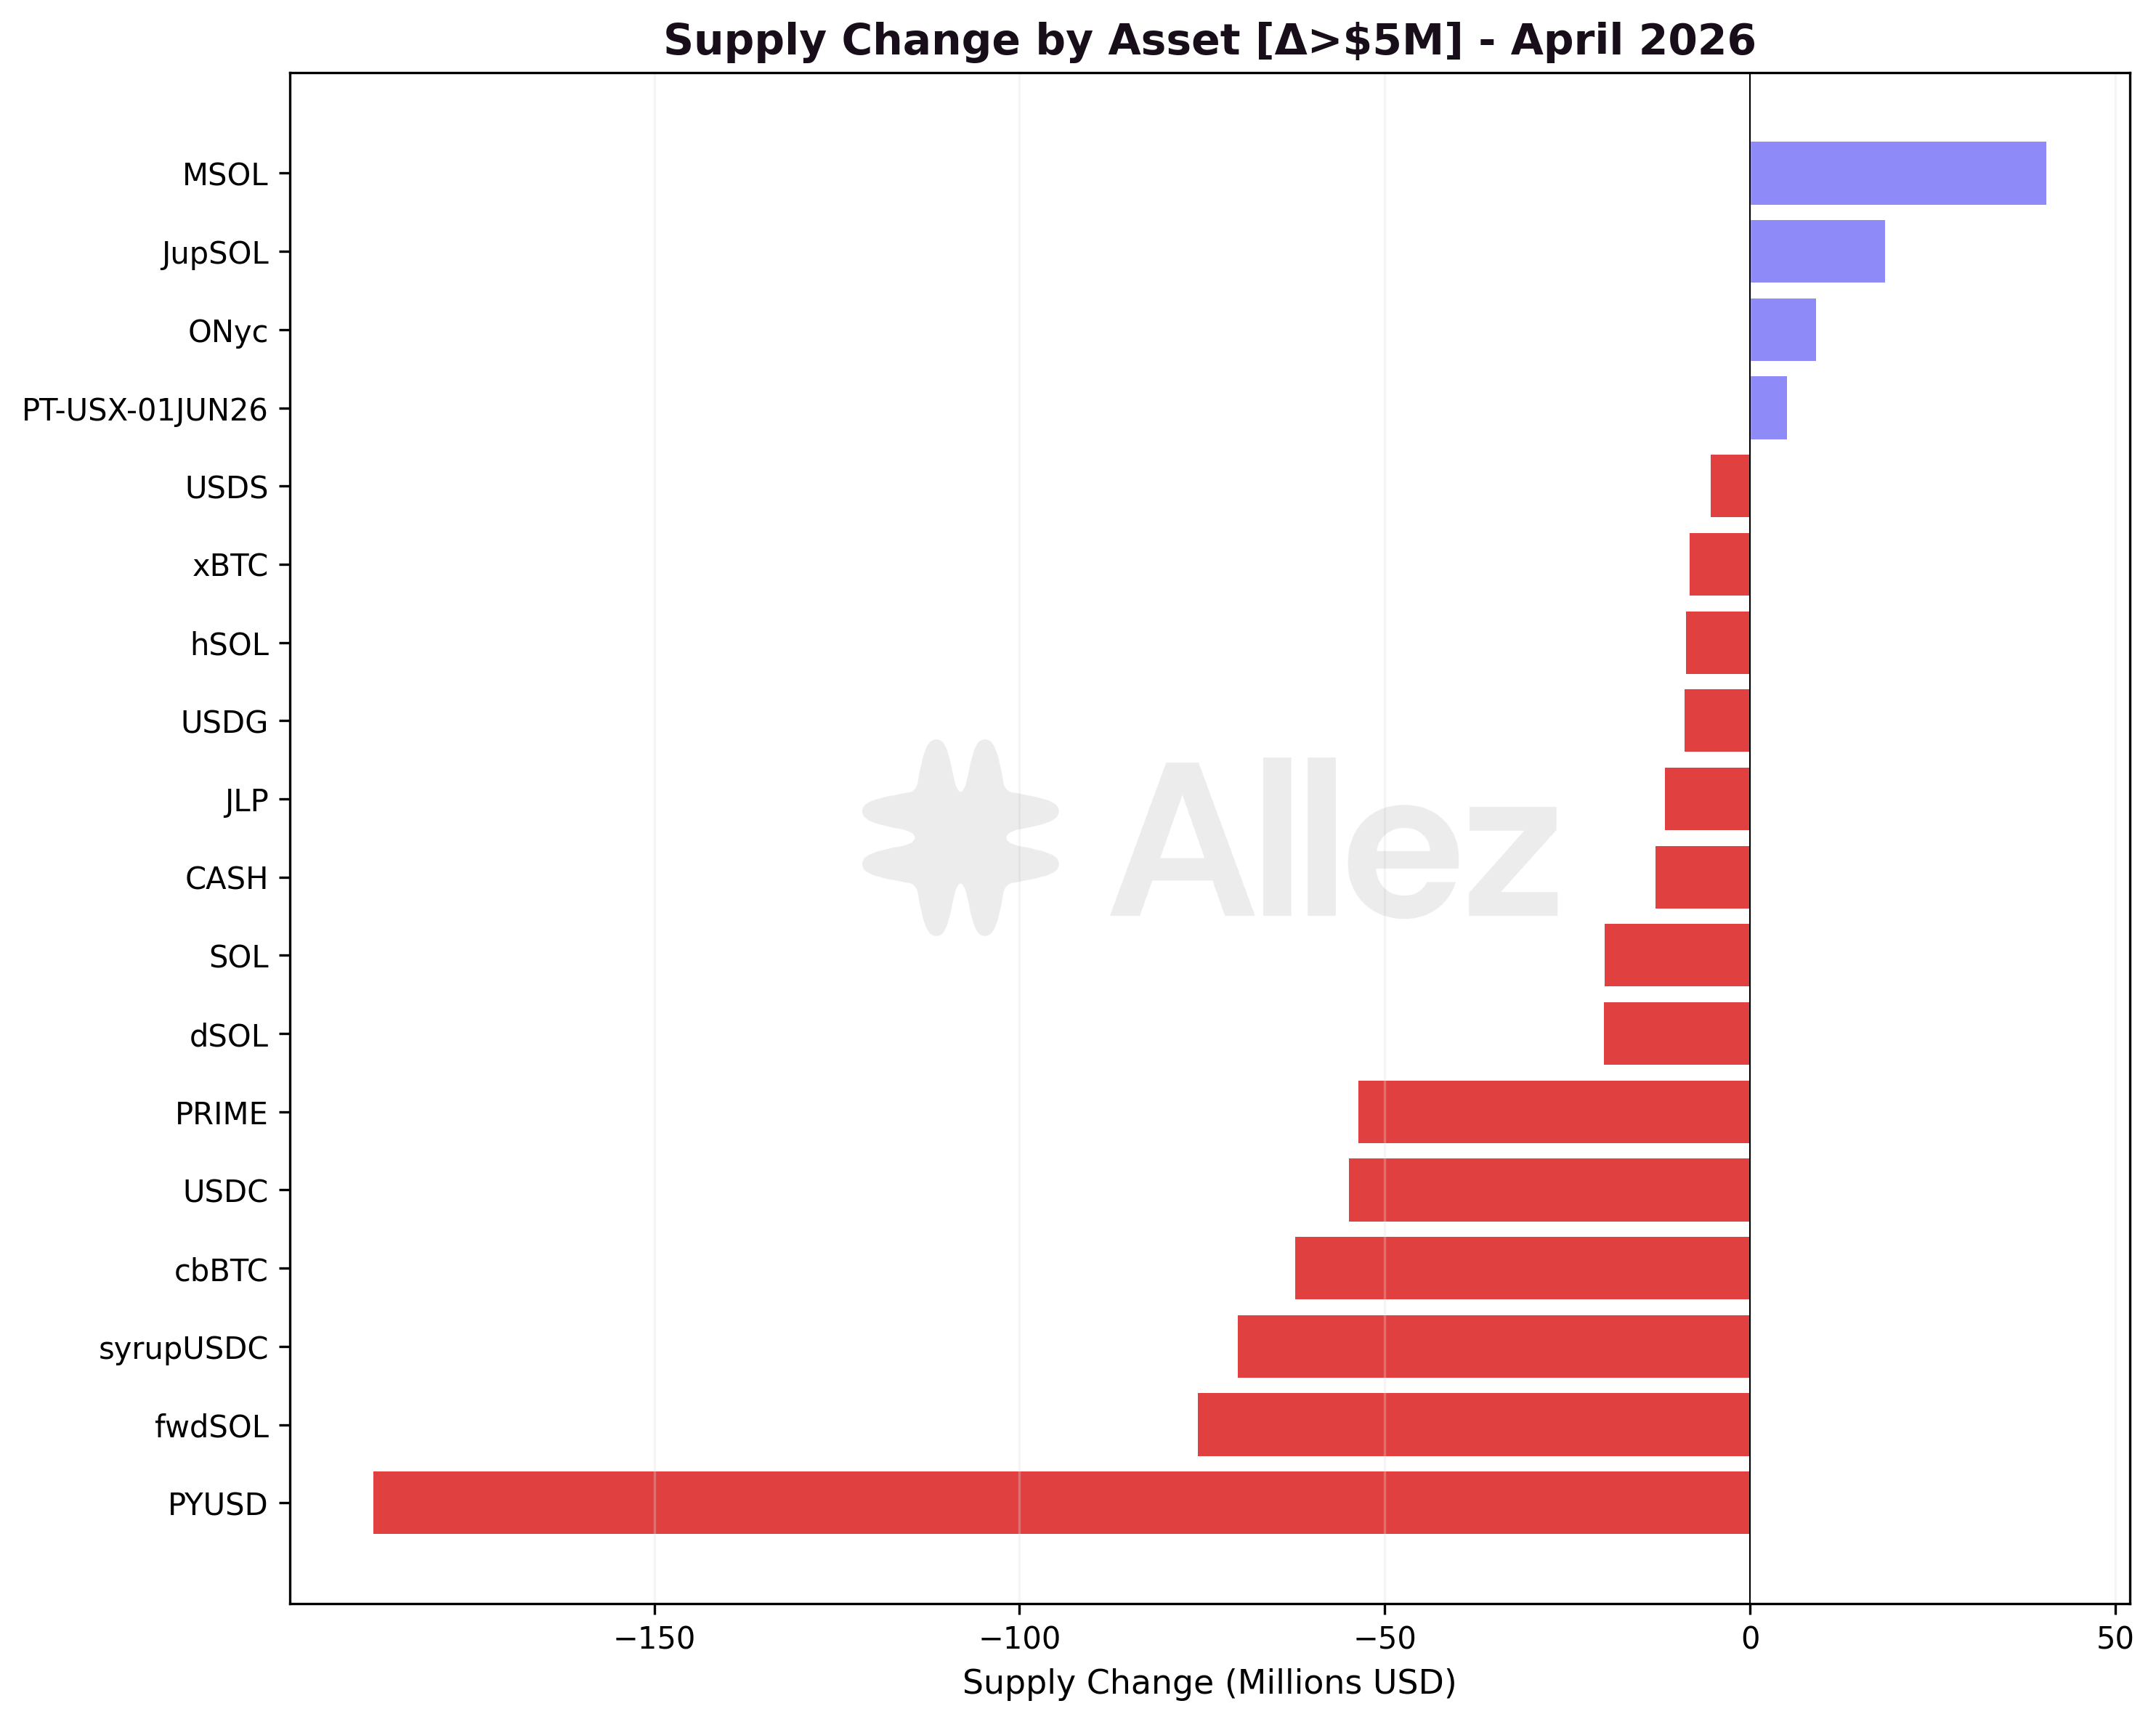
Major Inflows:
-
mSOL: +$41M supply - LST rotation toward mSOL
-
JupSOL: +$19M supply - LST rotation toward JupSOL
-
ONyc: +$8M supply - OnRe ramp continued
-
eUSX: +$5M supply - RWA accumulation
-
PT-USX-01JUN26: +$5M supply - New Pendle PT listing
Major Outflows:
-
PYUSD: -$200M supply - Continued from March, and reinforced by Maple's April 20 DeFi exposure reduction
-
fwdSOL: -$76M supply - LST contraction
-
syrupUSDC: -$70M supply - Maple credit market reduction (Maple's public DeFi exit)
-
cbBTC: -$62M supply - 816 BTC withdrawn, this is the second consecutive monthly outflow
-
USDC: -$54M supply - Withdrawals concentrated in the curated USDC vault layer (Steakhouse USDC -$36M, Allez USDC -$11M, Elemental USDC Optimizer -$6M)
-
PRIME: -$53M supply - Institutional position reduction
-
SOL: -$20M supply - SOL deposit reduction
-
dSOL: -$20M supply - LST deleveraging
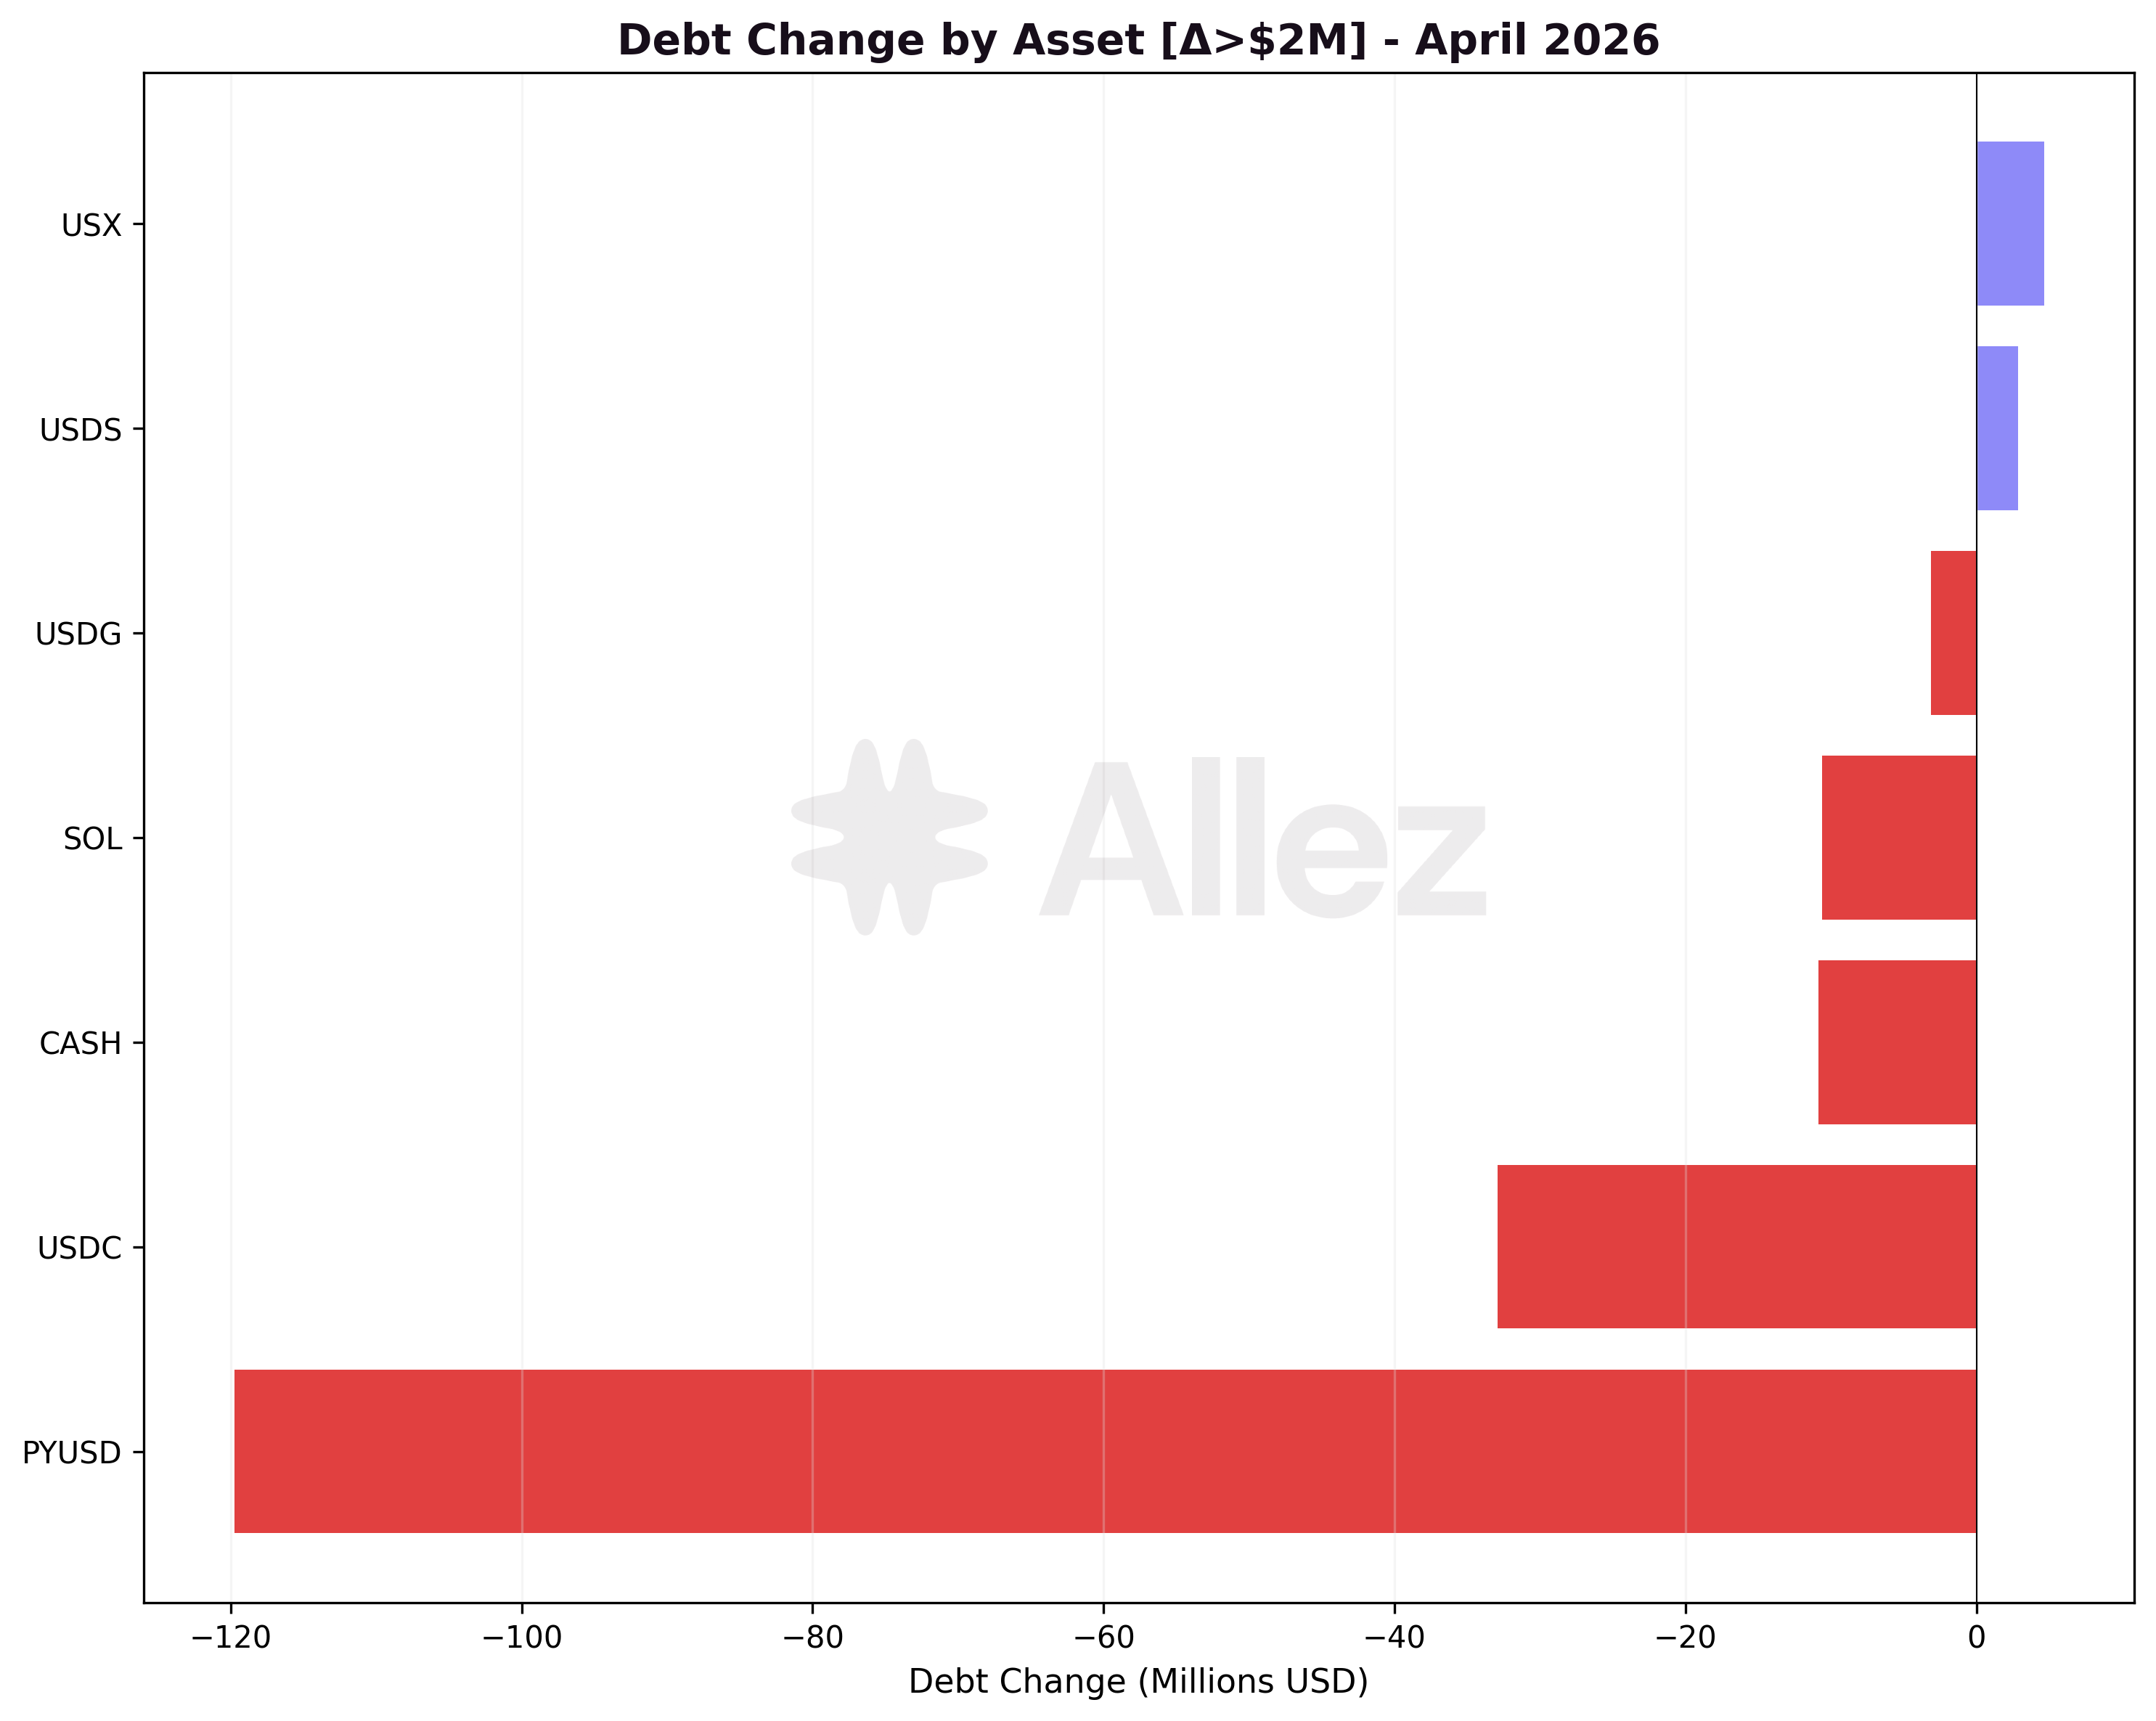
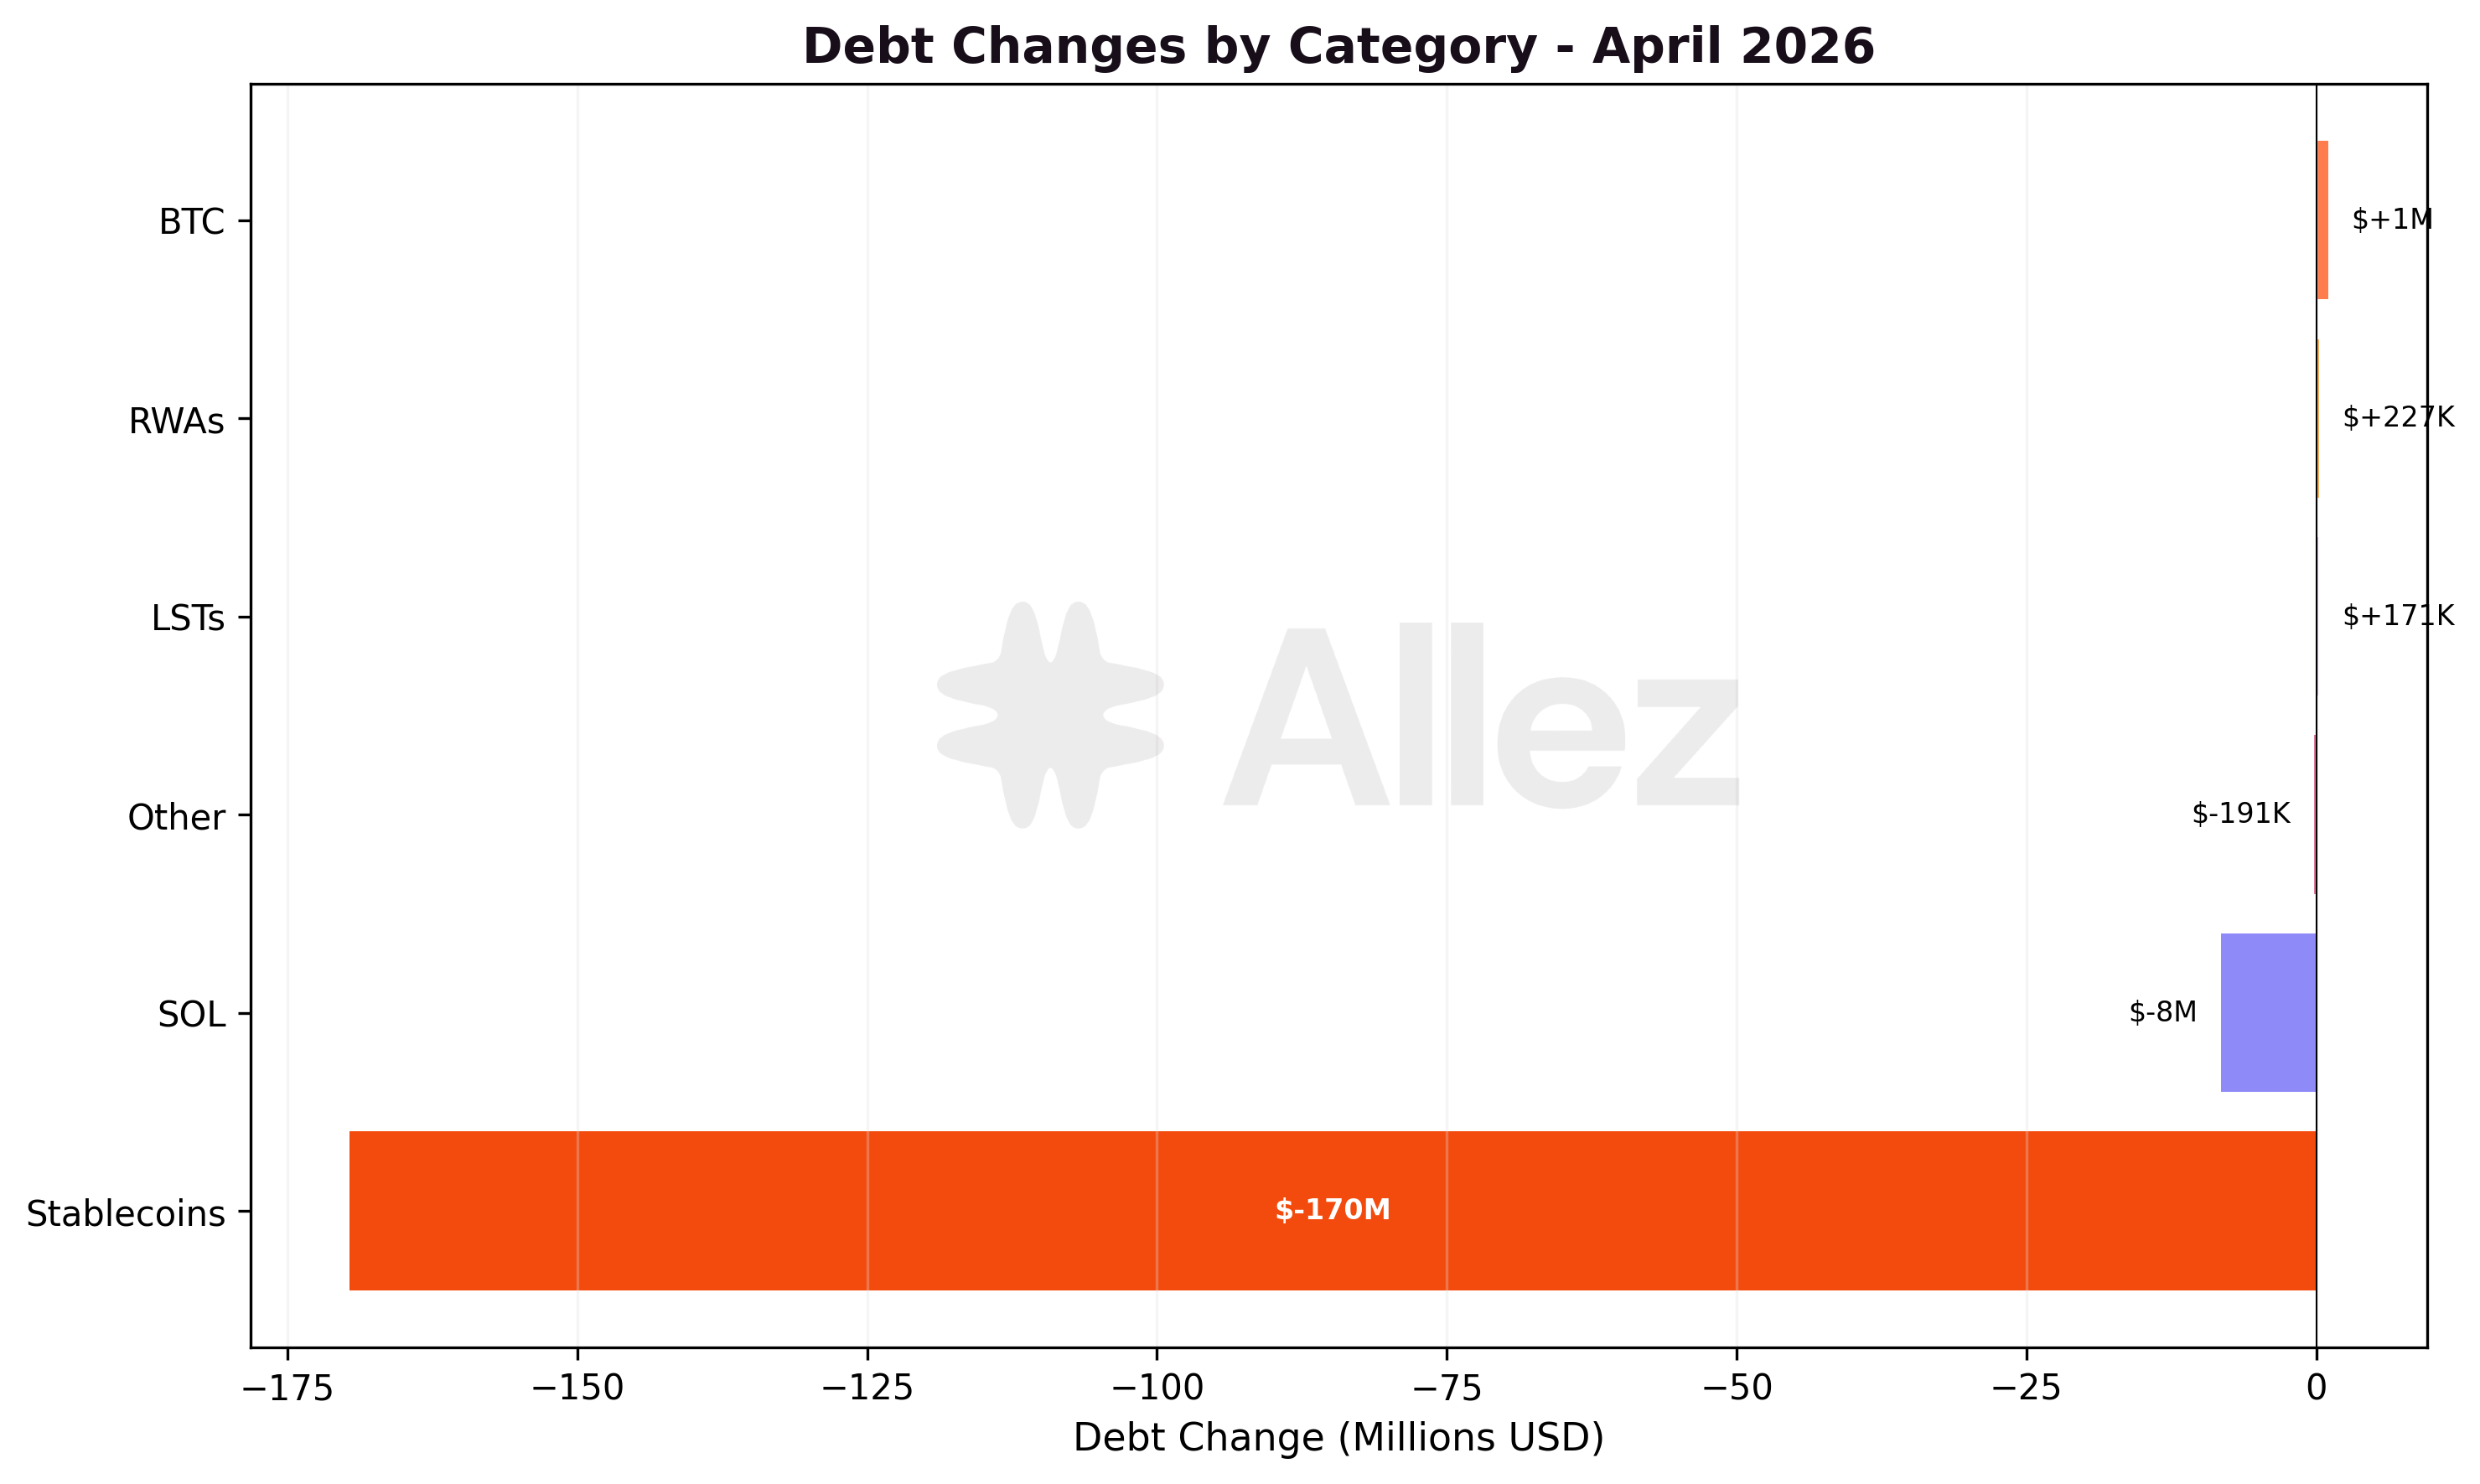
The largest debt change was PYUSD -$120M, mirroring the supply move and indicating that the rotation involved closing leveraged positions, not just repositioning collateral. USDC borrows fell -$33M and CASH borrows -$11M.
3. Risk & Liquidations
Distance to Liquidation: Correlated vs Uncorrelated Positions
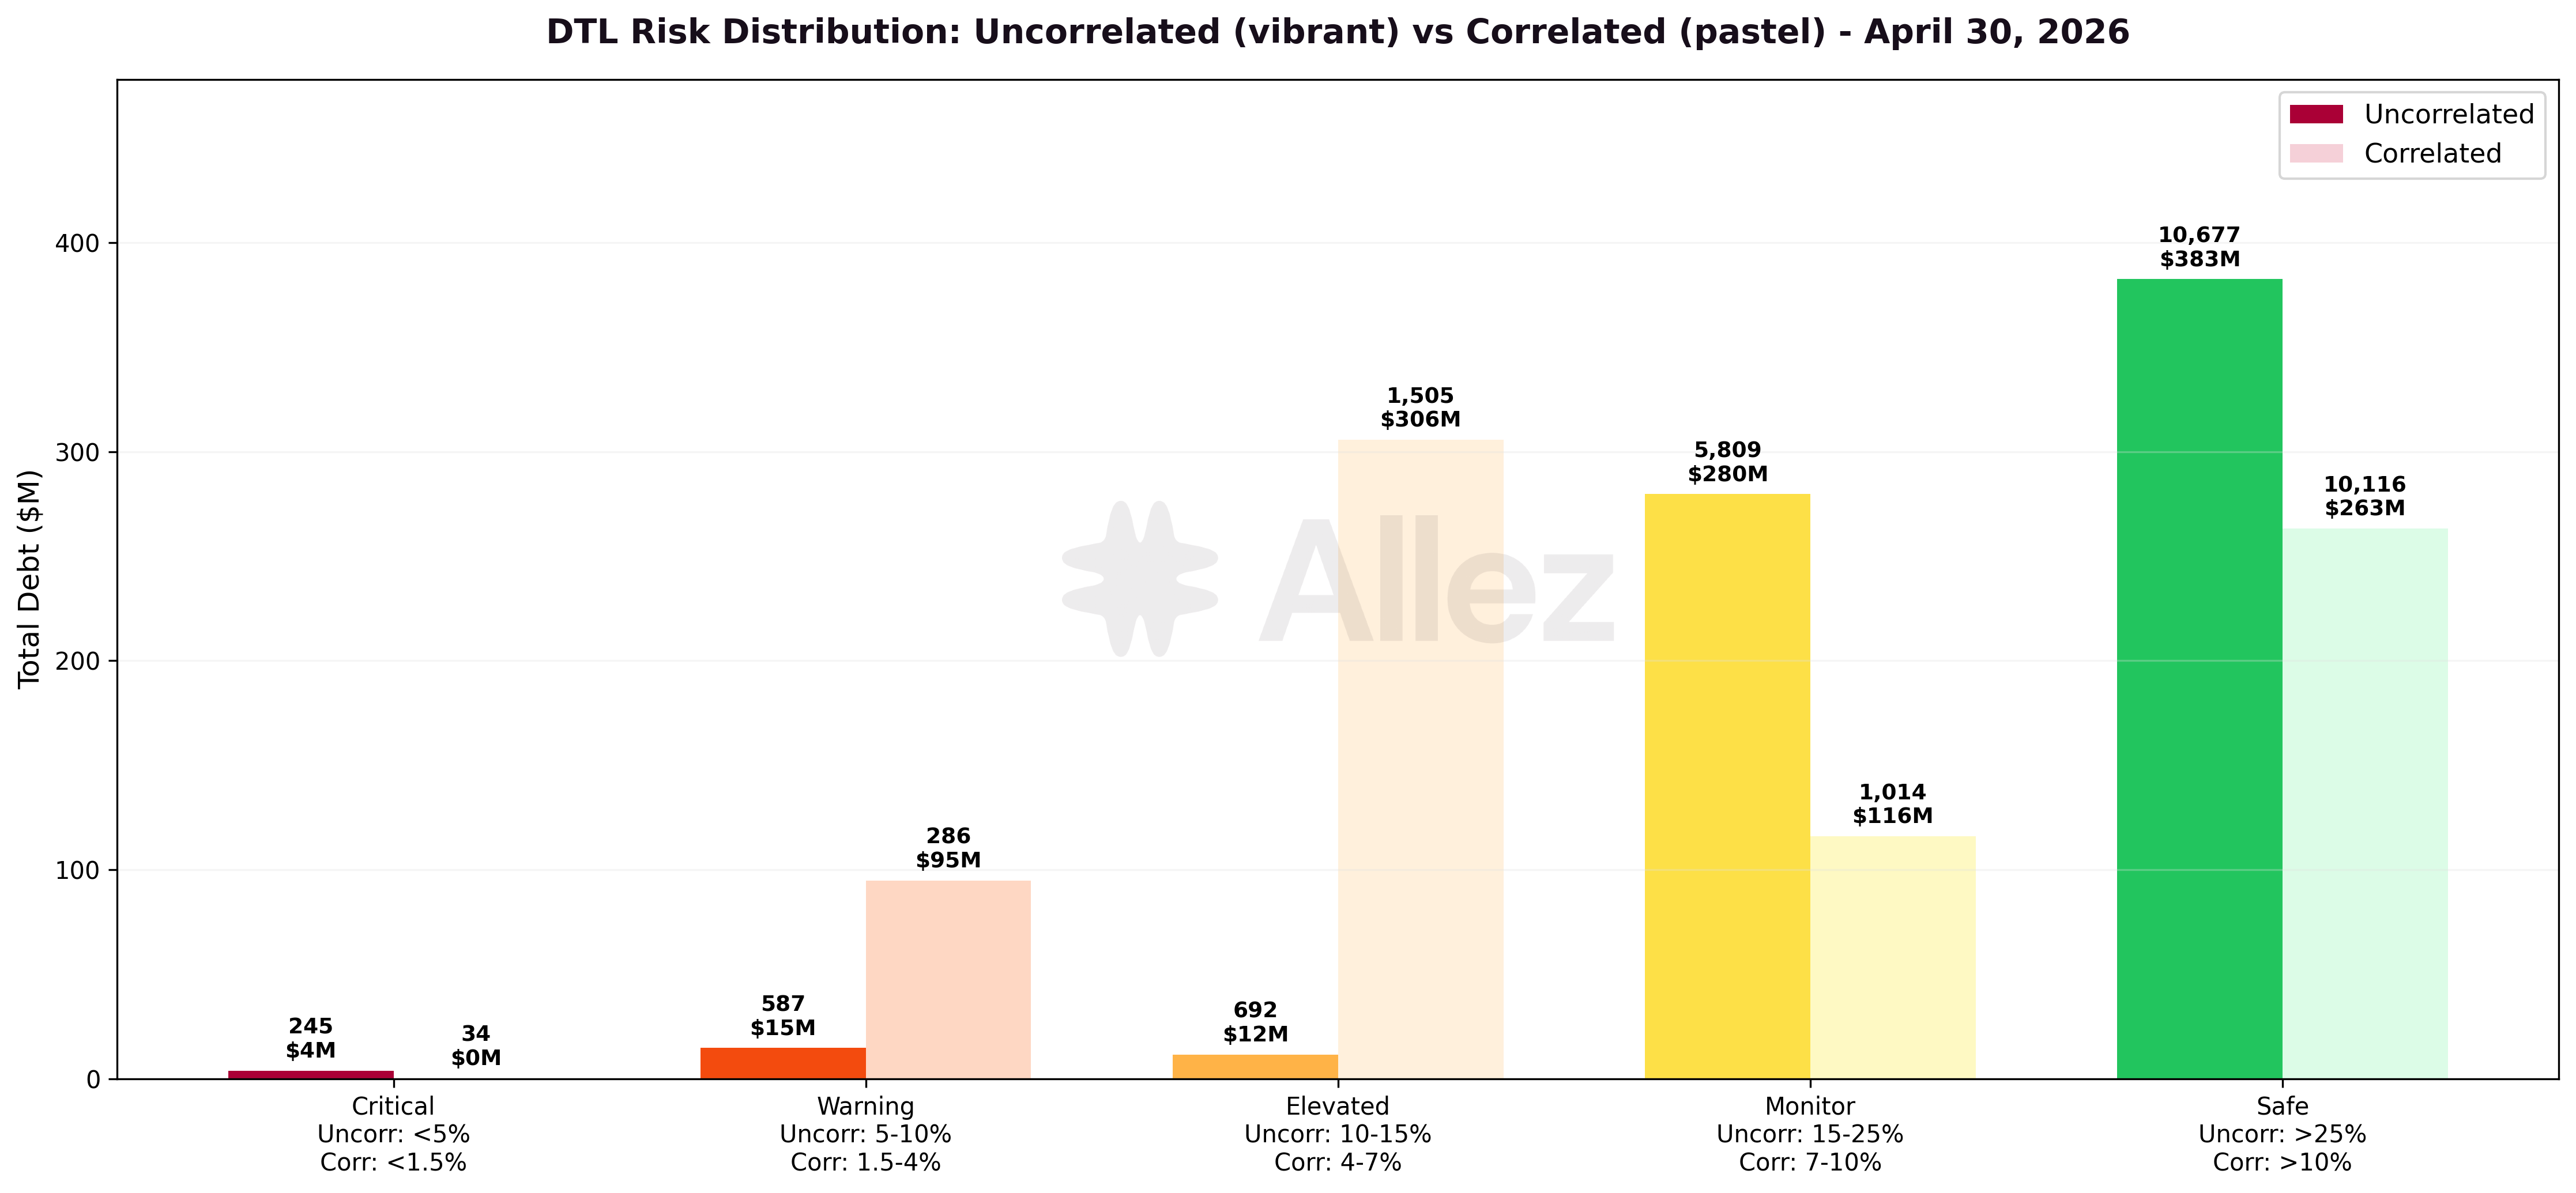
Uncorrelated positions (SOL/USDC, BTC/USDC, JLP/USDC):
| Risk Tier | DTL Range | Debt Volume | Share | March Debt | MoM |
|---|---|---|---|---|---|
| Critical | <5% | $3.8M | 0.6% | $1.6M | +139% |
| Warning | 5-10% | $14.7M | 2.1% | $16.0M | -8% |
| Elevated | 10-15% | $11.5M | 1.7% | $27.5M | -58% |
| Monitor | 15-25% | $279.6M | 40.4% | $132.6M | +111% |
| Safe | >25% | $382.5M | 55.3% | $491.5M | -22% |
Correlated positions (LST/SOL, RWA/stablecoin, stablecoin/stablecoin):
| Risk Tier | DTL Range | Debt Volume | Share | Mar Debt | MoM |
|---|---|---|---|---|---|
| Critical | <1.5% | $0.2M | 0.0% | $0.2M | flat |
| Warning | 1.5-4% | $94.8M | 12.2% | $178.0M | -47% |
| Elevated | 4-7% | $305.7M | 39.2% | $341.7M | -11% |
| Monitor | 7-10% | $116.0M | 14.9% | $116.8M | -1% |
| Safe | >10% | $263.3M | 33.8% | $276.4M | -5% |
The risk profile is healthier than March on the correlated side: Warning-tier debt fell -47% ($178M to $95M), Elevated -11%, and Critical remained near zero. On the uncorrelated side the picture is mixed: Critical-tier debt grew from $1.6M to $3.8M (still <0.6% of total uncorrelated debt), distributed across many small SOL/BTC long positions rather than concentrated in any single user. Warning fell -8%, and the largest shift was a redistribution from the Safe tier (>25% DTL) into the Monitor tier (15-25% DTL), consistent with low-leverage uncorrelated positions exiting (BTC and SOL withdrawals) and leaving the remaining pool at modestly tighter average distance-to-liquidation.
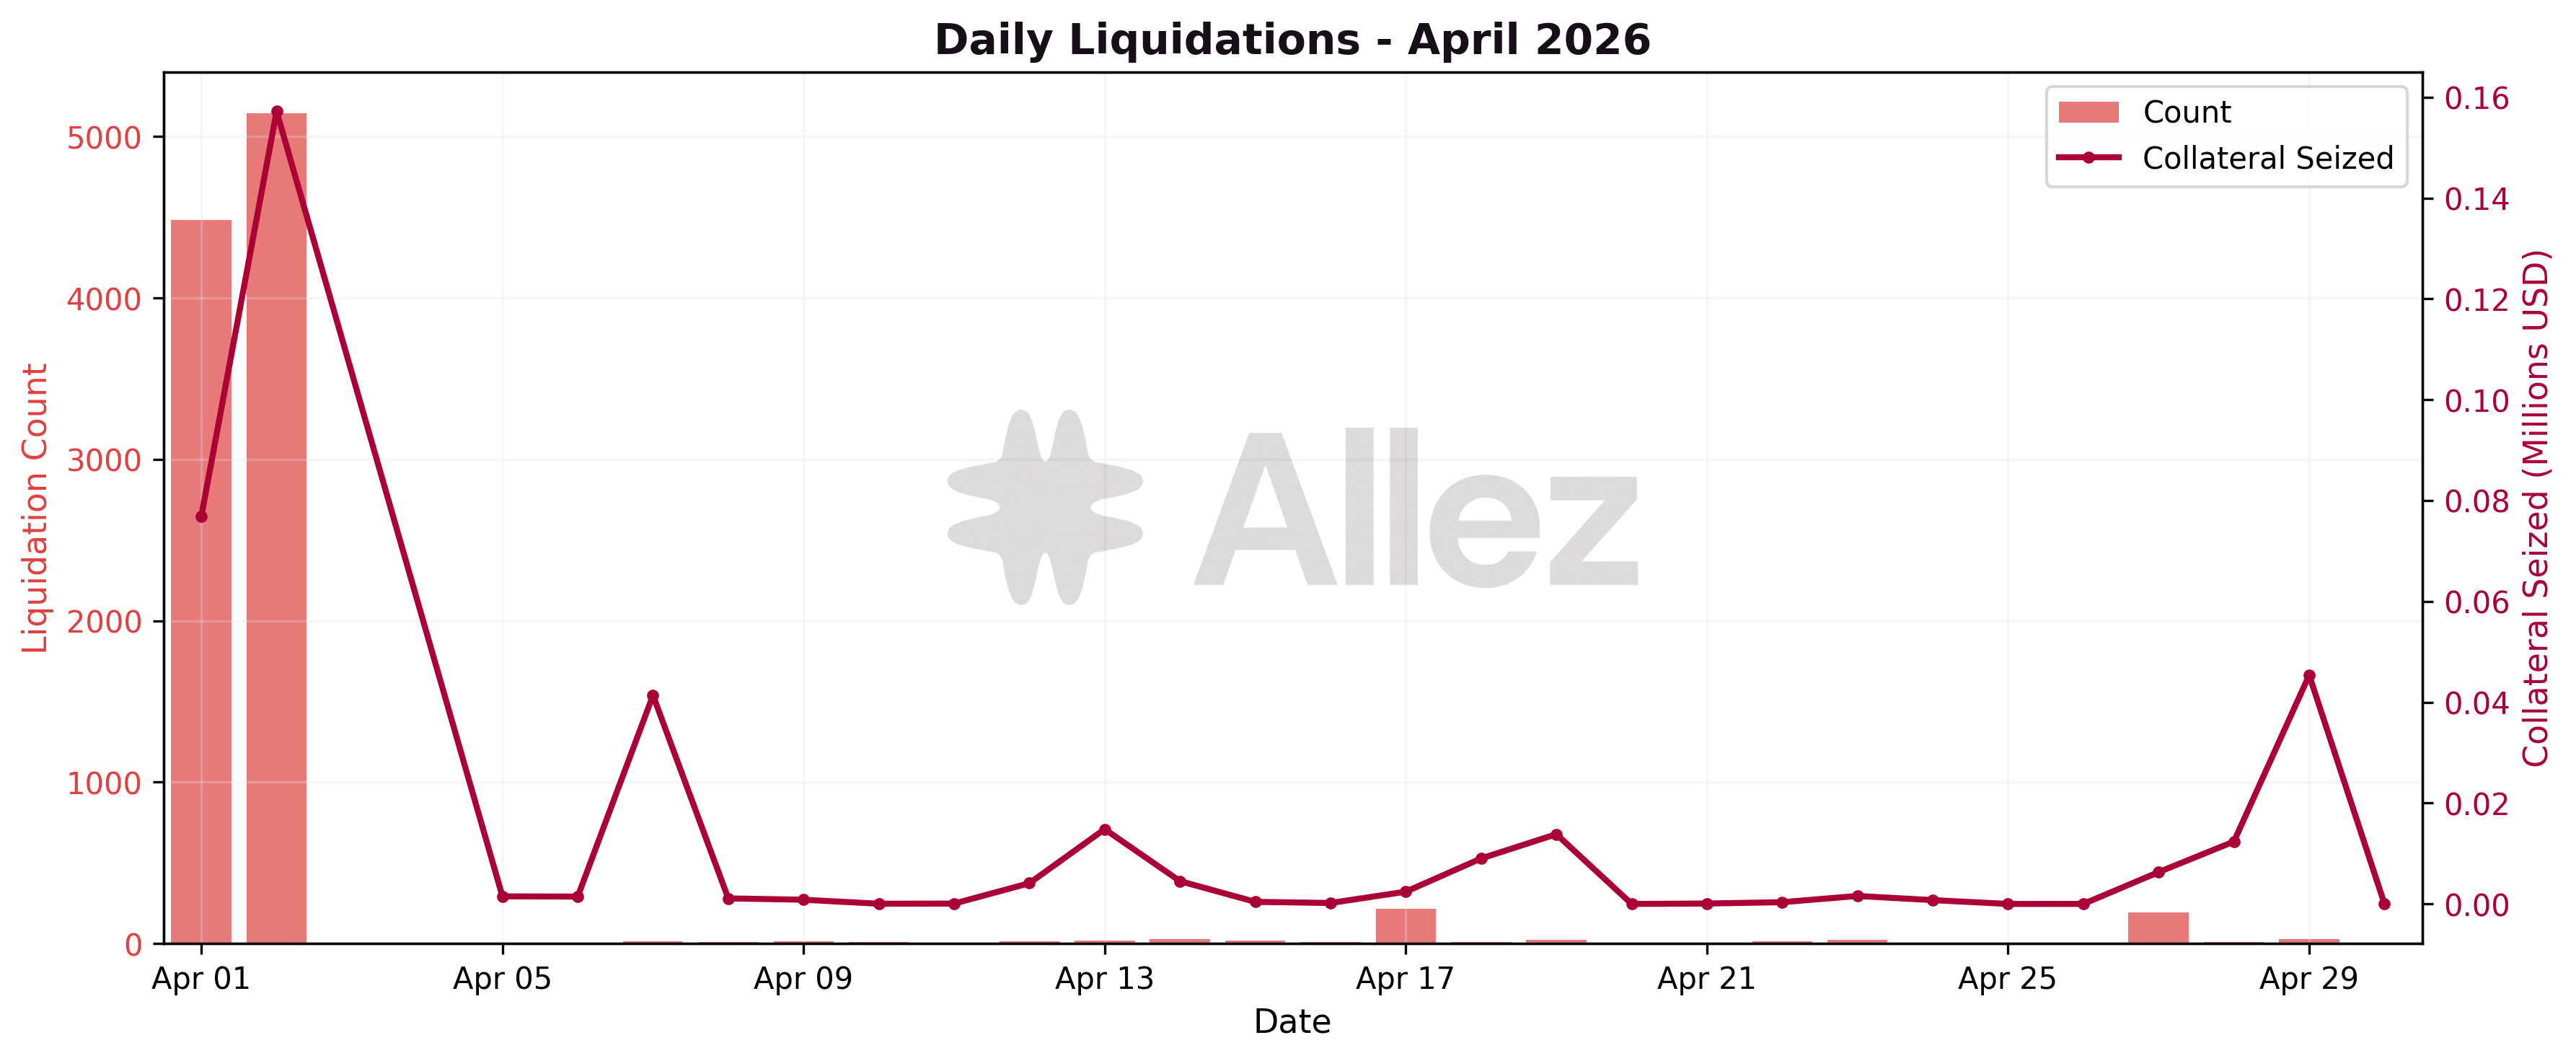
Liquidation summary:
| Metric | April | March | MoM Change |
|---|---|---|---|
| Total events | 10,311 | 551 | +1,772% |
| Collateral seized | $0.40M | $0.61M | -35% |
| Debt repaid | $0.39M | $0.60M | -35% |
| Avg liquidation size | $38 | $1,104 | -97% |
On April 1-2, automated liquidators executed 9,628 liquidations totalling $234K in collateral seized over a 48-hour window. The cascade decomposed as:
-
9,609 sub-$1K micro-liquidations ($53K aggregate, ~$6 average) on UXD/USDC and similar correlated stablecoin-pair positions, triggered by the UXD price compression.
-
15 medium liquidations ($1K-10K bucket, $44K) spanning UXD pairs and other stablecoin positions.
-
4 large SOL/USDC and JLP/USDC liquidations ($137K) triggered by the simultaneous SOL drop to $77.
Excluding the April 1-2 cascade, April recorded 683 liquidations and $163K in collateral seized, the second-quietest month on record. Average size for the meaningful (post-cascade) subset was $238, well below March's $1,104. These 683 post-cascade events came from ~335 distinct obligations (~2 events per position on average), a much milder splitting pattern than the cascade's ~11x ratio - the lower average size primarily reflects smaller underlying positions in normal market conditions, with some bot-driven splitting on top.
Liquidation Infrastructure Stress: UXD depeg
On April 1, between 10:00 and 13:00 UTC, UXD market price compressed from a ~1.7% premium versus USDC ($1.0166) down to near peg ($1.0029) over a 3-hour window. UXD did not trade below $1, but the relative -1.4% move versus USDC was sufficient to cross the tight margin between LTV & liquidation threshold across the protocol. The compression preceded the Drift exploit (~16:05 UTC) by approximately 3 hours. The price stayed compressed near $1.002-$1.005 through April 2, with most positions repaired or liquidated by the time the market normalised on April 3.
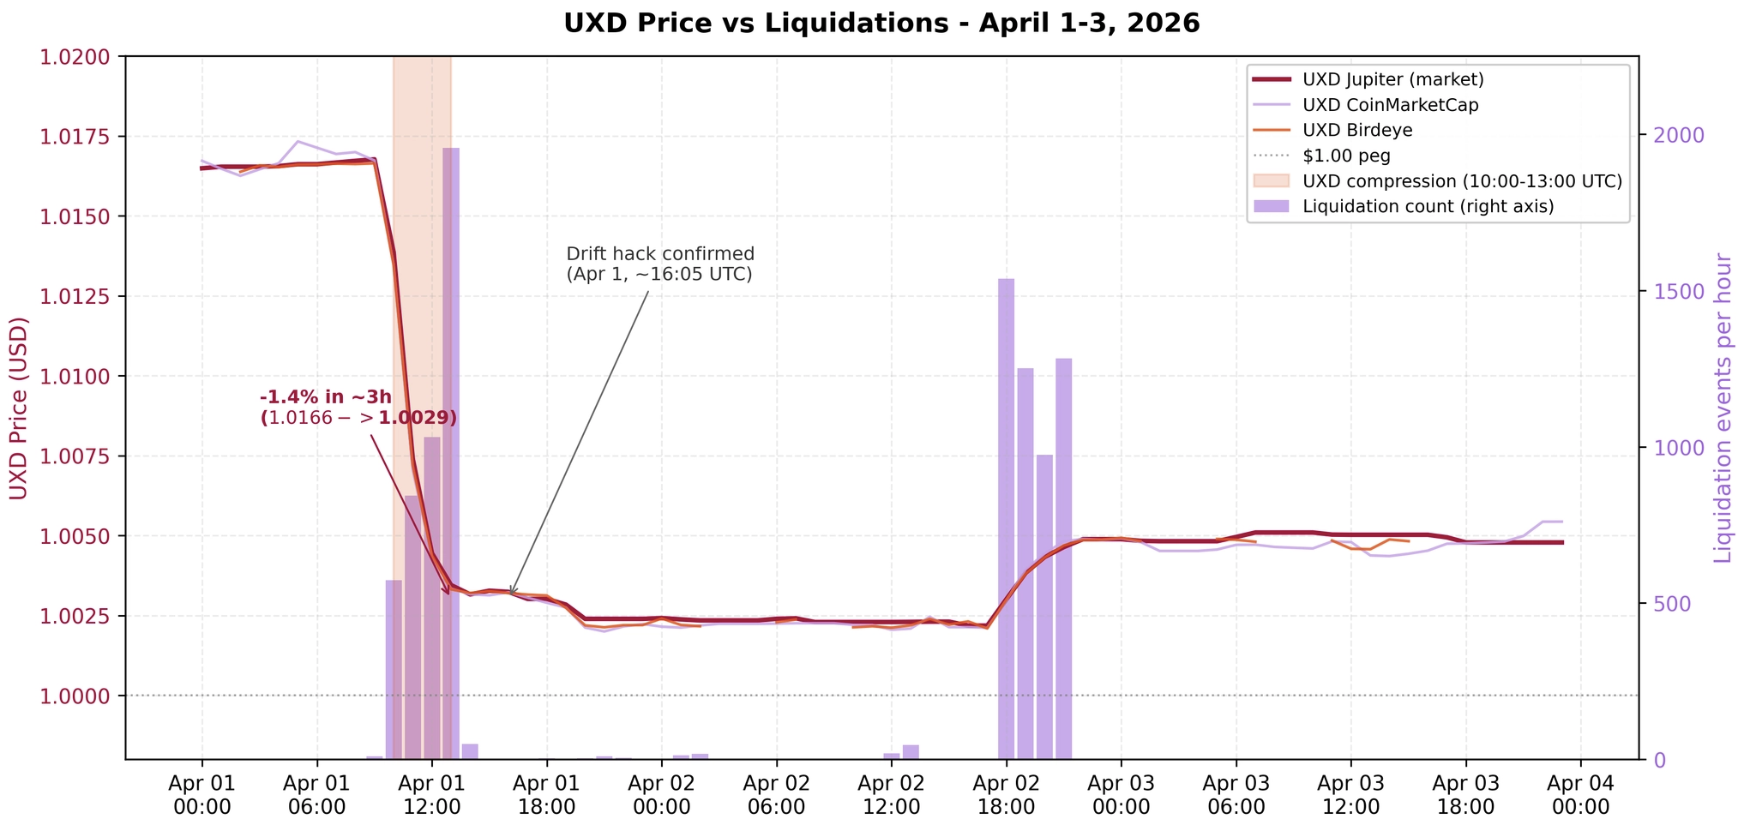
The liquidation infrastructure limited user losses: 9,628 events in 48 hours, $234K aggregate collateral seized. The dominant pattern (9,609 sub-$1K UXD-pair micro-liquidations, ~$6 average) reflects the tight distance to liquidation of leverage traders - the average liquidation bonus across the cascade was 0.36% of debt repaid (median 0.43%), and the bonus represented a median 0.028% of the user's total position size, meaning liquidated users retained ~99.97% of their position after the partial liquidation. This is as expected for a -1.4% relative move on positions sized against a <1.5% Critical threshold.
UXD-paired micro-liquidations dominated the event count: pure stablecoin cross-pair events (UXD↔USDC and UXD↔USDT) made up 70% of events for only 14% of the dollar volume, while the remaining UXD↔SOL/LST events added another 28% of events for ~3% of dollar volume. The 9,628 events came from only 898 distinct obligations (~11 events per position on average): the same positions were liquidated in dozens of tiny chunks rather than a wide blast of small positions crossing the threshold once. The 4 large SOL/USDC and JLP/USDC liquidations ($137K) ran concurrently as the SOL drop to $77 stressed leveraged positions, accounting for the bulk of the dollar volume despite being only 1% of the event count. The protocol absorbed all of it.
April Liquidations by Collateral Type:
By collateral, SOL dominated total April liquidation volume at $275K seized (69% of the $0.40M total), with JLP at $34K (9%), UXD at $27K (7%), cbBTC at $16K (4%), and USDS at $15K (4%). Four large SOL/USDC liquidations during the April 1-2 SOL drop accounted for most of the SOL volume, with 3 additional $10K+ SOL/USDC events distributed through the month. The 4,461 UXD-collateral events averaged $6 each, consistent with the micro-liquidation pattern.
Liquidation Volume by Size:
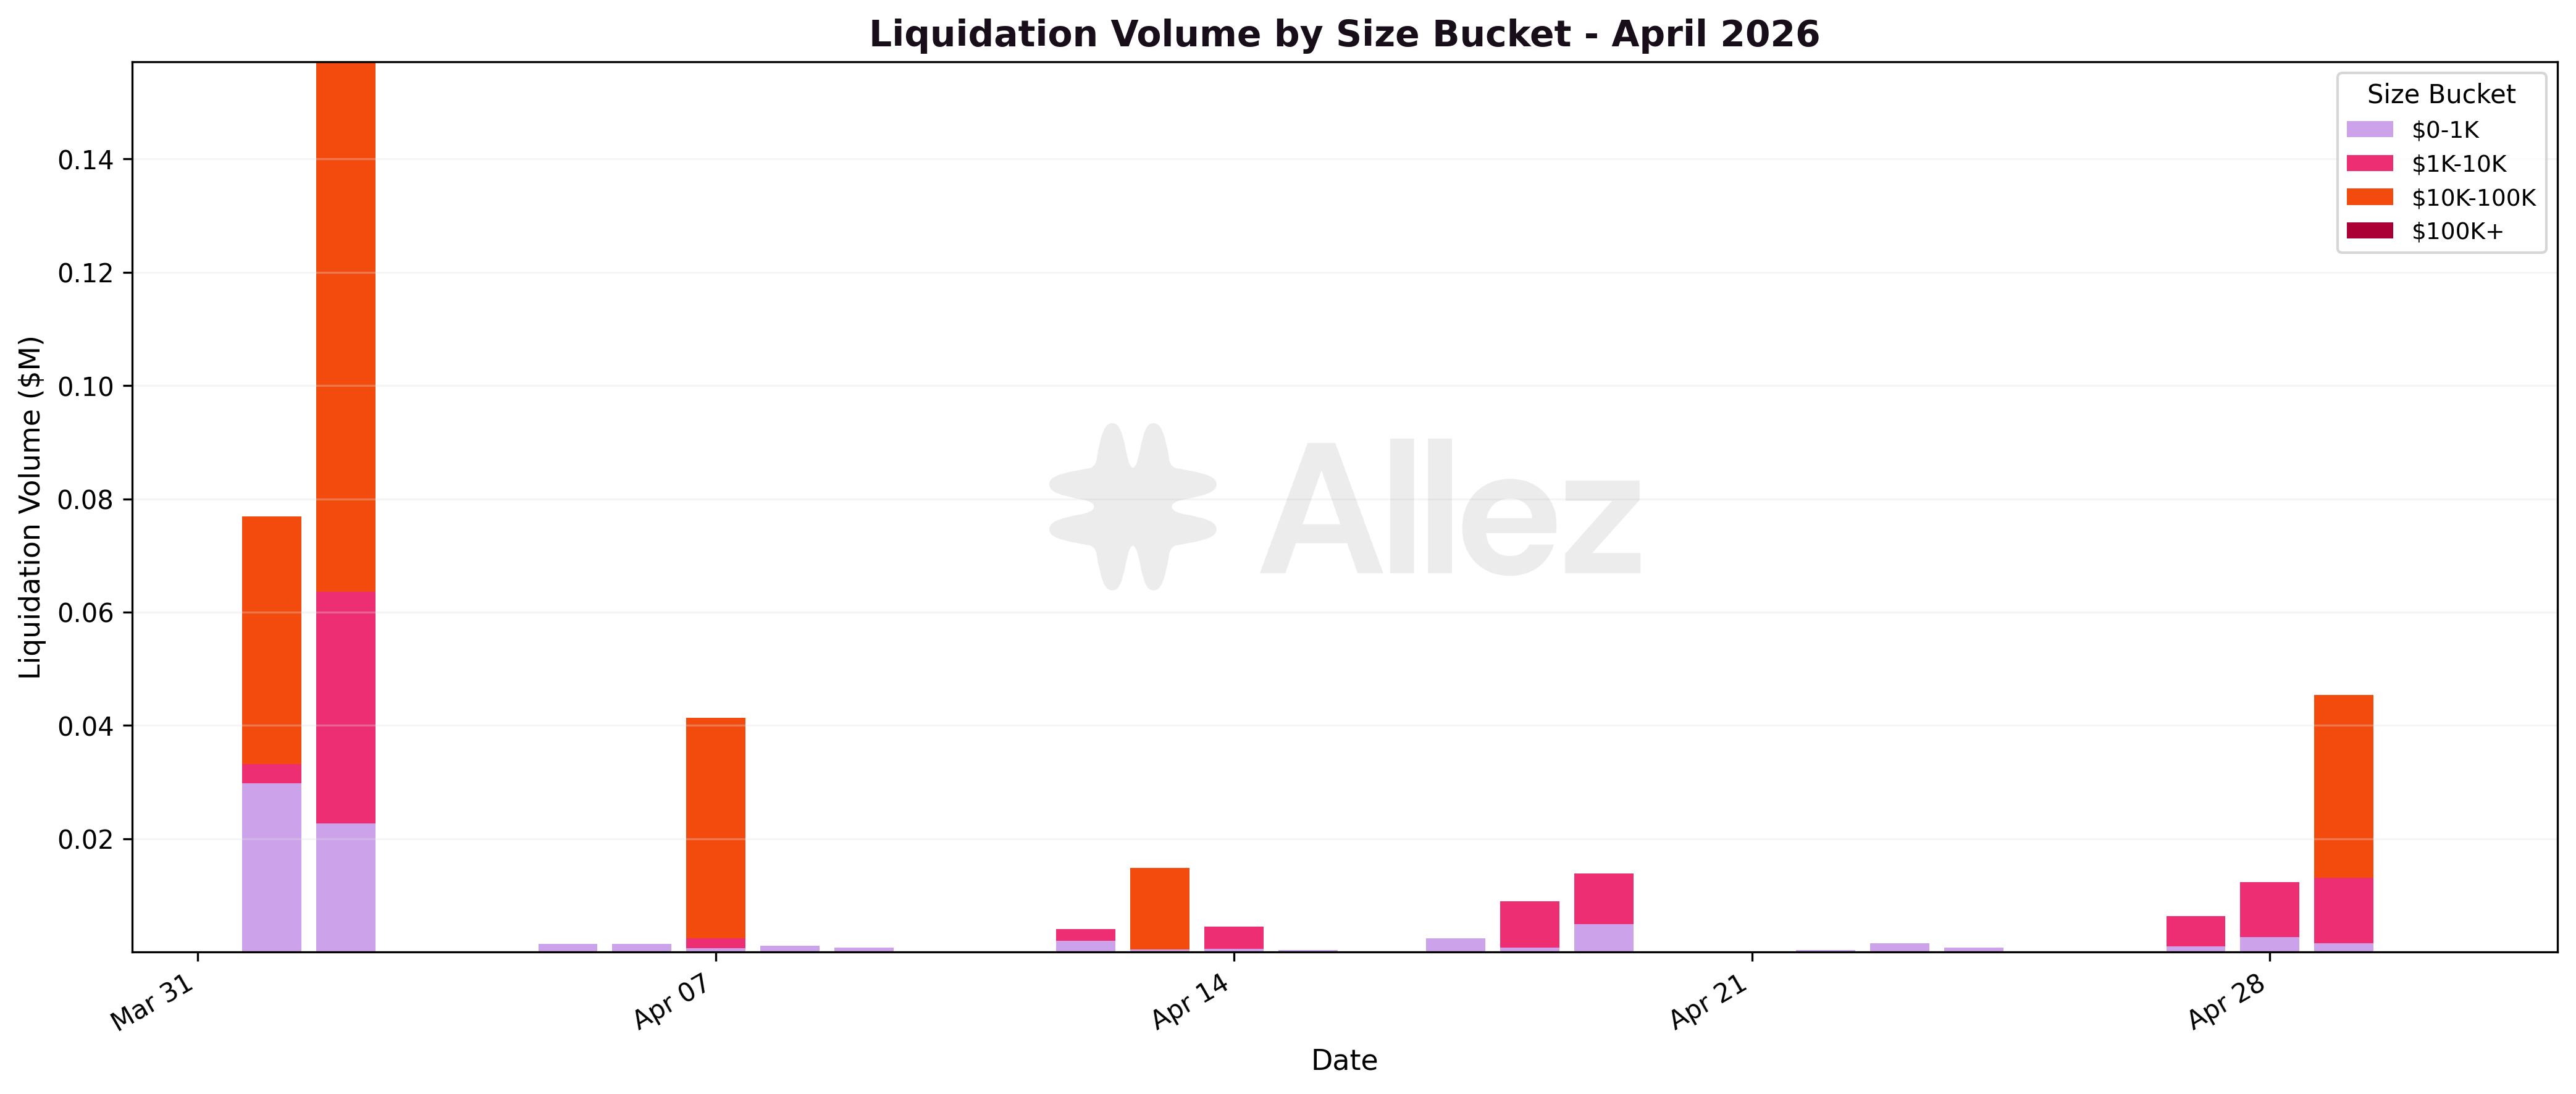
| Size Bucket | Events | Volume | Share |
|---|---|---|---|
| $10K-100K | 7 | $223K | 56% |
| $1K-10K | 30 | $96K | 24% |
| $0-1K | 10,274 | $78K | 20% |
No $100K+ liquidations occurred in April. The $10K-100K bucket carried over half the dollar volume from just 7 events - 4 of which fell during the April 1-2 cascade window and 3 were distributed across the rest of the month. The sub-$1K bucket represented 99.6% of all events but only 20% of volume, dominated by the UXD micro-liquidation cascade (9,609 of the 10,277 sub-$1K events).
Stress Testing:
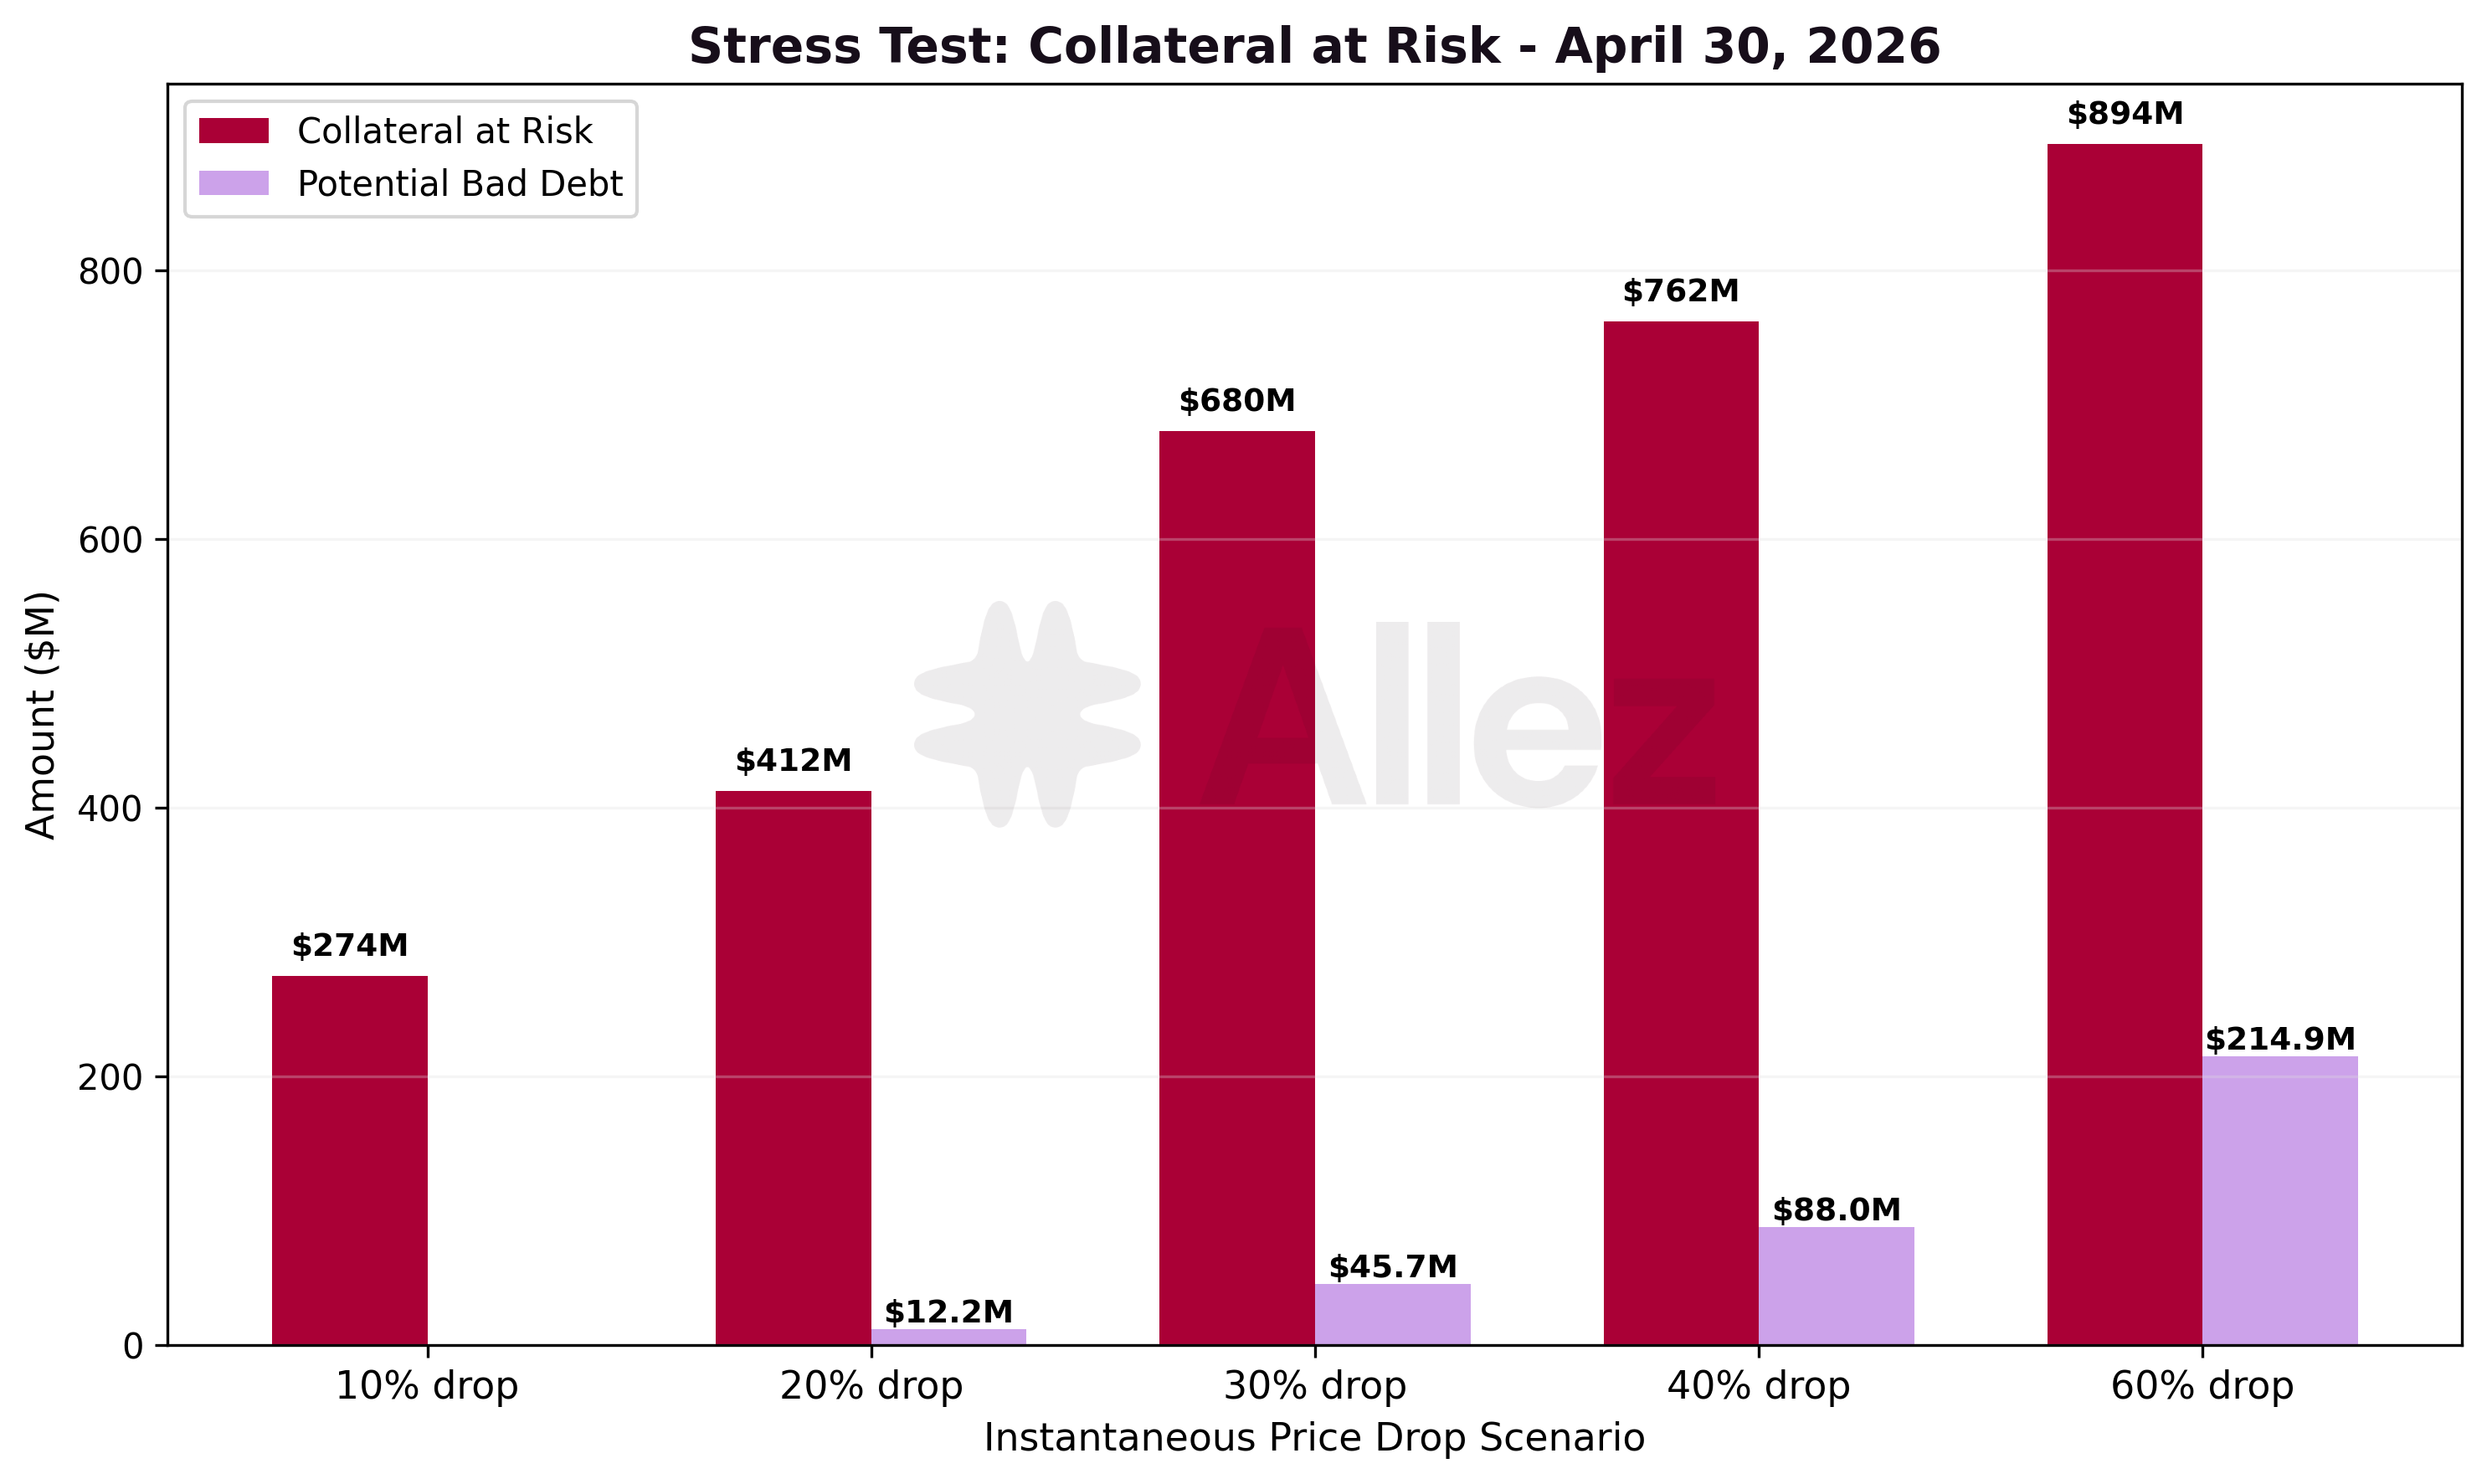
Stress test scenarios (instantaneous shock, April 30):
| Scenario | Collateral at Risk | Potential Bad Debt | Positions Liquidated | MoM |
|---|---|---|---|---|
| 10% drop | $275M | $0M | 578 | -36% |
| 20% drop | $412M | $12.2M | 5,114 | -26% |
| 30% drop | $680M | $45.7M | 9,157 | -22% |
| 40% drop | $762M | $88.0M | 11,447 | -18% |
| 60% drop | $894M | $214.9M | 13,501 | -17% |
At a 10% drop, $275M of collateral would be at risk with zero theoretical bad debt. At deeper shocks collateral at risk grows steadily as more positions cross their liquidation thresholds, reaching $894M at -60%. Theoretical bad debt remains well below collateral at risk at every scenario: even in the worst 60% instant drop, scenario collateral covers 76% of debt, leaving $215M of theoretical bad debt on $894M of liquidatable positions.
The 30% scenario carries the largest single-step jump in collateral at risk ($412M to $680M), driven primarily by PRIME-collateralized positions clustering near their liquidation threshold. Positions collateralized by PRIME carry $182M of borrowed debt (mostly stablecoins) at LTV ≥80% against PRIME's 91% liquidation threshold, creating a structural cliff at moderate price shocks. Positions collateralized by syrupUSDC sit further from threshold (mostly at 70-80% LTV against a 90% LT, only ~$5M at 80%+), absorbing moderate shocks but joining the cliff at deeper drawdowns.
Versus March, risk profile contracted (-17% to -36%) across all scenarios, proportional to the protocol's -16.9% supply contraction. The deepest contraction (-36%) is at the -10% scenario, driven by the exit of high-LTV institutional positions in Maple Market (PYUSD and syrupUSDC borrowing at 80%+ LTV) which were concentrated in the shallow-scenario at-risk pool. The -60% scenario saw a similar absolute reduction but on a larger base, hence the smaller percentage contraction (-17%). The RWA-driven cliff persisted in shape but contracted -22% in magnitude at the 30% scenario.
4. Per-Market Micro Analysis
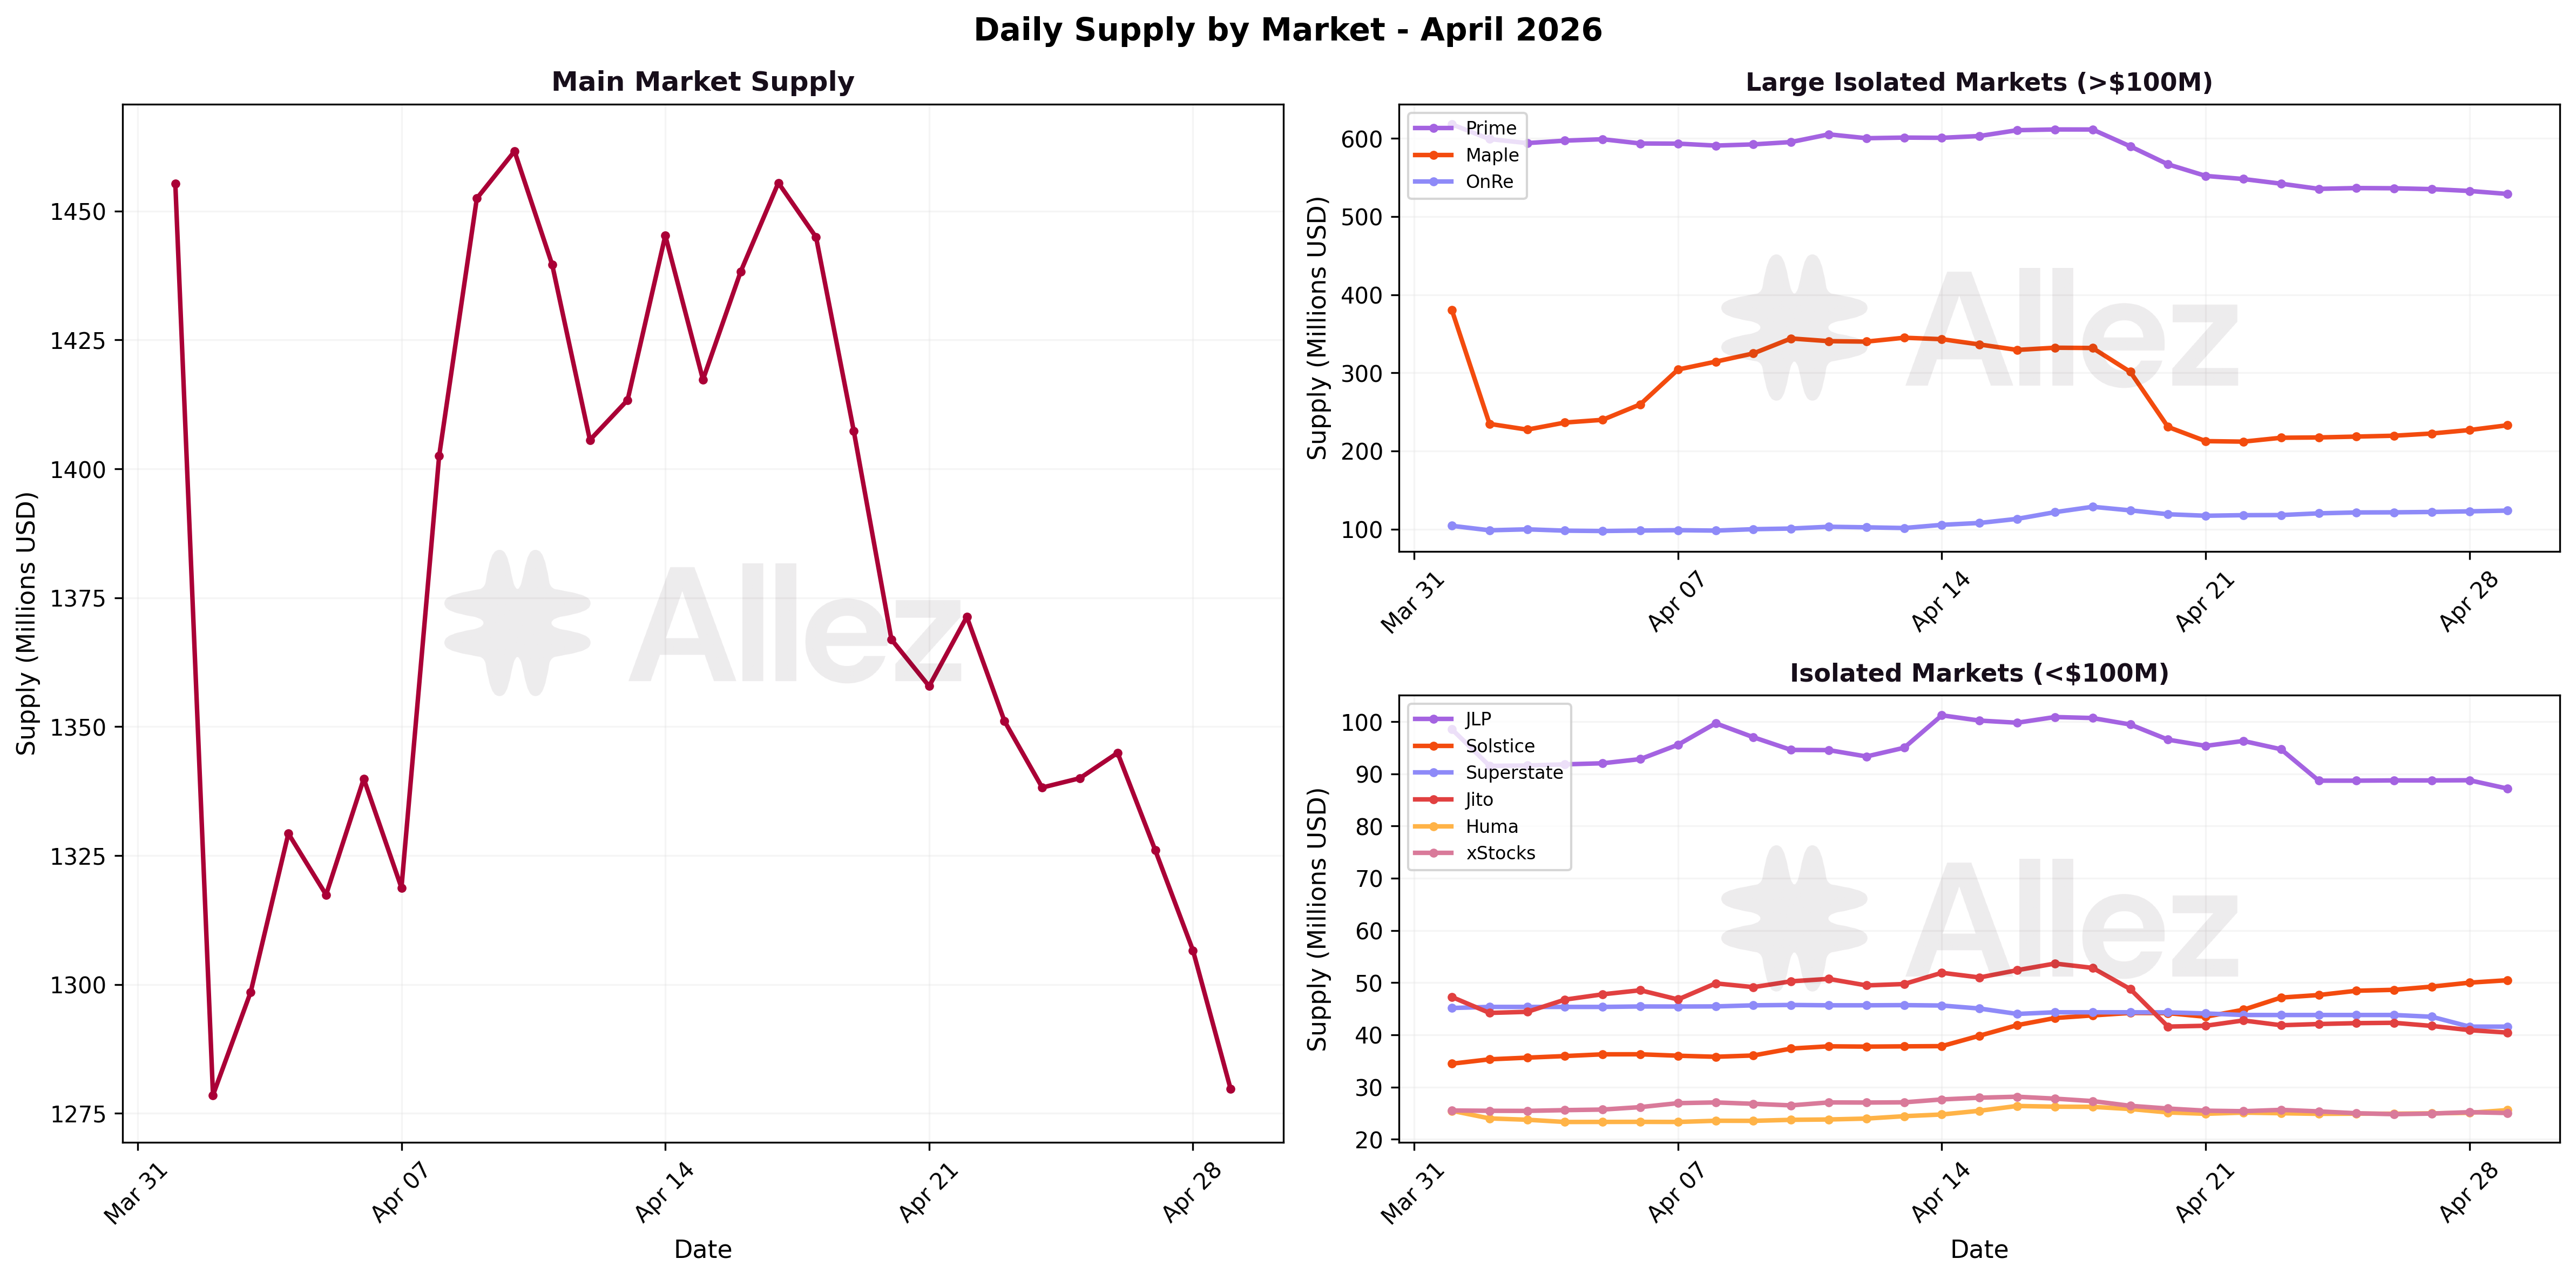
Kamino markets contracted in April, with Maple posting the sharpest decline (-43.1% to $232M) following Maple Finance's public April 20 DeFi risk off announcement. Countertrend, Solstice continued to scale (+51.4% to $51M), and OnRe added another +15.5% to cross $120M.
**Maple Market withdrawal cluster analysis **(April 18-22): On-chain transaction data isolates the source of the Maple Market contraction. Three wallets accounted for $47.3M of withdrawals from Maple Market PYUSD and syrupUSDC reserves between April 19 and April 20, ~75% of total withdrawals from the market in that 5-day window:
| Wallet | Date | Withdraw (USD) | Tokens |
|---|---|---|---|
29KnJ9mtSMbxAFExns4H8e5Tv9AqSb1Qazy1HhHdUbNH | Apr 19 | $25.2M | PYUSD + syrupUSDC |
J1ChJ8gTCrNG9H4SKYdhWUaxSaayMkUGSojKudqToRfL | Apr 20 | $11.4M | PYUSD + syrupUSDC |
GVSCWP9YeLZbwvXFzG1y5YDtRJhCDq8htNrqNmzToR3i | Apr 19 | $10.8M | syrupUSDC + PYUSD |
On-chain trace shows the three wallets routed their withdrawn funds into the same downstream address (BL428ZGJqpmWRxJx8G3d52eEgTYyWyHj5suUZERdxk1w), suggesting operational consolidation behind the cluster. None of the wallets carry public entity labels, so the actor is not publicly attributed.
Growing markets:
-
Solstice: $51M supply (+51.4%) / $19M debt (+76.3%) - April marked the second strong ramp month after February (+62%).
-
OnRe: $122M supply (+15.5%) / $40M debt (+15.7%) - ONyc collateral additions of +$8M drove the growth, taking OnRe to its largest size to date and keeping it the largest insurance-backed RWA market on Kamino by supply.
-
Huma: $26M supply (+6.4%) / $9M debt (+6.0%) - Continued PST collateral growth.
-
xStocks: $25M supply (+1.2%) / $5M debt (-11.6%) - Flat after March's near-doubling, with lower debt as some leveraged equity positions closed.
-
SolBlaze: $8M supply (+9.1%) / $4M debt (+13.2%) - One of the few markets that added supply during April's contraction.
Contracting markets:
-
Main: $1.26B supply (-14.4%) / $510M debt (-13.6%) - PYUSD outflow drove most of the decline (Main PYUSD reserve -$100M). Utilization stable at 40.4%.
-
Prime: $527M supply (-15.8%) / $227M debt (-15.9%) - PRIME -$53M led the contraction. Utilization stable at 43.1%.
-
Maple: $232M supply (-43.1%) / $93M debt (-36.9%) - Largest single-month decline of any major market. The two reserves that drove March's surge reversed: Maple PYUSD fell from $200M to $105M (-$95M) and Maple syrupUSDC fell from $189M to $123M (-$66M).
-
JLP: $82M supply (-27.5%) / $29M debt (-17.5%) - Continued contraction from the structural unwind that began in February.
-
Jito: $39M supply (-16.1%) / $18M debt (-14.1%) - LST market continued to fade.
-
Marinade: $5M supply (-45.9%) / $2M debt (-44.9%) - Continued migration away from smaller LST venues.
Market snapshot (April 30, 2026):
| Market | Supply | MoM | Debt | MoM | Util |
|---|---|---|---|---|---|
| Main | $1,260M | -14.4% | $510M | -13.6% | 40.4% |
| Prime | $527M | -15.8% | $227M | -15.9% | 43.1% |
| Maple | $232M | -43.1% | $93M | -36.9% | 40.2% |
| OnRe | $122M | +15.5% | $40M | +15.7% | 32.5% |
| JLP | $82M | -27.5% | $29M | -17.5% | 35.4% |
| Solstice | $51M | +51.4% | $19M | +76.3% | 36.9% |
| Superstate | $42M | -7.6% | $16M | -8.0% | 37.6% |
| Jito | $39M | -16.1% | $18M | -14.1% | 46.0% |
| Huma | $26M | +6.4% | $9M | +6.0% | 34.1% |
| xStocks | $25M | +1.2% | $5M | -11.6% | 19.6% |
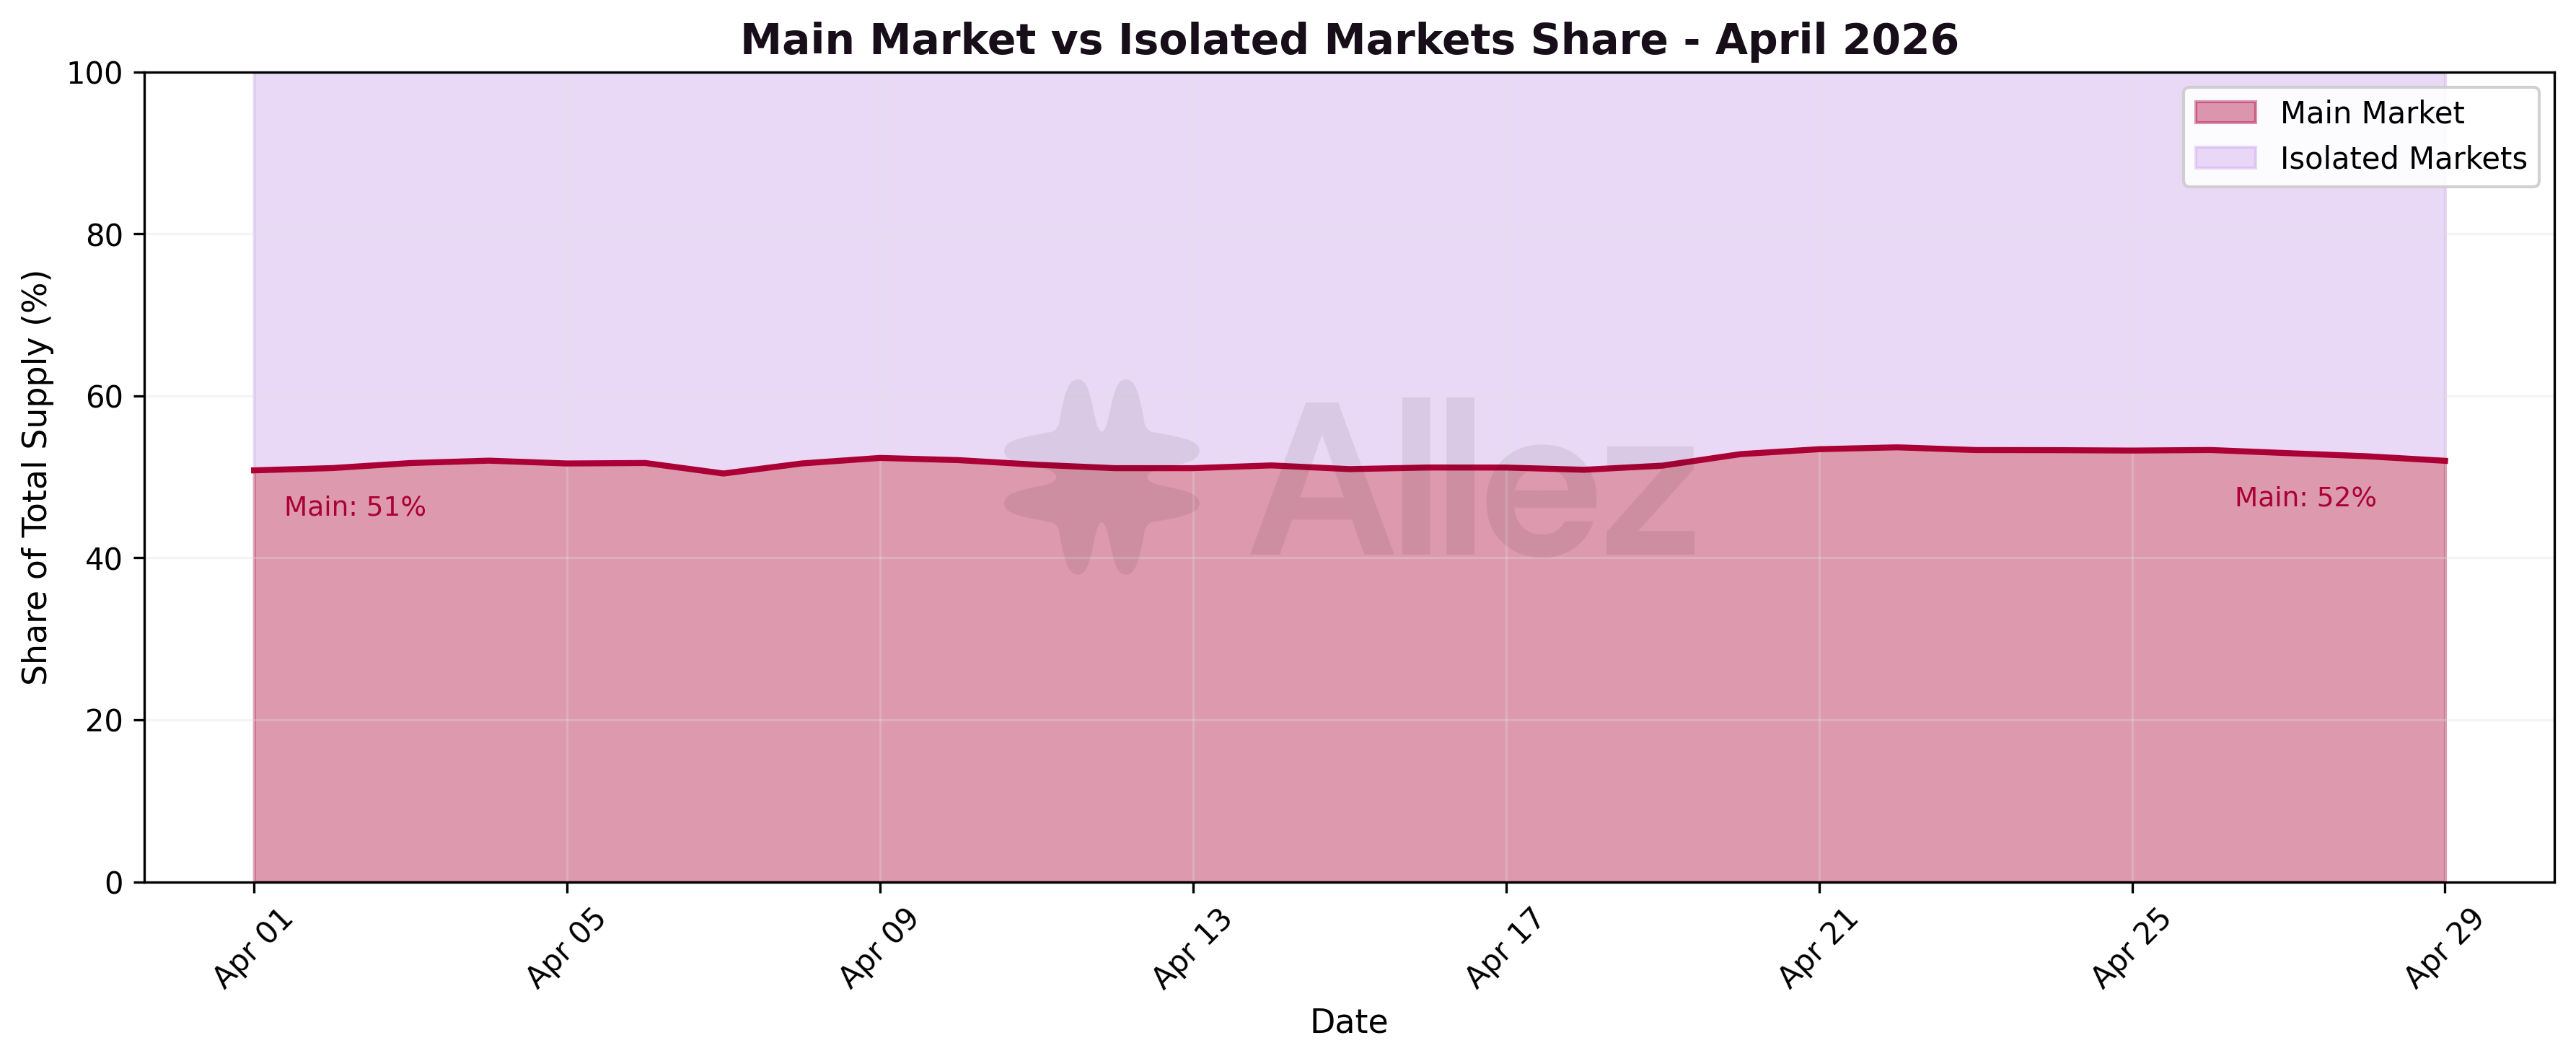
Main Market share rose from 50.8% to 52.0% during April. Main gained share through denominator compression: it lost $213M in supply, but Maple contracted faster (-43.1% vs -14.4%), so Main's relative share rose as the overall pool shrank. The structural shift from March was partially reversed.
5. Kamino Lending Vaults
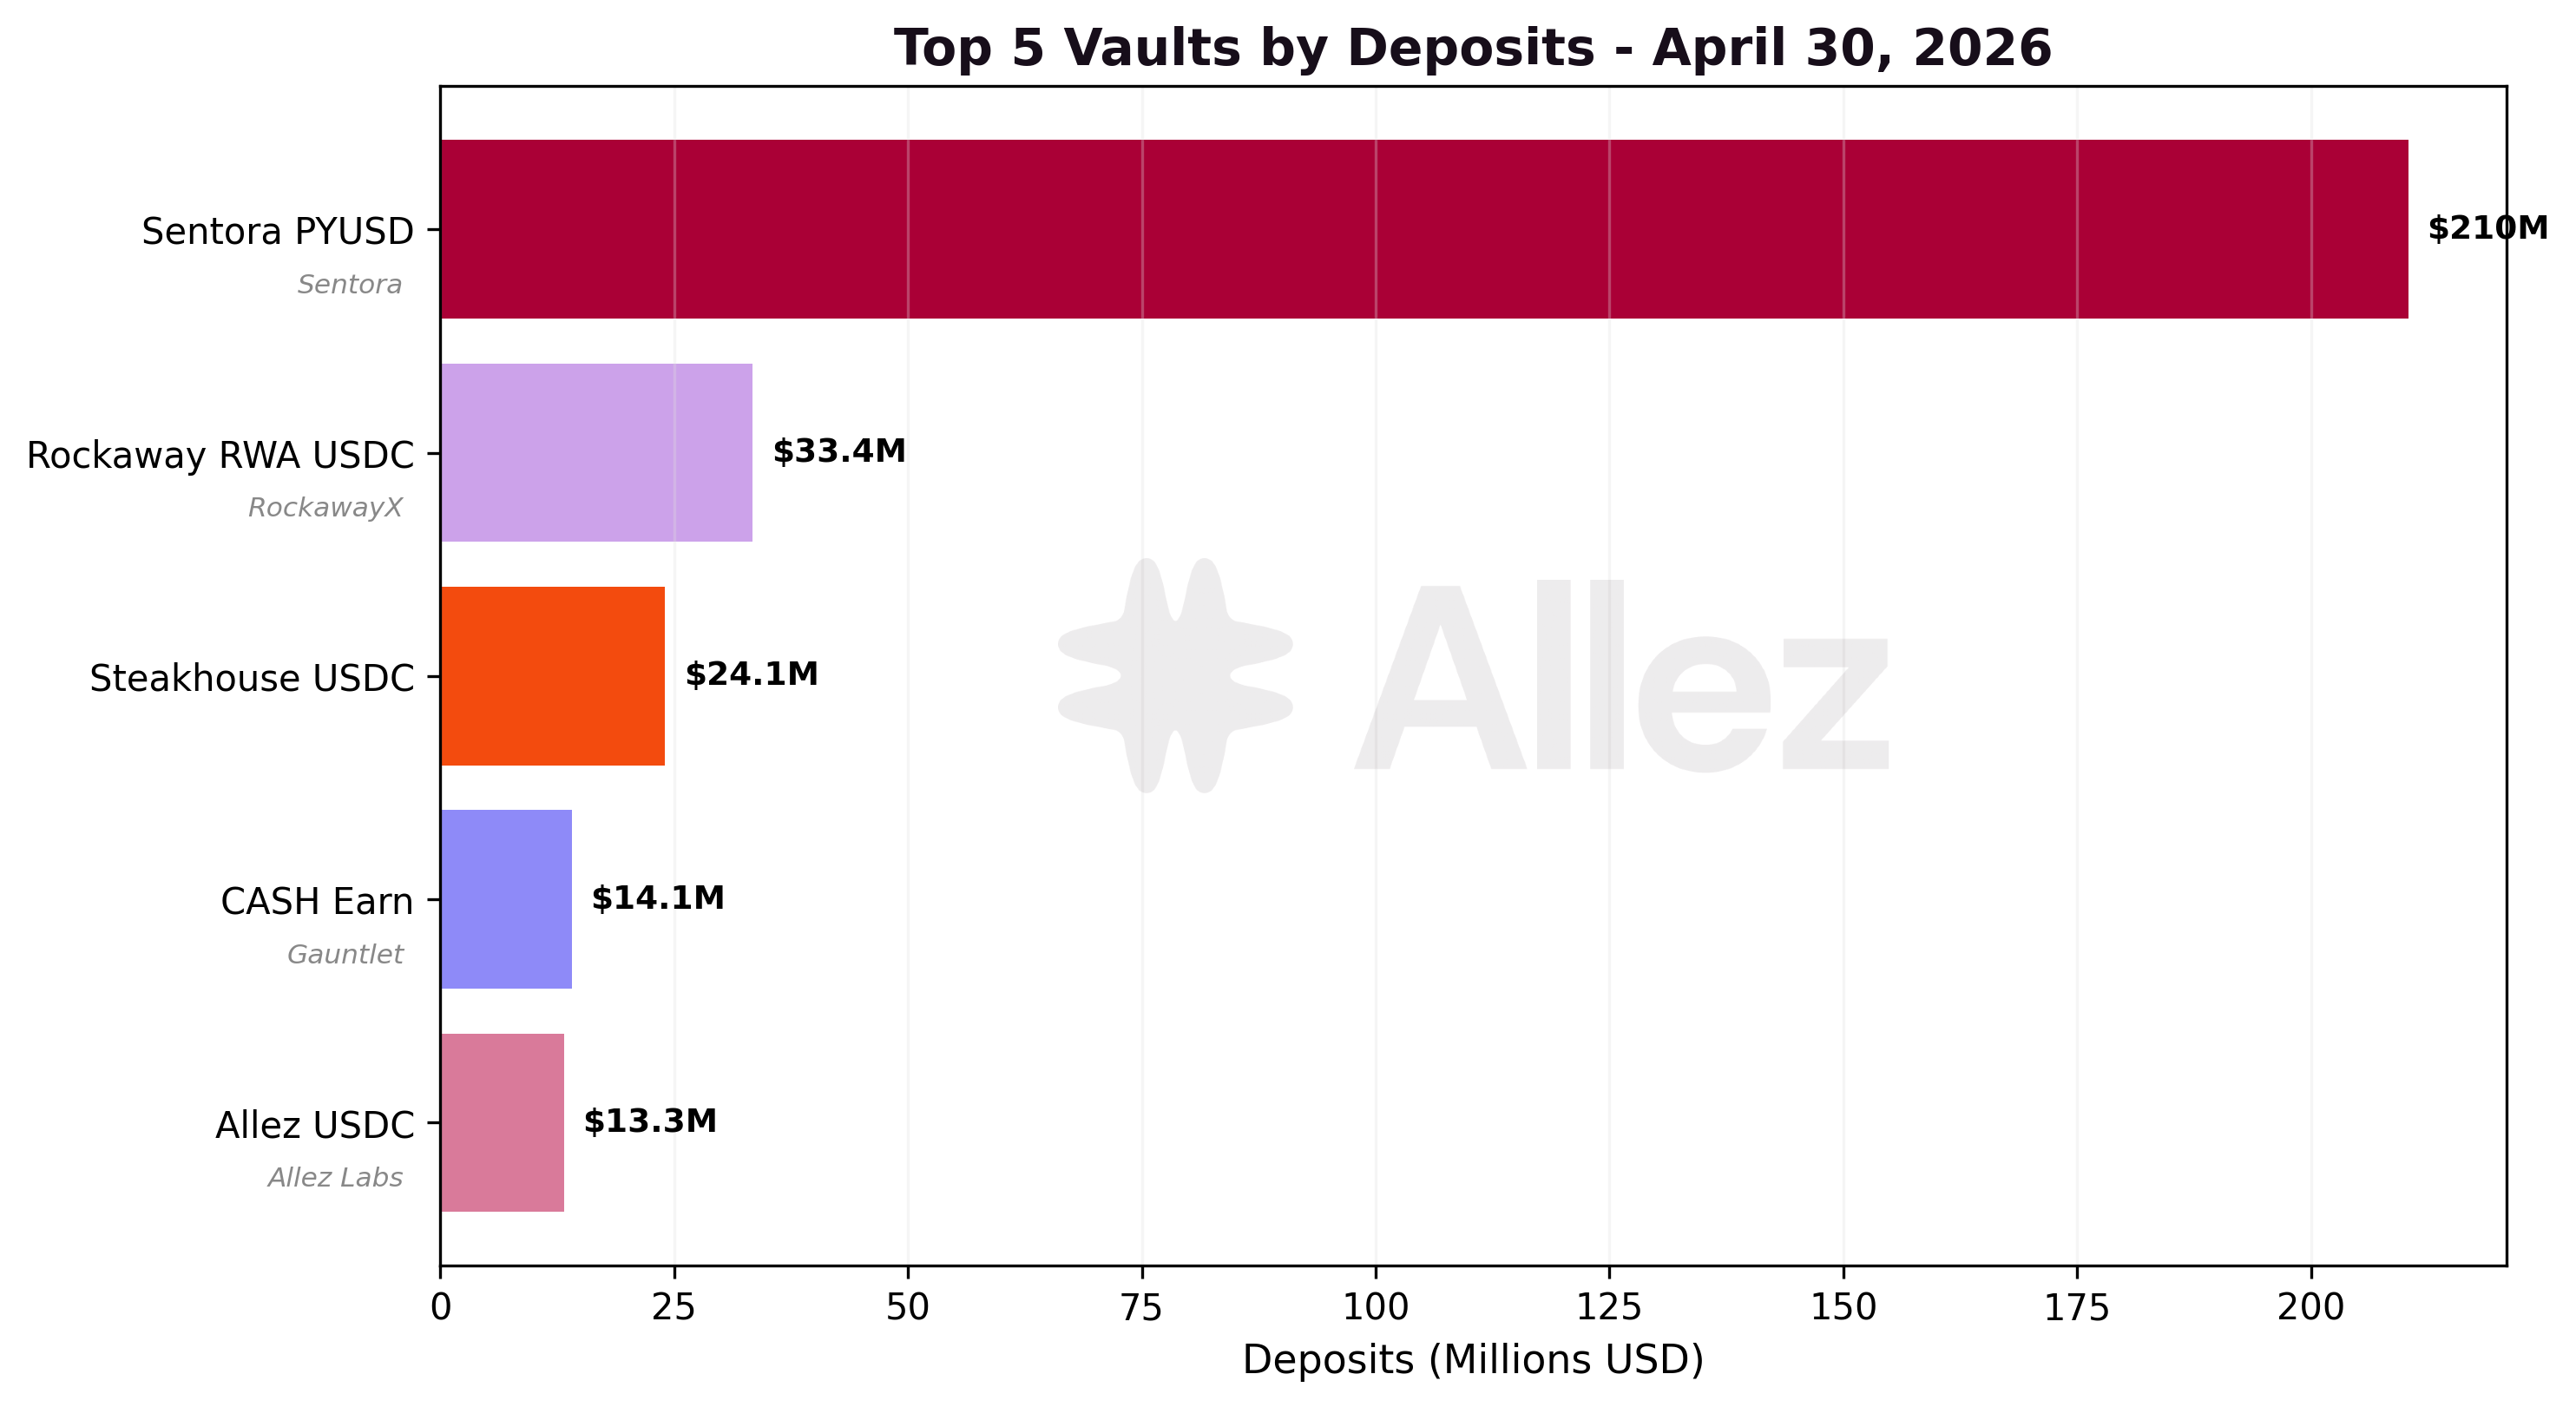
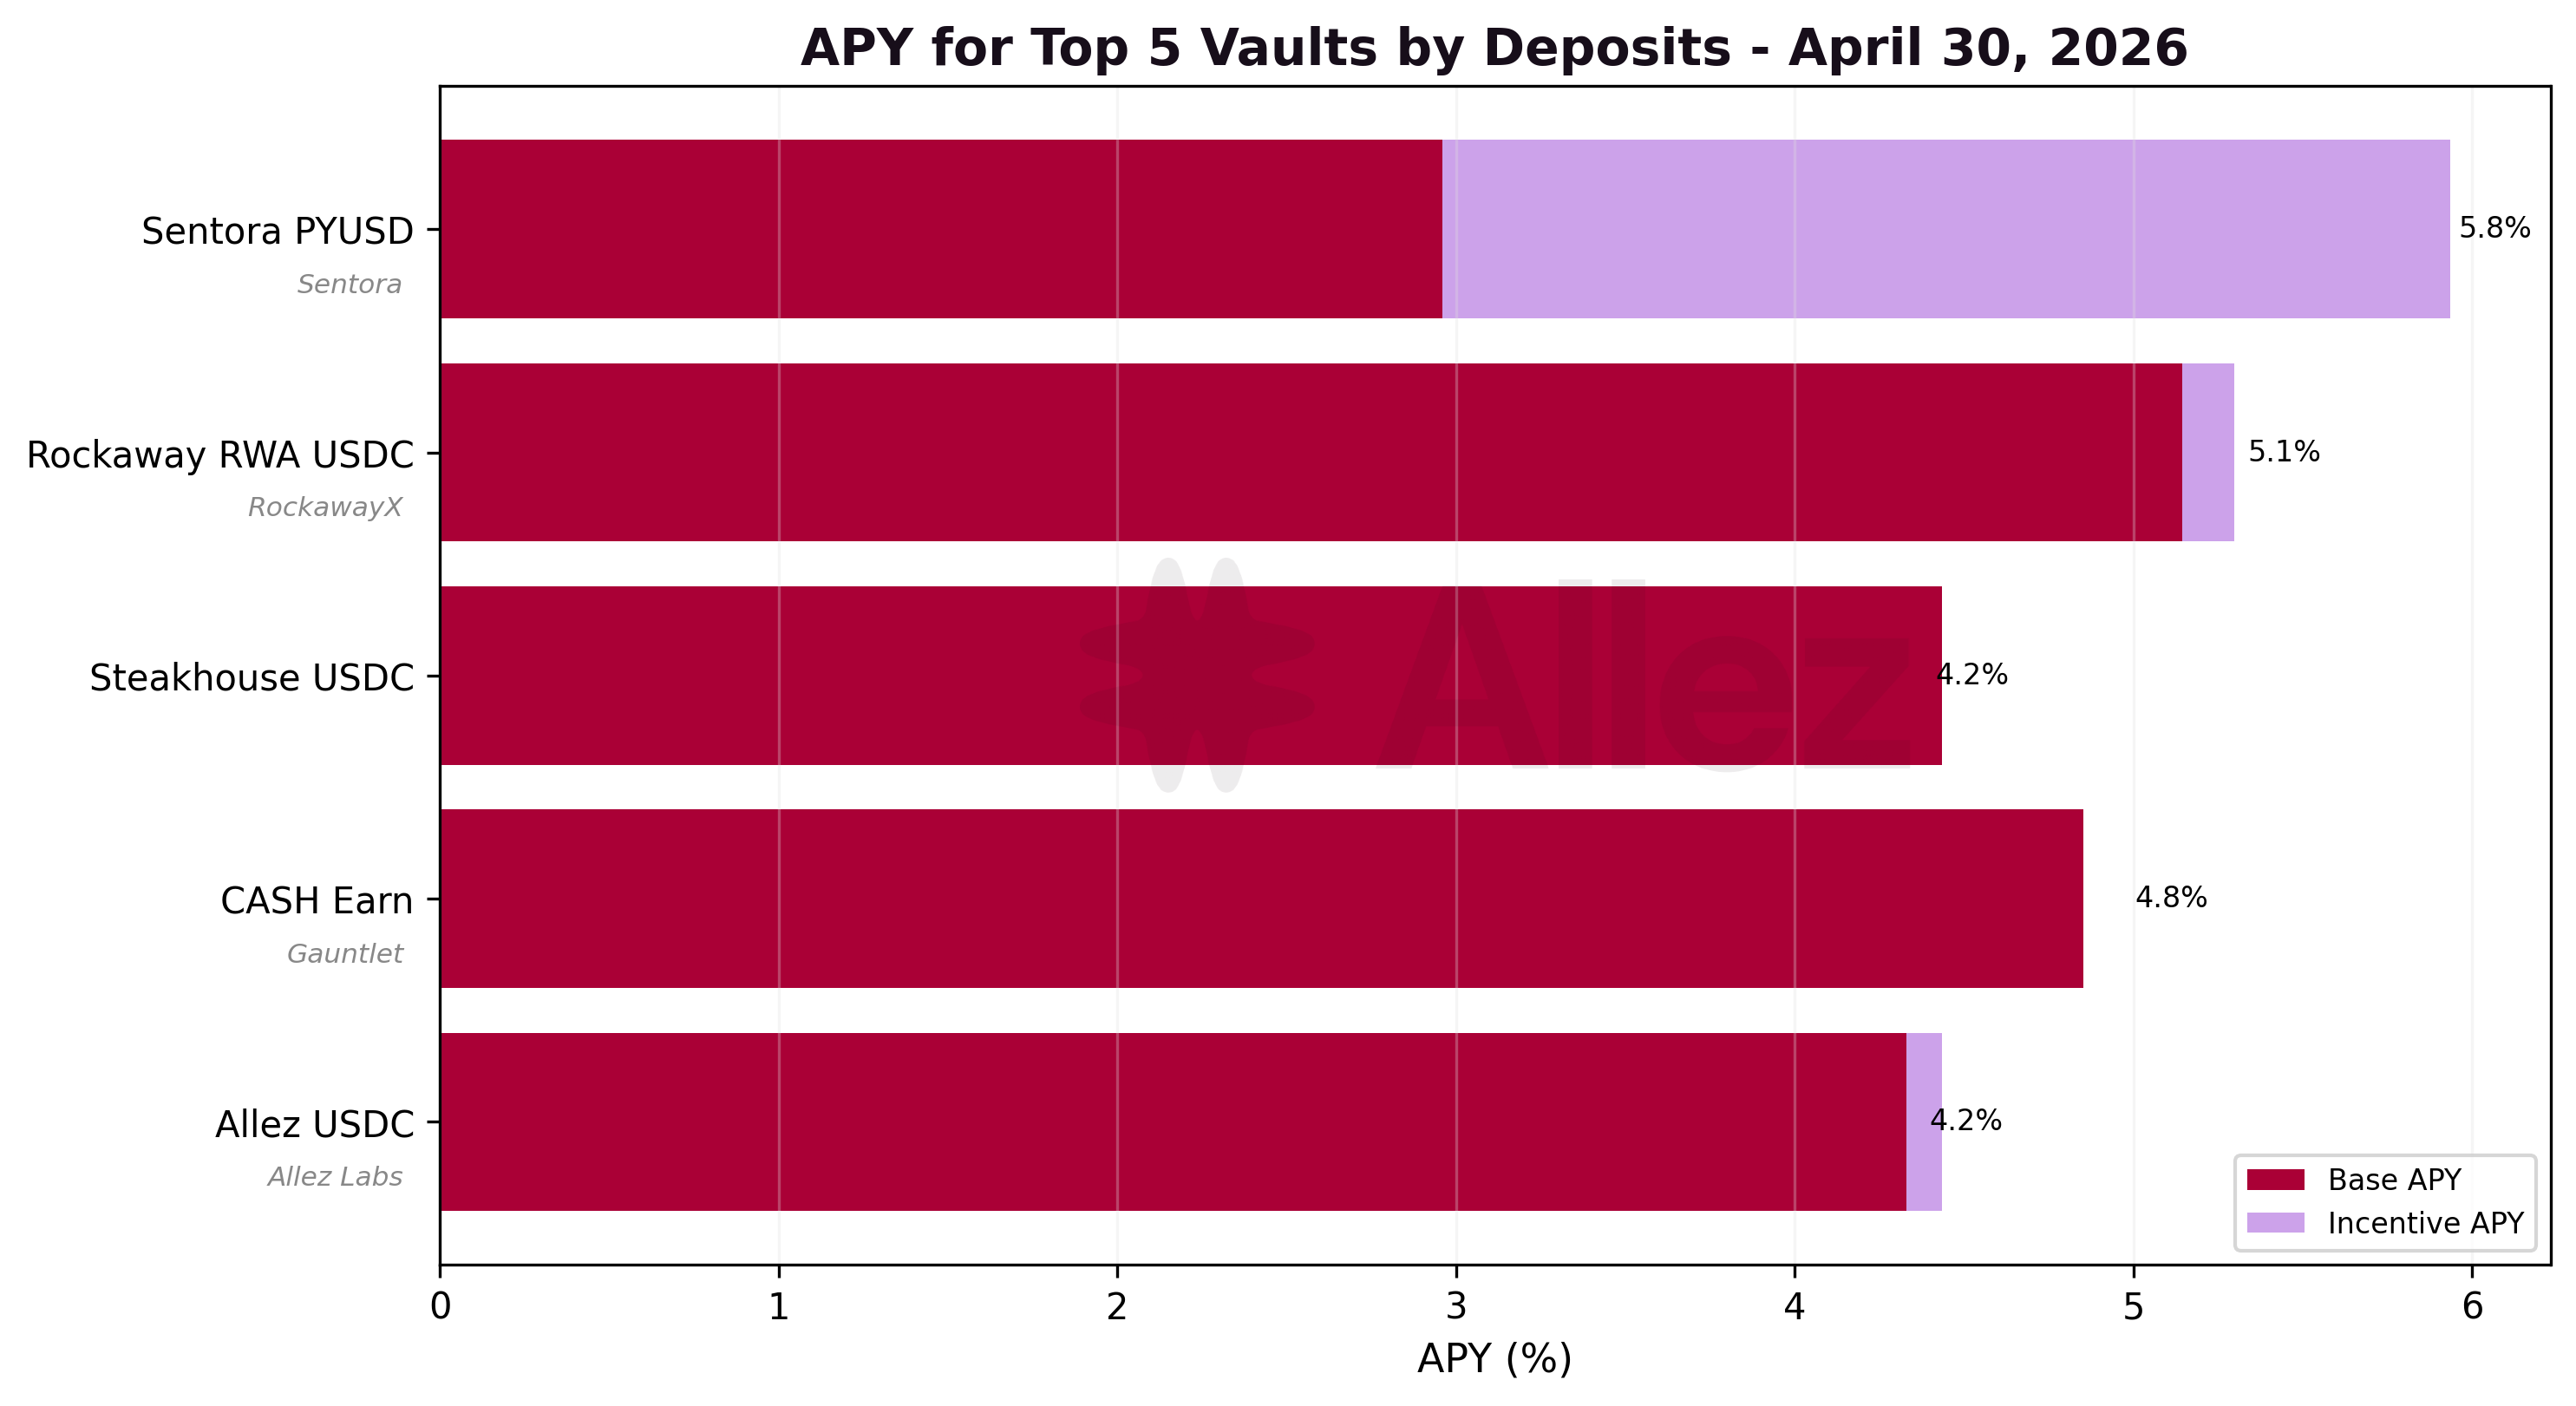
Top vaults by deposits:
| Vault | Token | Deposits | MoM | APY |
|---|---|---|---|---|
| Sentora PYUSD | PYUSD | $210M | -49% | 5.7% |
| Rockaway RWA USDC | USDC | $34M | +136% | 5.1% |
| Steakhouse USDC | USDC | $24M | -60% | 4.2% |
| CASH Earn | CASH | $14M | -41% | 4.8% |
| Allez USDC | USDC | $13M | -47% | 4.1% |
| Elemental USDC Optimizer | USDC | $8M | -41% | 5.2% |
| Allez SOL | SOL | $6M | -18% | 6.7% |
The vault dynamics were dominated by the Sentora PYUSD contraction (-49%, from $410M to $210M, -$200M), the largest single dollar decline of any Kamino vault. The vault's APY rose to 5.7% as utilization climbed to 87% on the smaller deposit base, but this was insufficient to retain the marginal capital that had entered in March and exited under risk-off positioning in April.
Rockaway RWA USDC was the standout performer more than doubling to $34M (+136%), continuing the March trend with its competitive 5.1% APY, fuelled by RWA markets.
USDC vaults contracted across the board: Steakhouse USDC -60%, Allez USDC -47%, Elemental USDC Optimizer -41%. The combined USDC vault outflows are the supply-side counterpart to the protocol's USDC -$54M decline.
6. Transaction Volume & User Behavior
Total transaction volume was $5.5B across 208,600 transactions. Volume fell -45% from March's $9.9B as user dynamics shifted from liquidity rotation to risk off. Transaction count rose +53% from 136,344, driven by elevated activity around the April 1-2 stress window (the 9,628 cascade liquidations, plus elevated repay and withdrawal activity, plus generally higher small-position activity through the month).
The Main Market generated 66% of all transaction volume ($3.55B), followed by Maple at 14% ($0.76B) and Prime at 12% ($0.64B). Main's volume share fell from 84% in March to 66% in April as the PYUSD migration reversed (this volume-share drop is distinct from Main's supply share, which actually rose from 50.8% to 52.0% because Maple contracted faster than Main). Absolute Main volume fell sharply, from $8.2B to $3.5B.
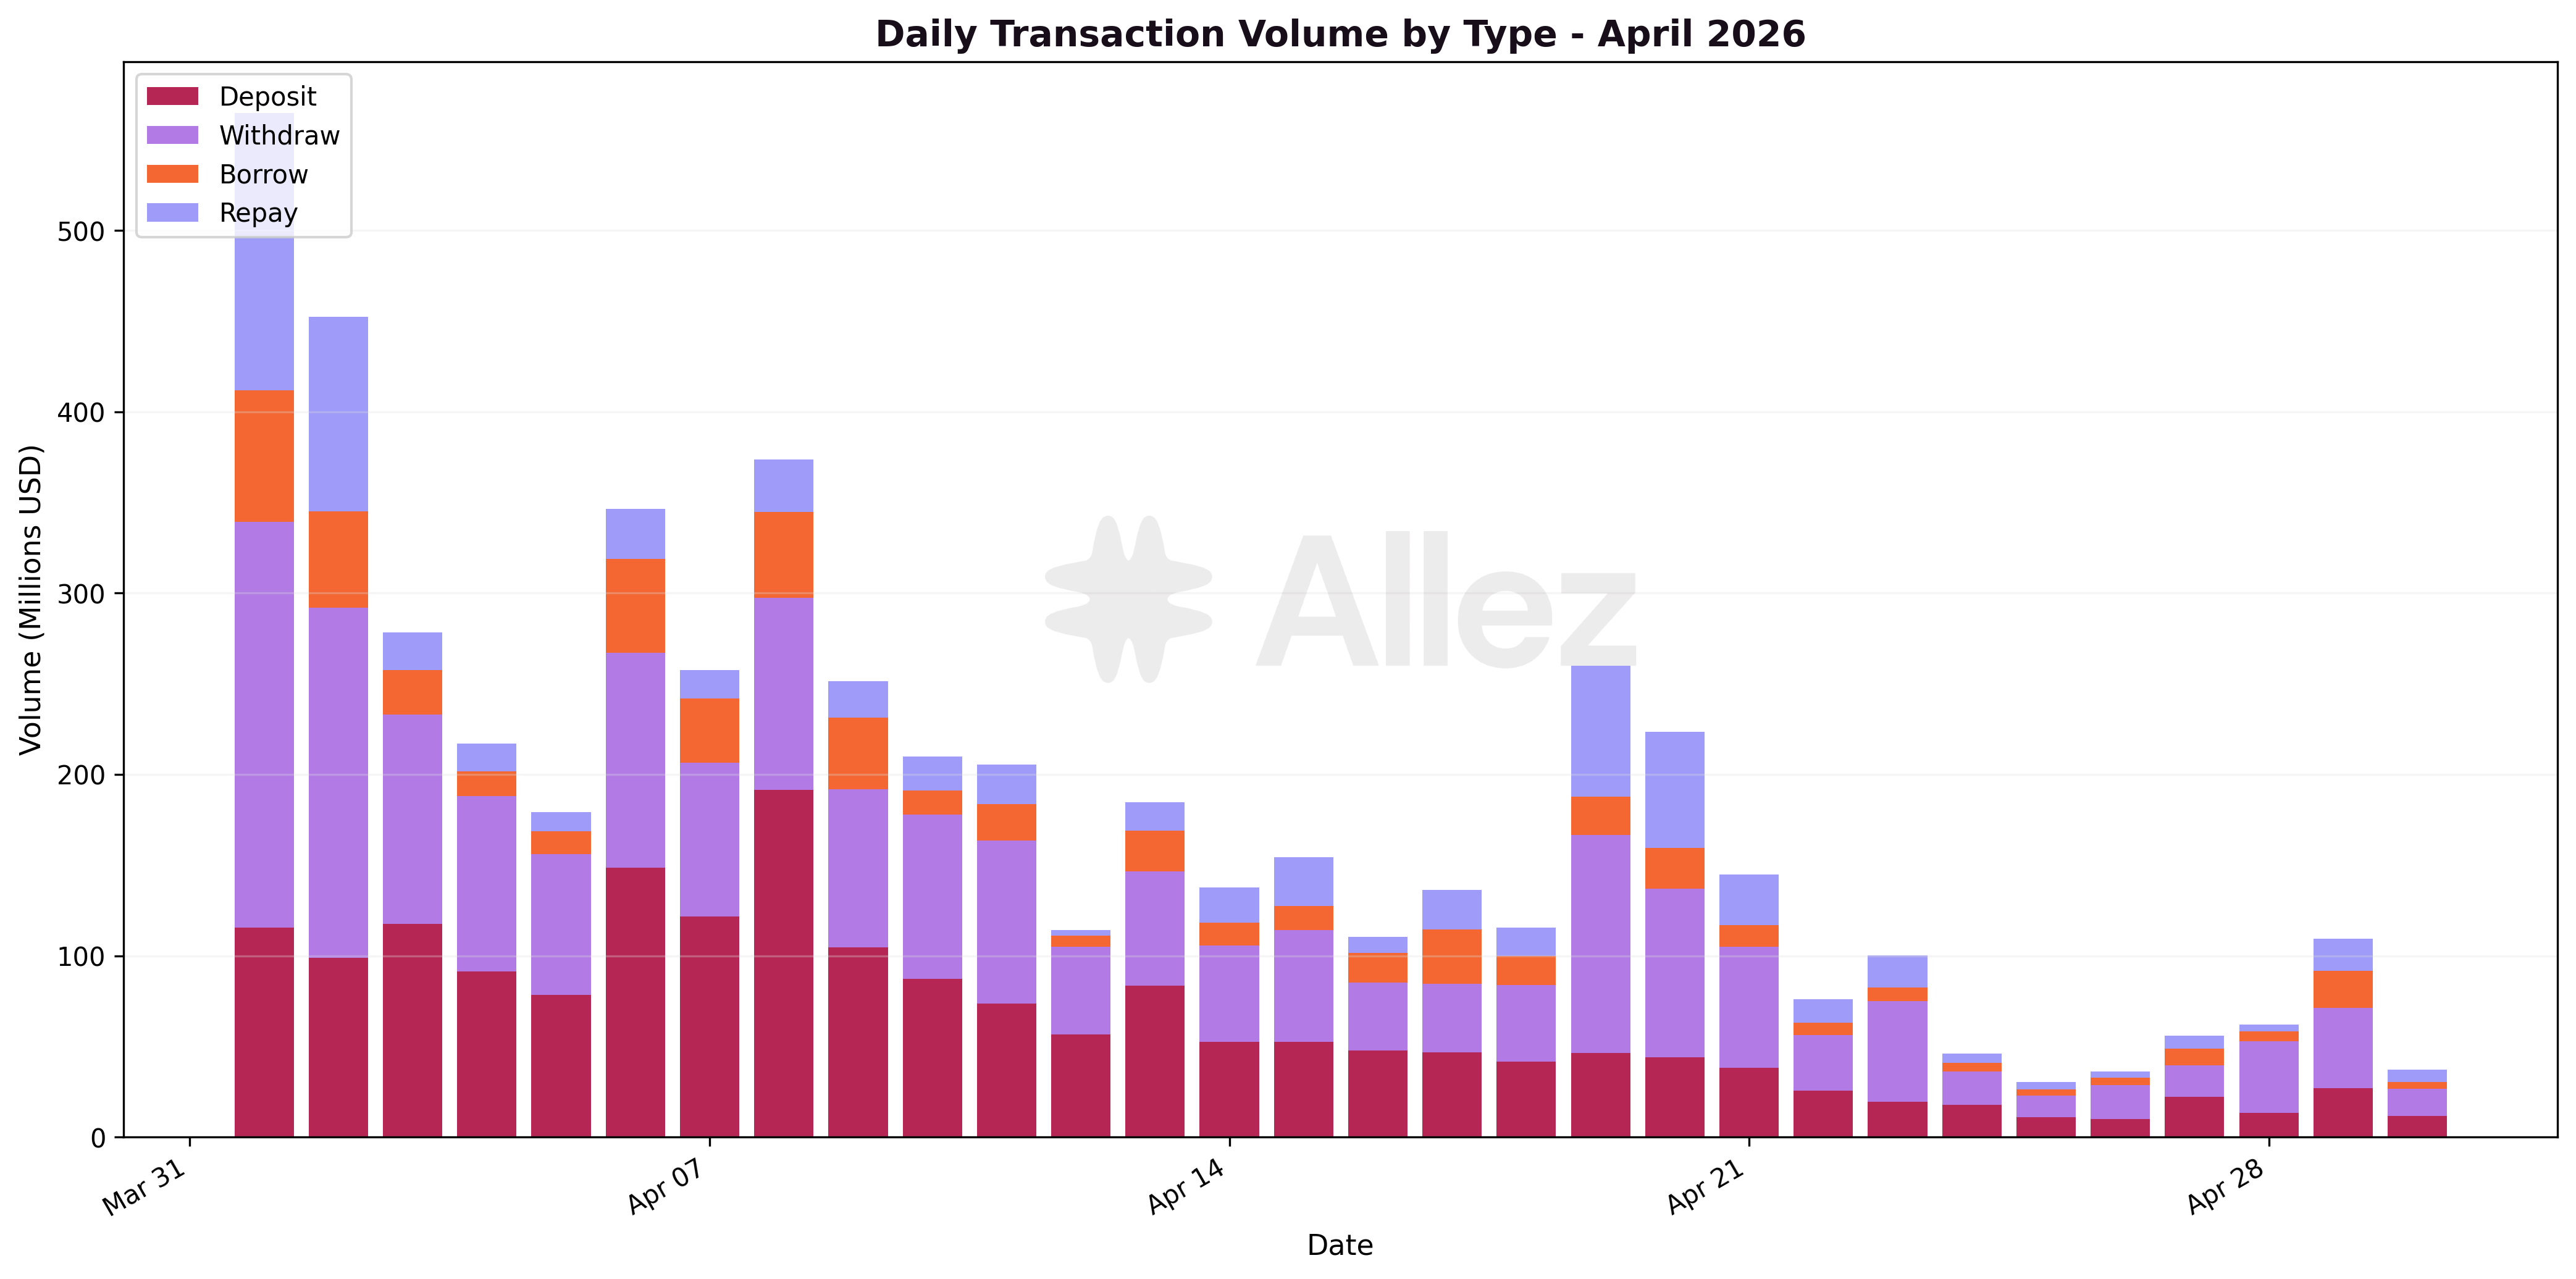
Volume breakdown by transaction type:
| Type | Volume | Share | MoM |
|---|---|---|---|
| Withdrawals | $2.16B | 39% | -48% |
| Deposits | $1.90B | 35% | -55% |
| Repays | $0.79B | 15% | +9% |
| Borrows | $0.62B | 11% | -23% |
Deposits and withdrawals fell in line (-55% / -48%) as rotation activity declined. Repays rose +9% even as borrows fell -23%, reflecting net deleveraging across the protocol consistent with the -15.2% debt decline.
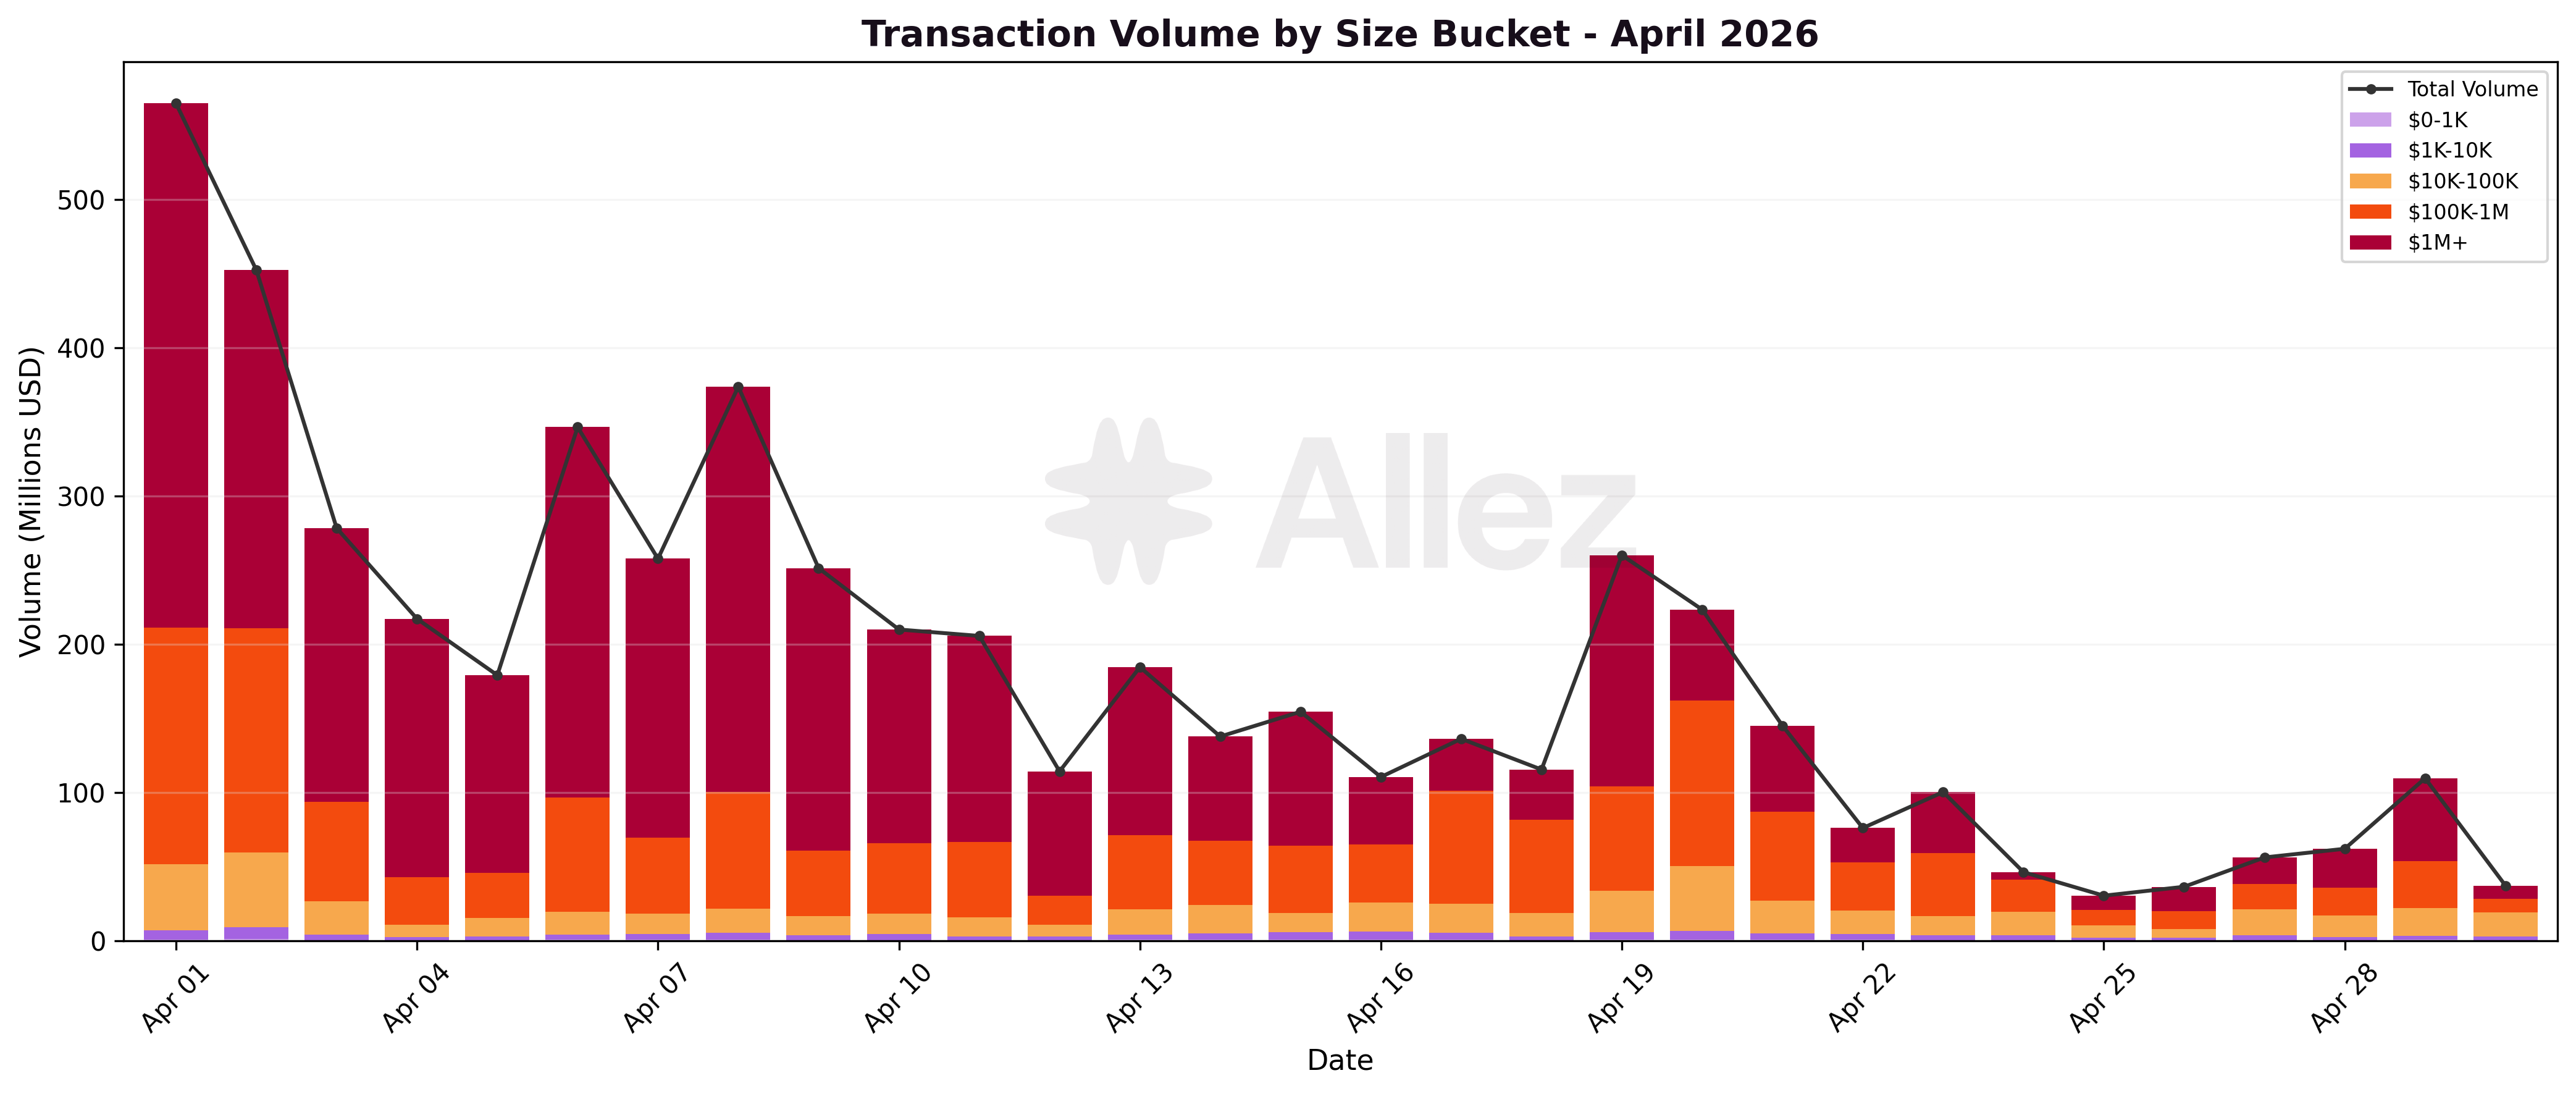
Volume by transaction size:
| Size Bucket | Volume | Share | Transactions |
|---|---|---|---|
| $1M+ | $3.23B | 58.9% | 673 |
| $100K-1M | $1.57B | 28.6% | 5,143 |
| $10K-100K | $0.56B | 10.1% | 15,635 |
| $1K-10K | $0.11B | 2.0% | 28,919 |
| $0-1K | $0.01B | 0.3% | 158,230 |
The $1M+ bucket fell from 80% to 59% of volume share, with whale transaction count rising +10% to 673 events (612 in March). The relative drop reflects the absence of the very largest March rebalancing events such as the multi-hundred-million PYUSD migrations, not a drop in whale participation. Sub-$1K transactions ballooned to 76% of all activity (vs 66% in March) due to the UXD cascade, but contributed only 0.3% of dollar volume.
7. Conclusions & Forward Look
April was a contraction month driven entirely by external forces. Total supply fell -16.9% to $2.43B, as the protocol absorbed two DeFi-wide shocks (the April 1-2 UXD compression cascade and the April 18 KelpDAO bridge exploit). This was achieved through the standard liquidation ecosystem, and some preemptive action on the LayerZero-bridged reserves listed at the time (USDS, LBTC, FBTC).
Beneath the headline contraction, the composition of Kamino's collateral base shifted in a healthier direction. Stablecoins lost 4.7pp of supply share as Maple Finance fully unwound its DeFi positions (-$200M PYUSD protocol-wide, -$70M syrupUSDC), while LSTs gained 4pp on net mSOL and JupSOL inflows and RWAs held +0.5pp. The Main market's share of total supply rose from 50.8% to 52.0% as more volatile categories rotated out, and isolated specialized markets (OnRe +15.5%, Solstice +51.4%, Huma +6.4%) kept adding supply through the broader contraction - confirming that the segregated-market design attracts capital on its own merits rather than tracking the protocol's main risk pool.
The vault layer contracted in line with the broader protocol: total vault deposits fell -39% to $305M, though Rockaway RWA bucked the trend with +136%. Liquidation activity outside the UXD cascade was low - only 683 events across the rest of the month, the second-quietest reading on record.
Outlook - three things to watch in May:
-
cbBTC outflows: a second consecutive month of token-level withdrawals (-1,090 BTC March, -816 BTC April) despite ~12% BTC price appreciation. A third consecutive month would suggest a structural shift in BTC collateral demand on Kamino.
-
PYUSD stabilization: whether the protocol's $217M PYUSD exposure (primarily Maple $105M, Main $84M, Prime $25M) holds current levels or continues to erode after Maple's exit. PYUSD is the second-largest stablecoin exposure on Kamino, behind USDC ($434M). Its trajectory will impact stablecoin supply share recovery.
-
PRIME concentration risk: $182M of borrowed debt collateralized by PRIME at LTV ≥80% against PRIME's 91% liquidation threshold remains the largest single-asset cliff in stress scenarios. PRIME's behavior in any sharp-drawdown event will be the next real test of correlated-market parameters.
Appendix: Asset Category Classification
This report uses a six-category framework to classify all tokens on Kamino Lend, consistent with the 2025 Annual Report and prior monthly reports. Position risk depends on whether collateral and debt are correlated (e.g., LST-borrows-SOL, RWA-borrows-stablecoin) or uncorrelated (e.g., SOL-borrows-USDC). Correlated positions carry lower liquidation risk by design and use tighter DTL thresholds (<1.5% for the Critical tier). Uncorrelated positions use broader thresholds (<5% critical) to account for directional price exposure.
Category Definitions & Constituent Assets (April 30, 2026):
| Category | Top Assets (by supply) | Apr Supply | Apr Debt | MoM Supply |
|---|---|---|---|---|
| Stablecoins | USDC, PYUSD, CASH, USDG, USDS, USDT, USX, EURC, sUSDe, UXD, USD1 | $803M | $717M | -27.3% |
| LSTs | mSOL, JitoSOL, JupSOL, dSOL, fwdSOL, bSOL, vSOL, hSOL, stkeSOL, + others | $620M | $2.1M | -1.4% |
| RWAs | PRIME, syrupUSDC, ONyc, USCC, PST, FWDI, sACRED, GLXY, eUSX, + tokenized stocks | $558M | $0.3M | -15.0% |
| SOL | SOL (native) | $277M | $251M | -6.1% |
| BTC | cbBTC, xBTC, fBTC, WBTC, LBTC, ZBTC, tBTC | $113M | $3.2M | -30.6% |
| Other | JLP, FLP, ALP, ETH, WIF, GOAT, POPCAT, FARTCOIN, BONK, JTO, JUP, KMNO, + others | $60M | $0.7M | -25.0% |
Classification Notes:
-
LSTs include all liquid staking tokens (any token ending in "SOL" other than SOL itself, plus INF). Pendle PT tokens wrapping SOL-based assets are also classified as LSTs.
-
RWAs include tokenized real-world assets (PRIME, syrupUSDC, ONyc, PST, FWDI, sACRED, GLXY, USCC, eUSX), tokenized equities (xStocks market tokens), and Pendle PT tokens wrapping RWA underlyings.
-
Stablecoins include fiat-pegged tokens used as lending/borrowing primitives. RWA debt is near-zero because RWA tokens serve as collateral. The associated borrowing appears in the Stablecoins category.
-
BTC is separated from "Other" because bitcoin-backed collateral carries distinct risk characteristics.
-
Other is a catch-all for assets with mixed or idiosyncratic profiles. JLP dominates this category.
This report represents independent risk analysis by Allez Labs for the Kamino Finance community. Analysis reflects protocol performance through April 2026.
Prepared by: Allez Labs Risk Team
Report Date: May 5, 2026
Next Report: May 2026 Monthly Report published in June 2026