September was Current Finance's largest month of growth in the past six months. Supply rose 64.9% to $124.9M, led by stablecoin deposits, and passed $100M for the first time on September 21. Borrowing across the protocol kept pace, up 63.3% to $67.0M. Despite this new activity, liquidations remained minimal, at $4,514 of debt repaid across 31 events, and uncorrelated debt within 10% of the liquidation line fell from $5.8M to $4.7M at month-end.
1. Market Context and SUI Price
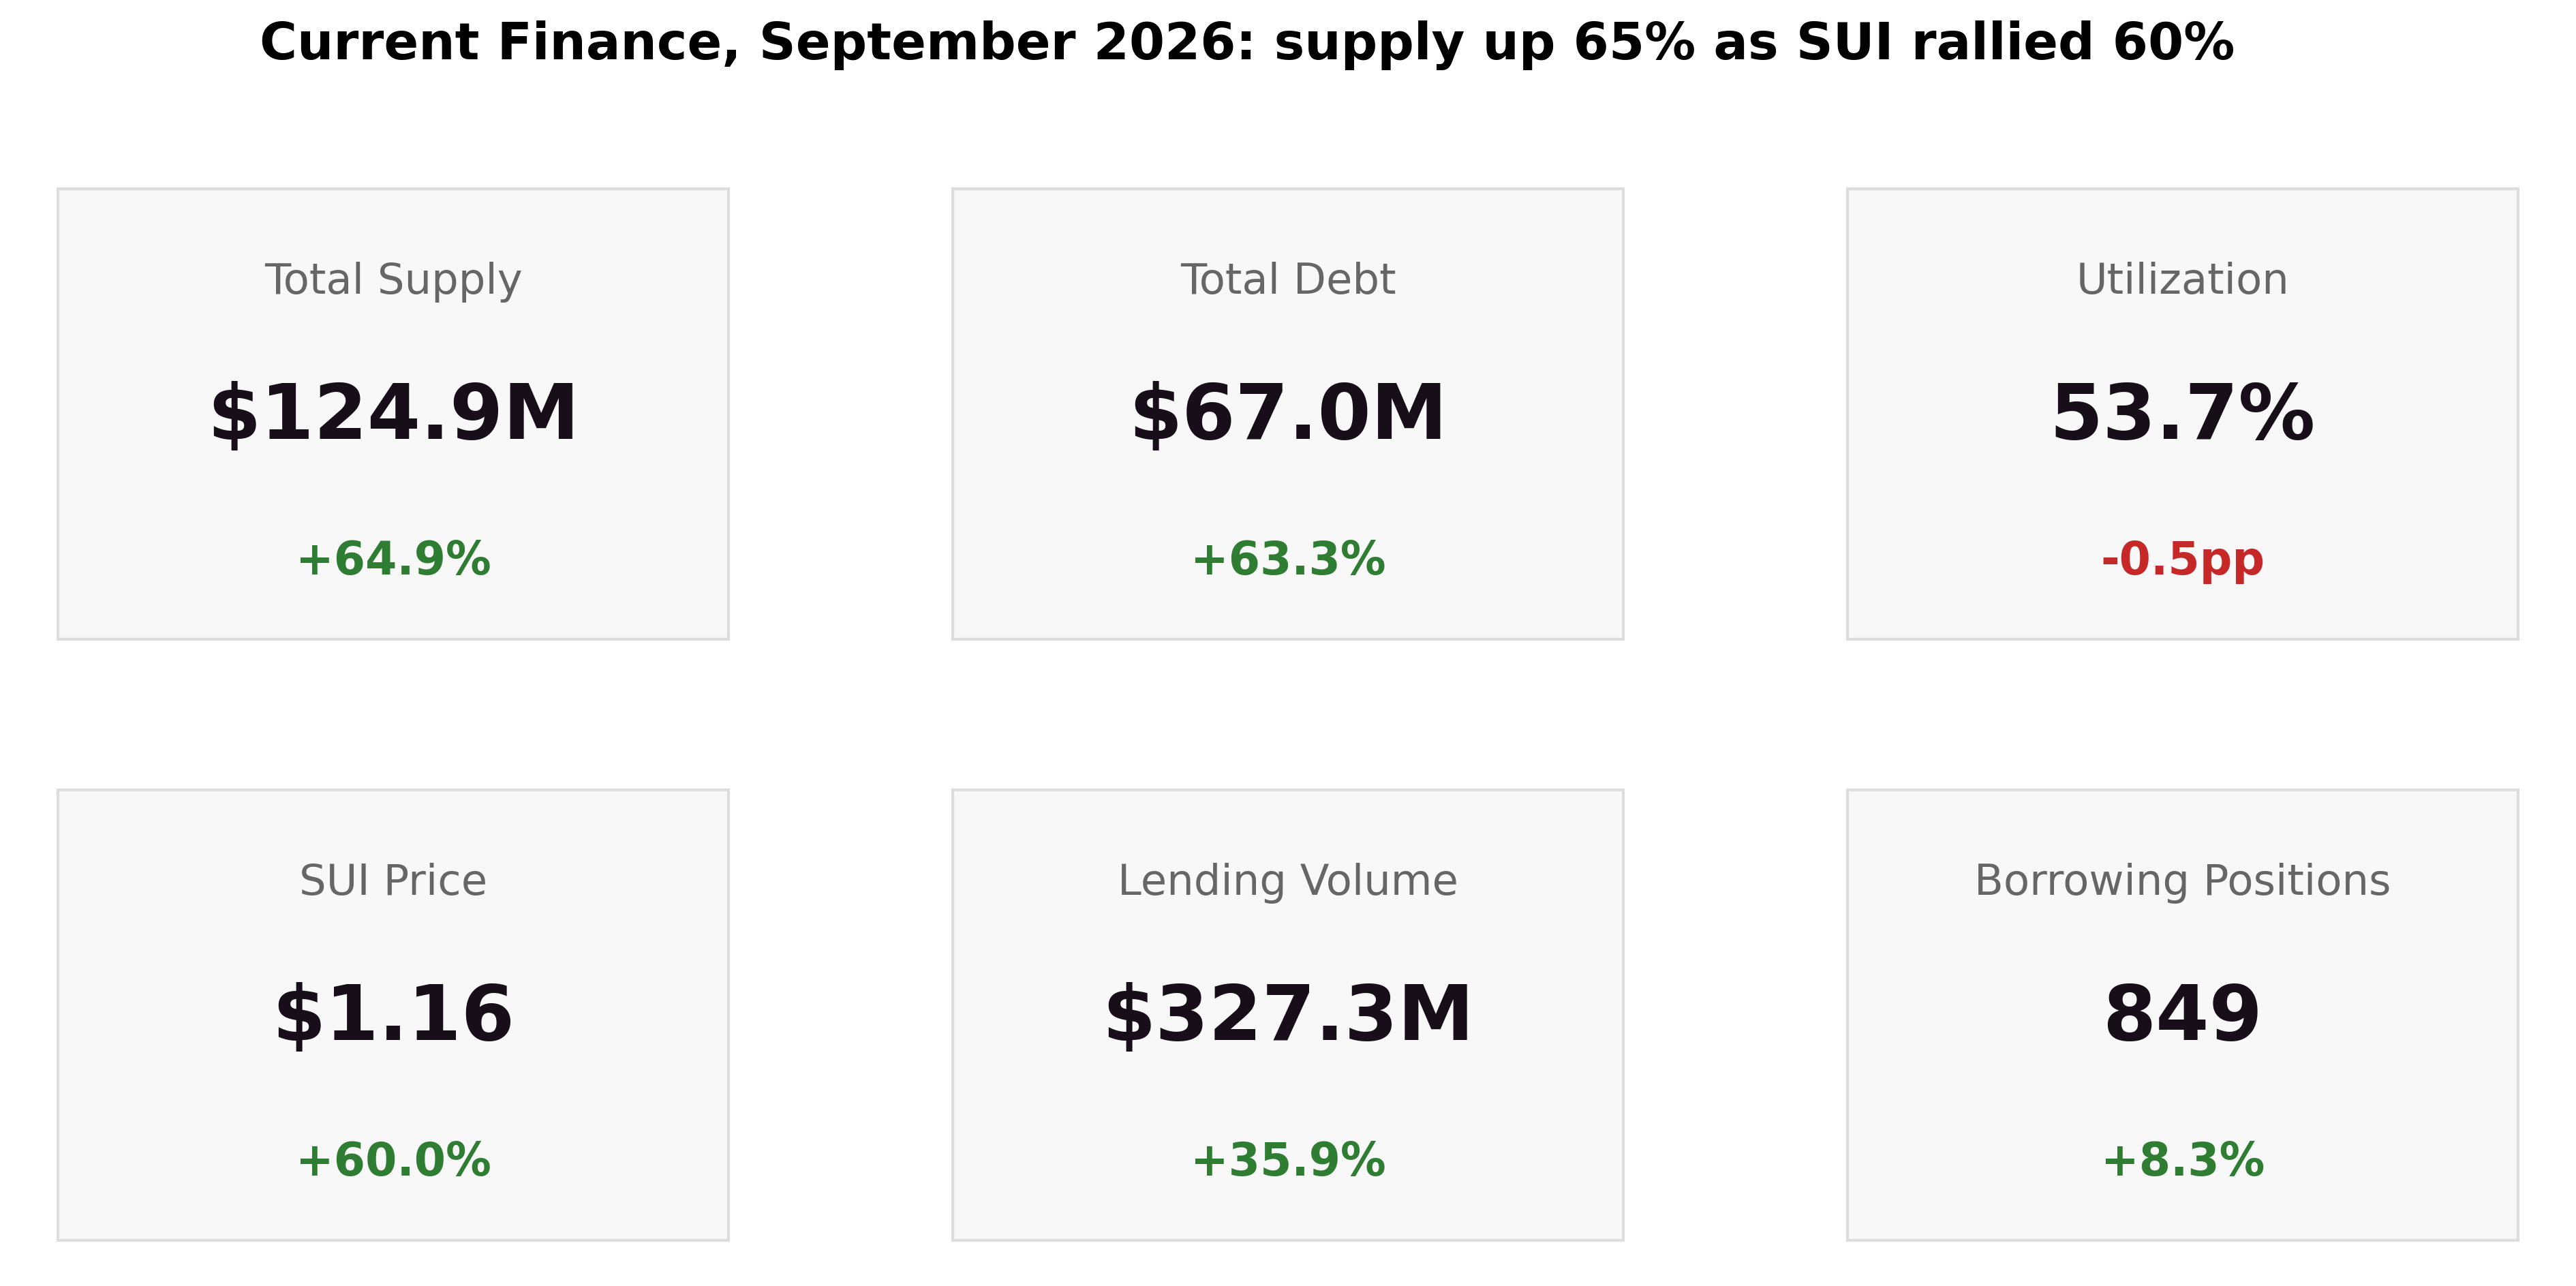
Current Finance closed September with:
-
Total supply: $124.9M (+64.9%)
-
Total debt: $67.0M (+63.3%)
-
Utilization: 53.7% (-0.5pp)
-
SUI price: $1.16 (+60.0%)
-
Lending volume: $327.3M (+35.9%), excluding $33.9M of flash loans
-
Borrowing positions: 849 (+8.3%)
Current Ecosystem Updates:
-
Cap changes (September 5 to 25). Current raised supply and borrow caps on USDC, usdSUI, SUI and the sUSN market, and lowered them on BTC, xBTC and LBTC.
-
Multiply fee cut** (September 3).** The Multiply opening fee fell 80%, to 0.01% on all strategies.
-
Points Season 2** (September 16).** 8,500 Current Points convert to one Surf Board NFT, with the season ending in late October.
-
sUSN-USDC points booster** (September 28).** The sUSN-USDC Multiply position earns a limited-time 12x Current Points multiplier.
-
Oracle upgrade audit** (September 12).** Current released Asymptotic's audit and formal verification of its oracle upgrade.
2. Supply and Market Overview
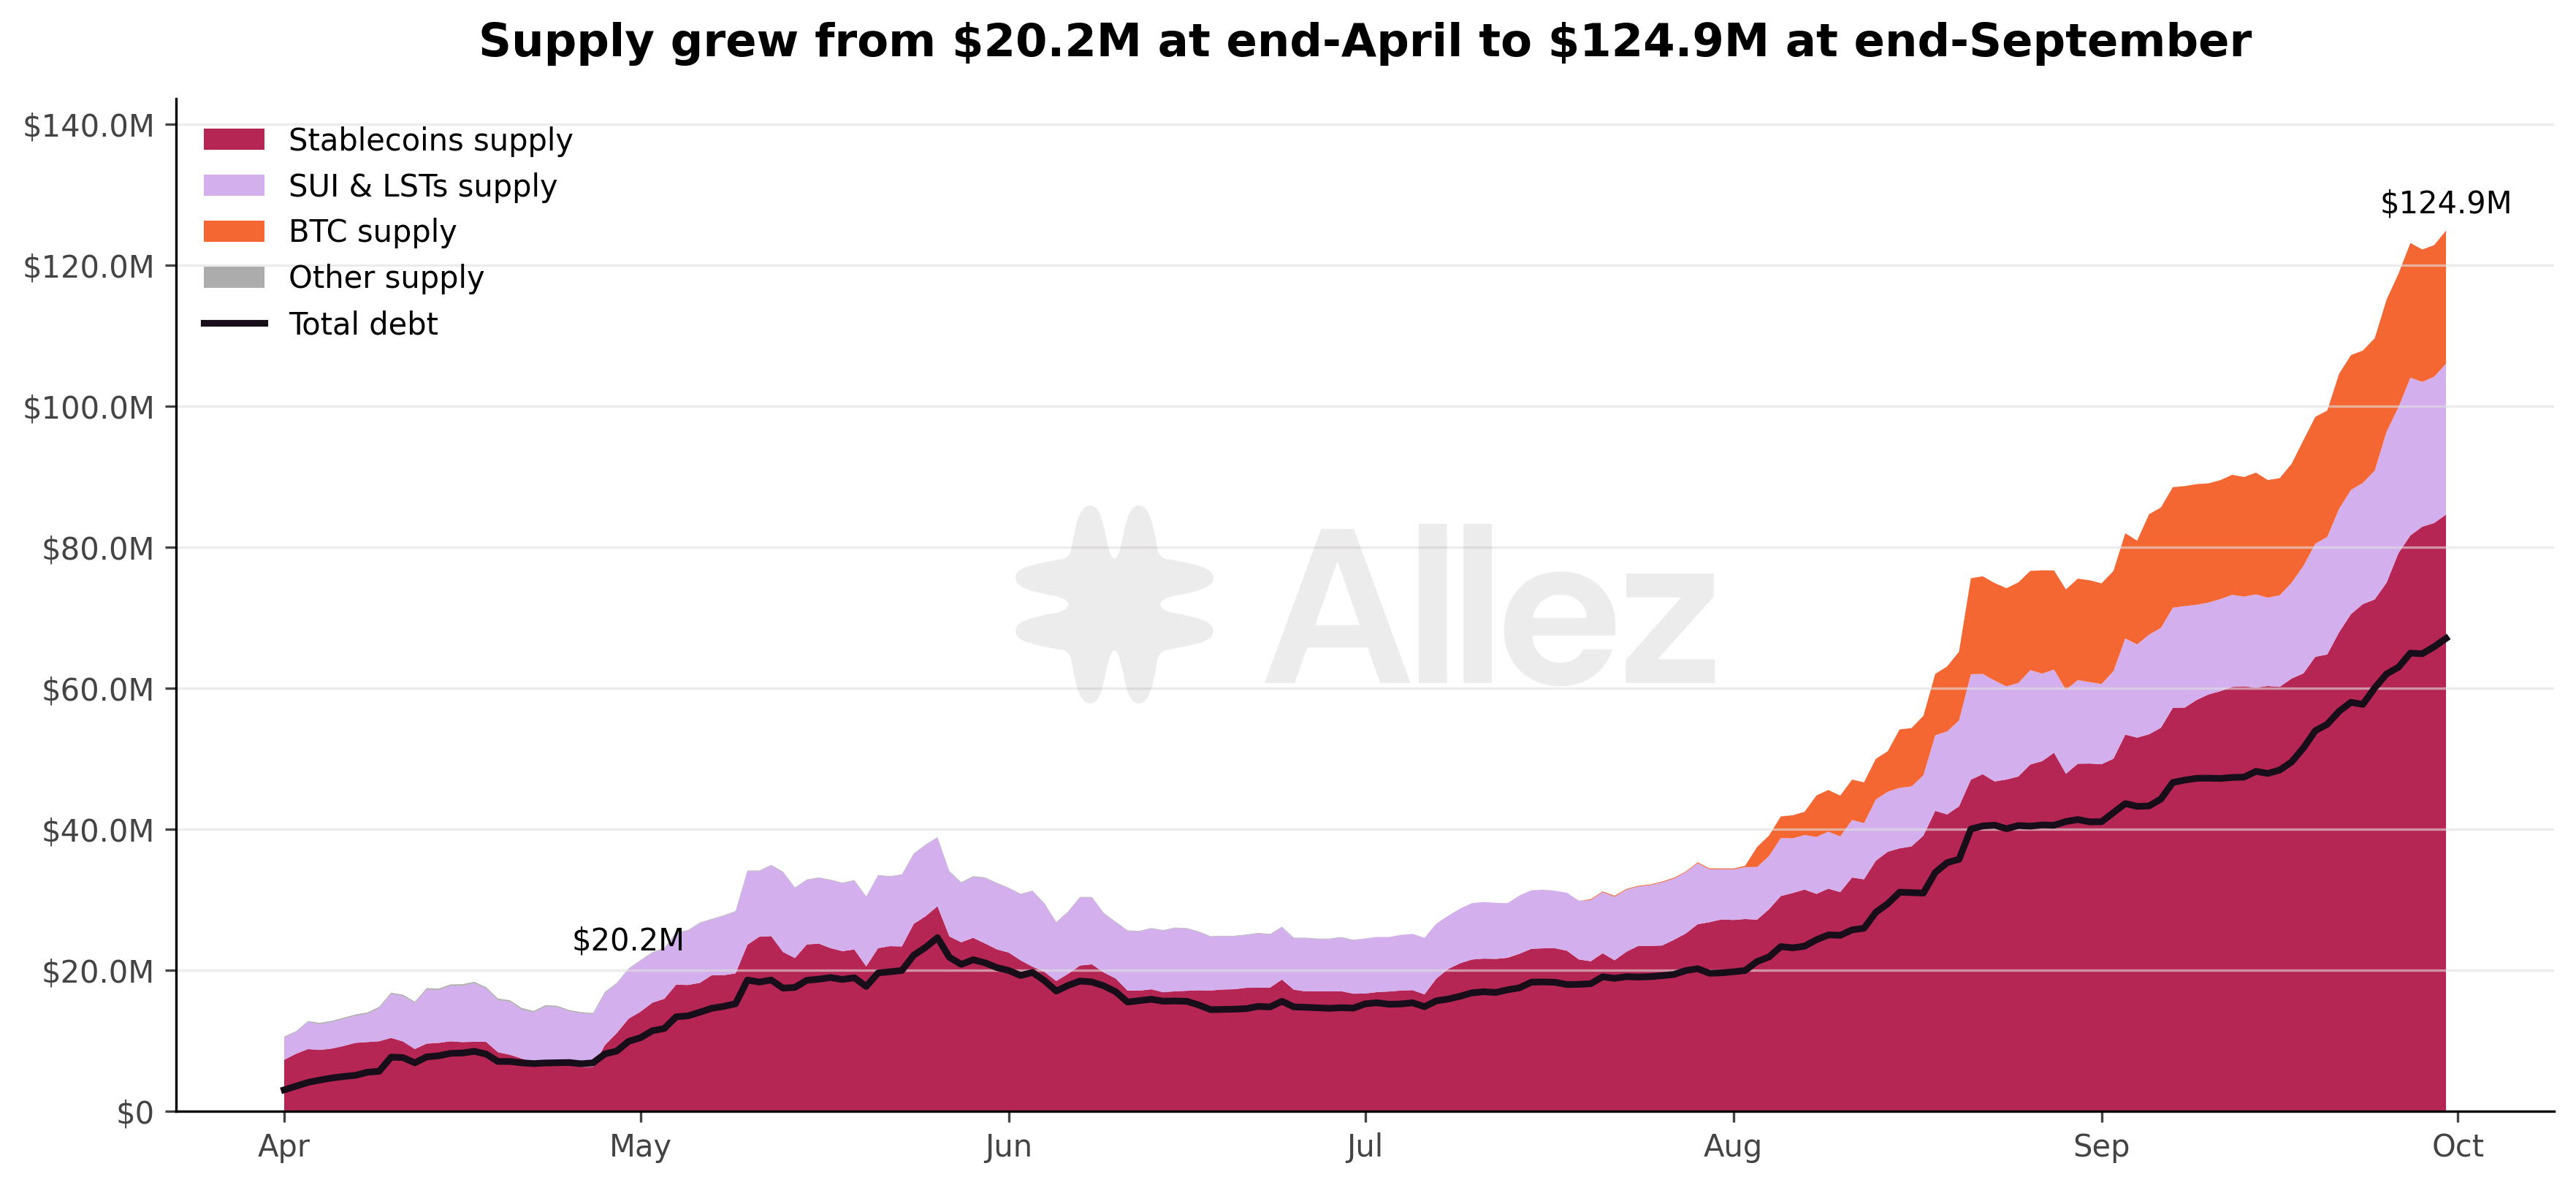
It has been six months of strong TVL growth for the protocol. Supply has grown from $20.2M at the end of April to $124.9M at the end of September. Supply fell in June, from $32.4M to $24.3M, then grew again from July and accelerated through August and September. September added more supply than any other month in the period.
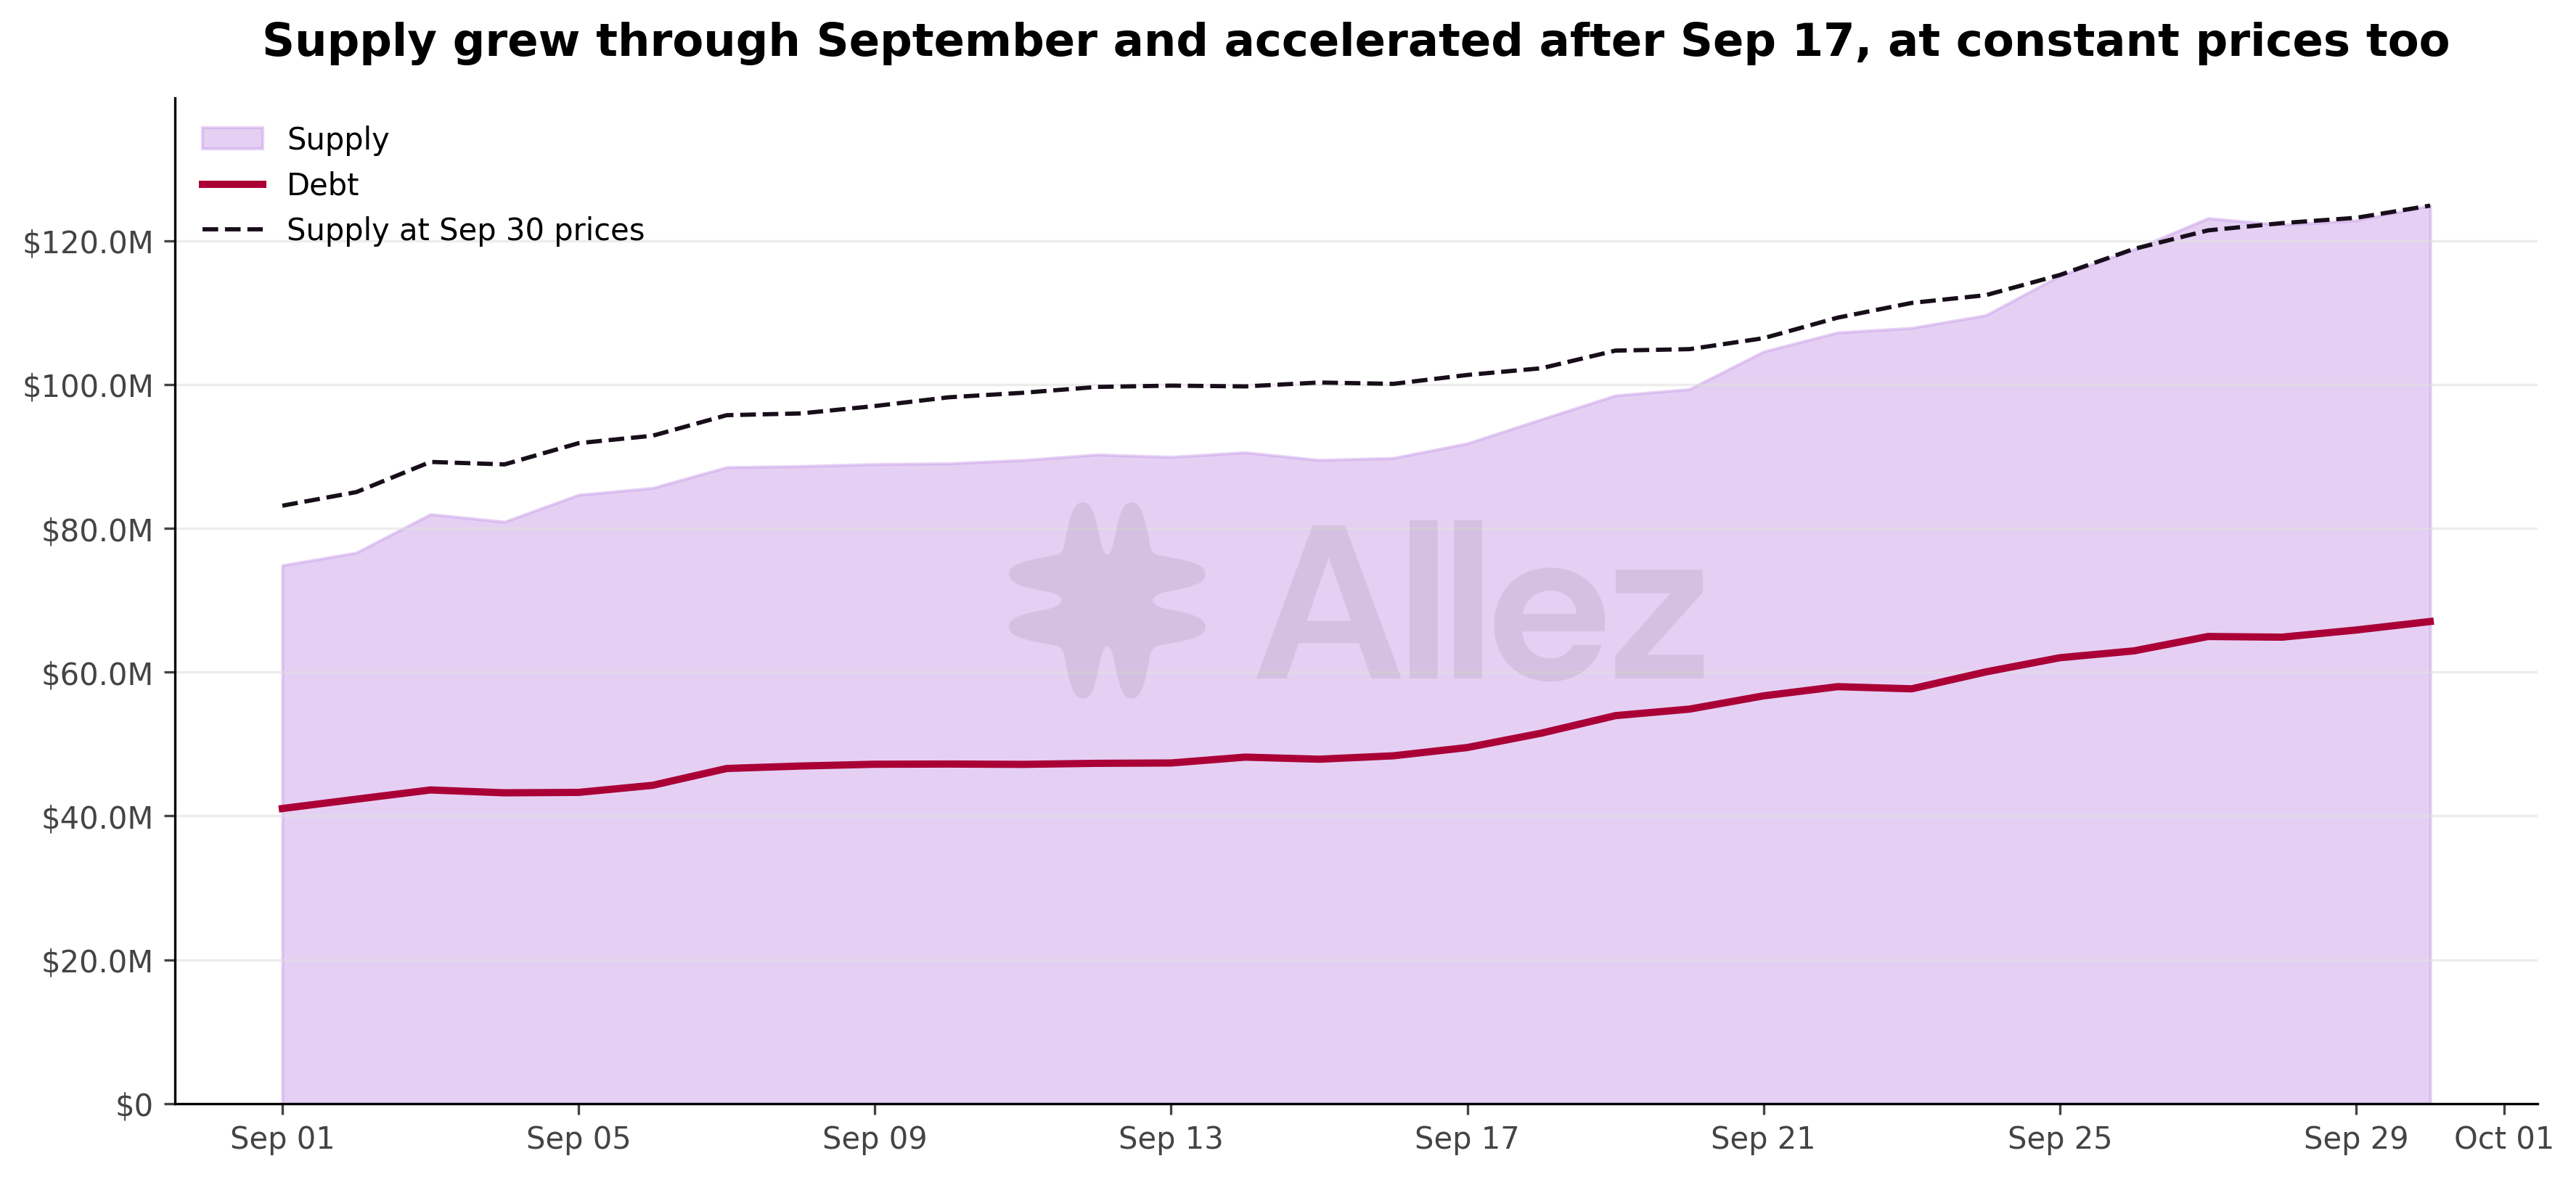
Supply grew through the month, crossing $90M on September 12, $100M on September 21 and $120M on September 27. The dashed line holds every token at its September 30 price. Its rise in the second half shows that most of the late-month increase came from new deposits, with the SUI rally adding the remainder.
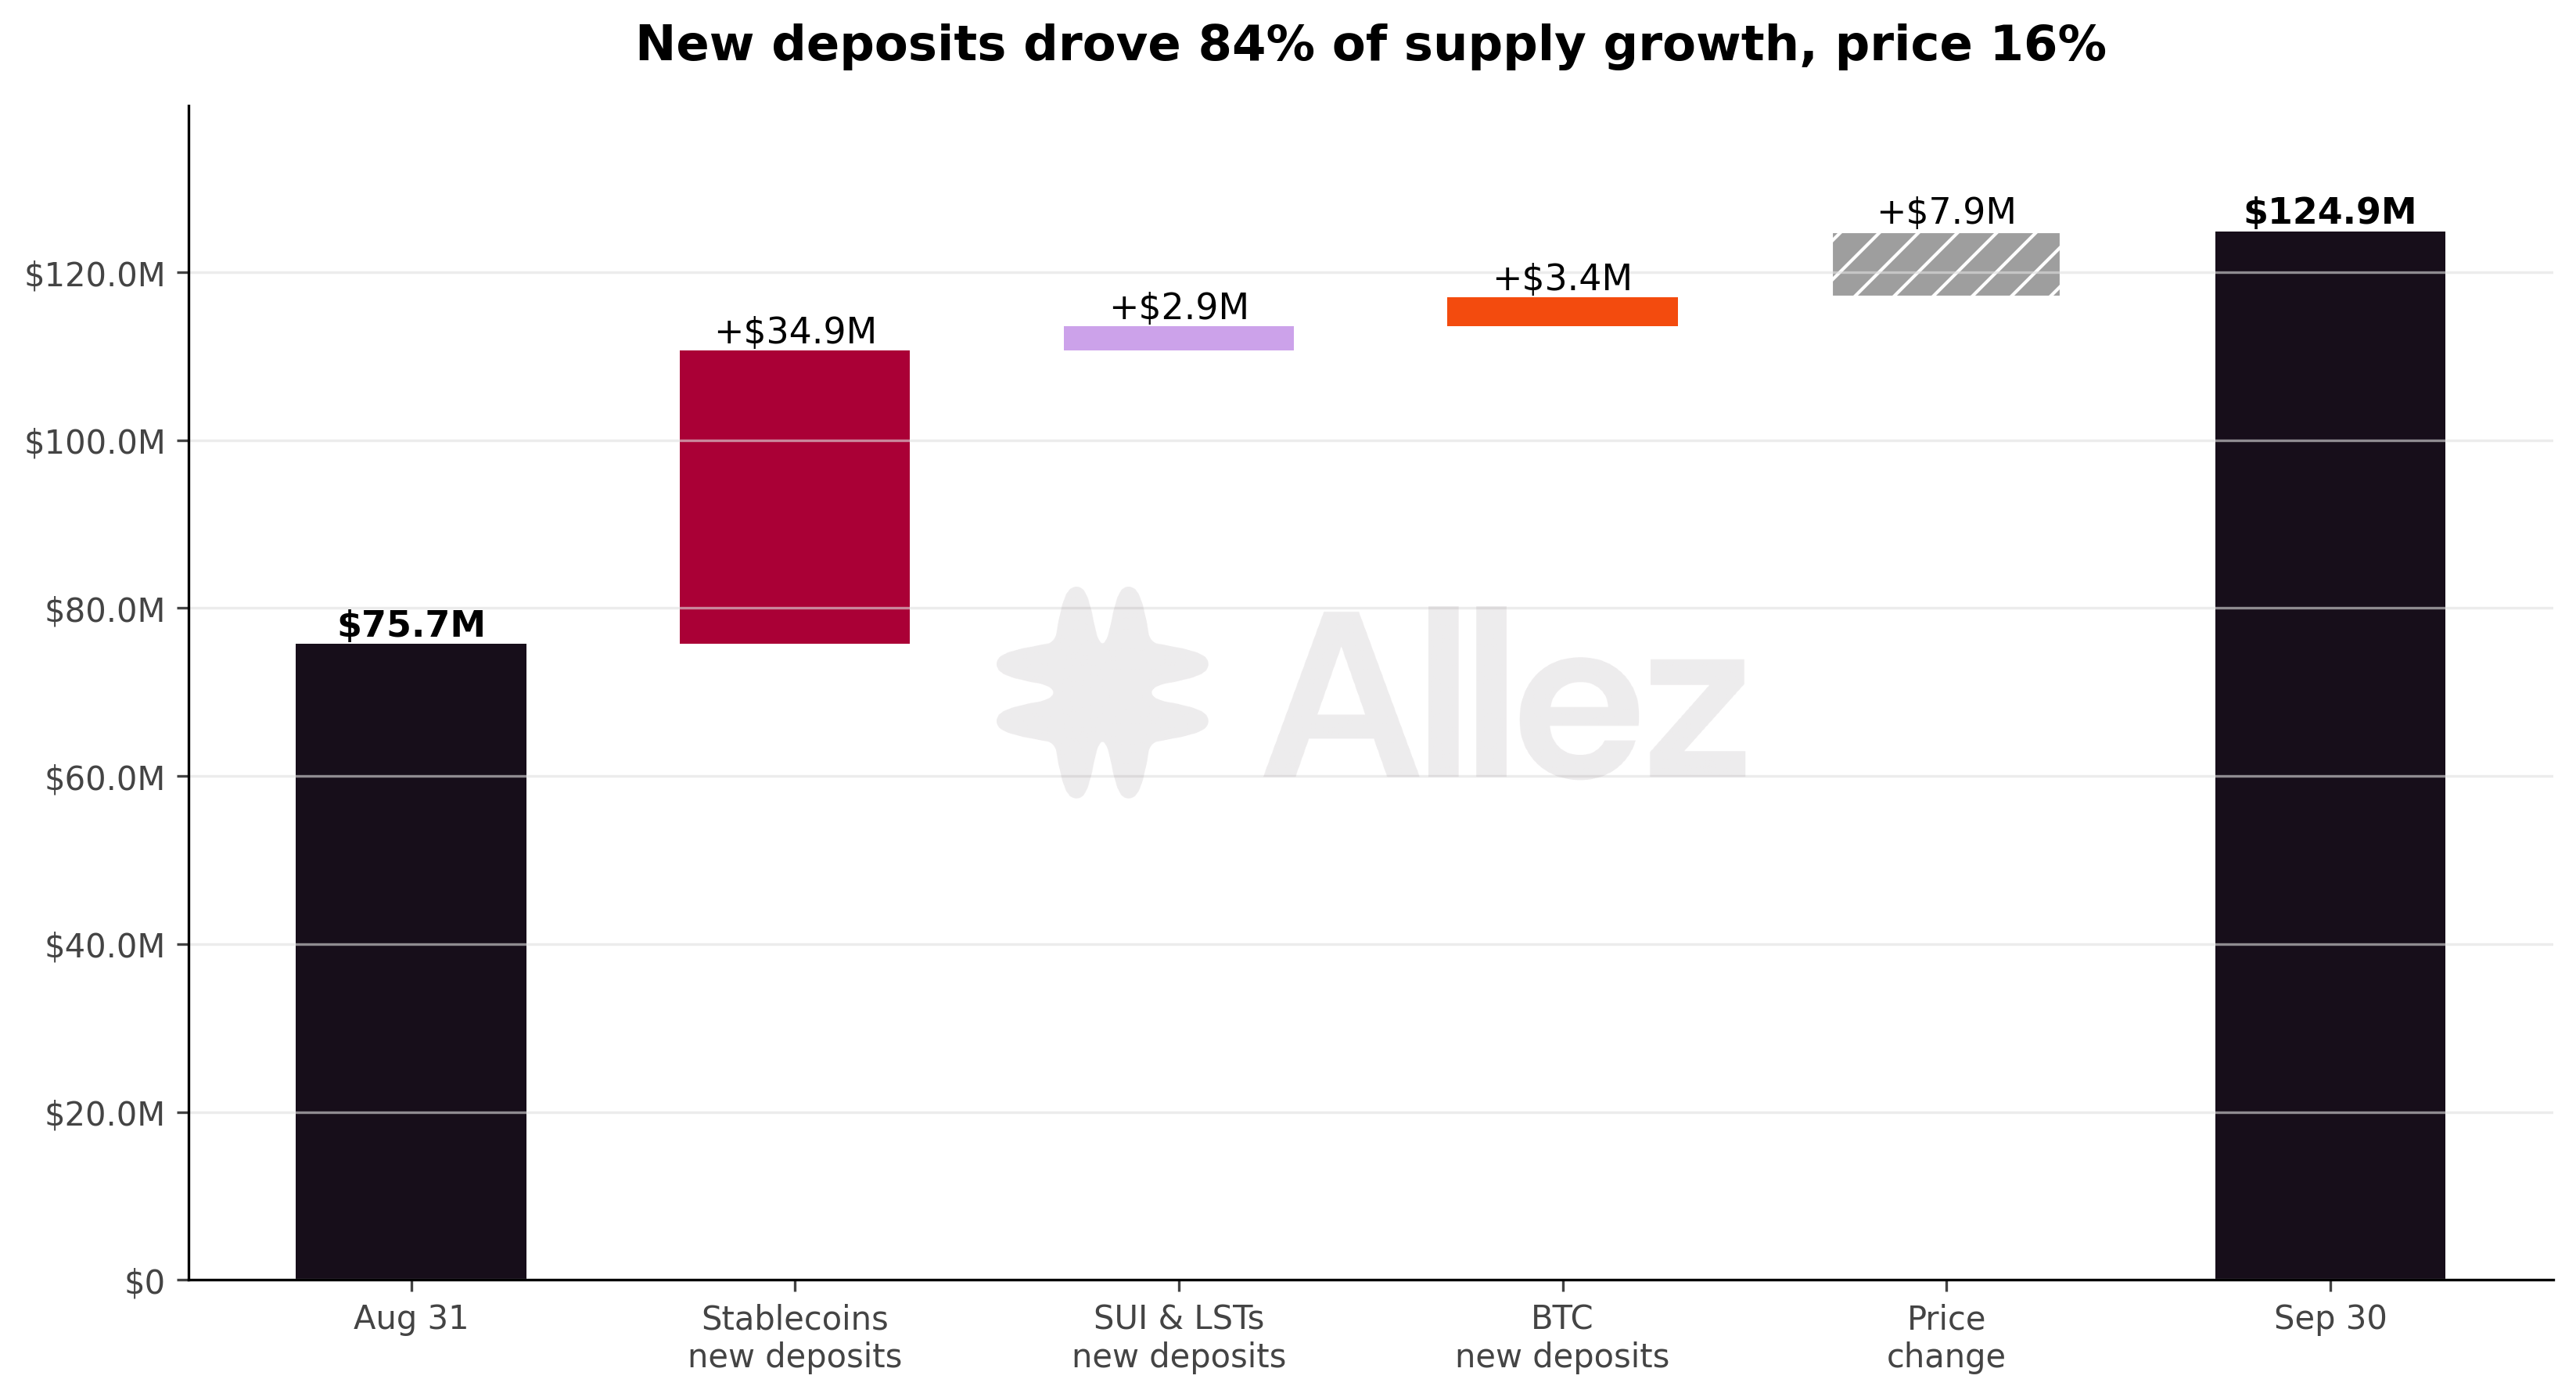
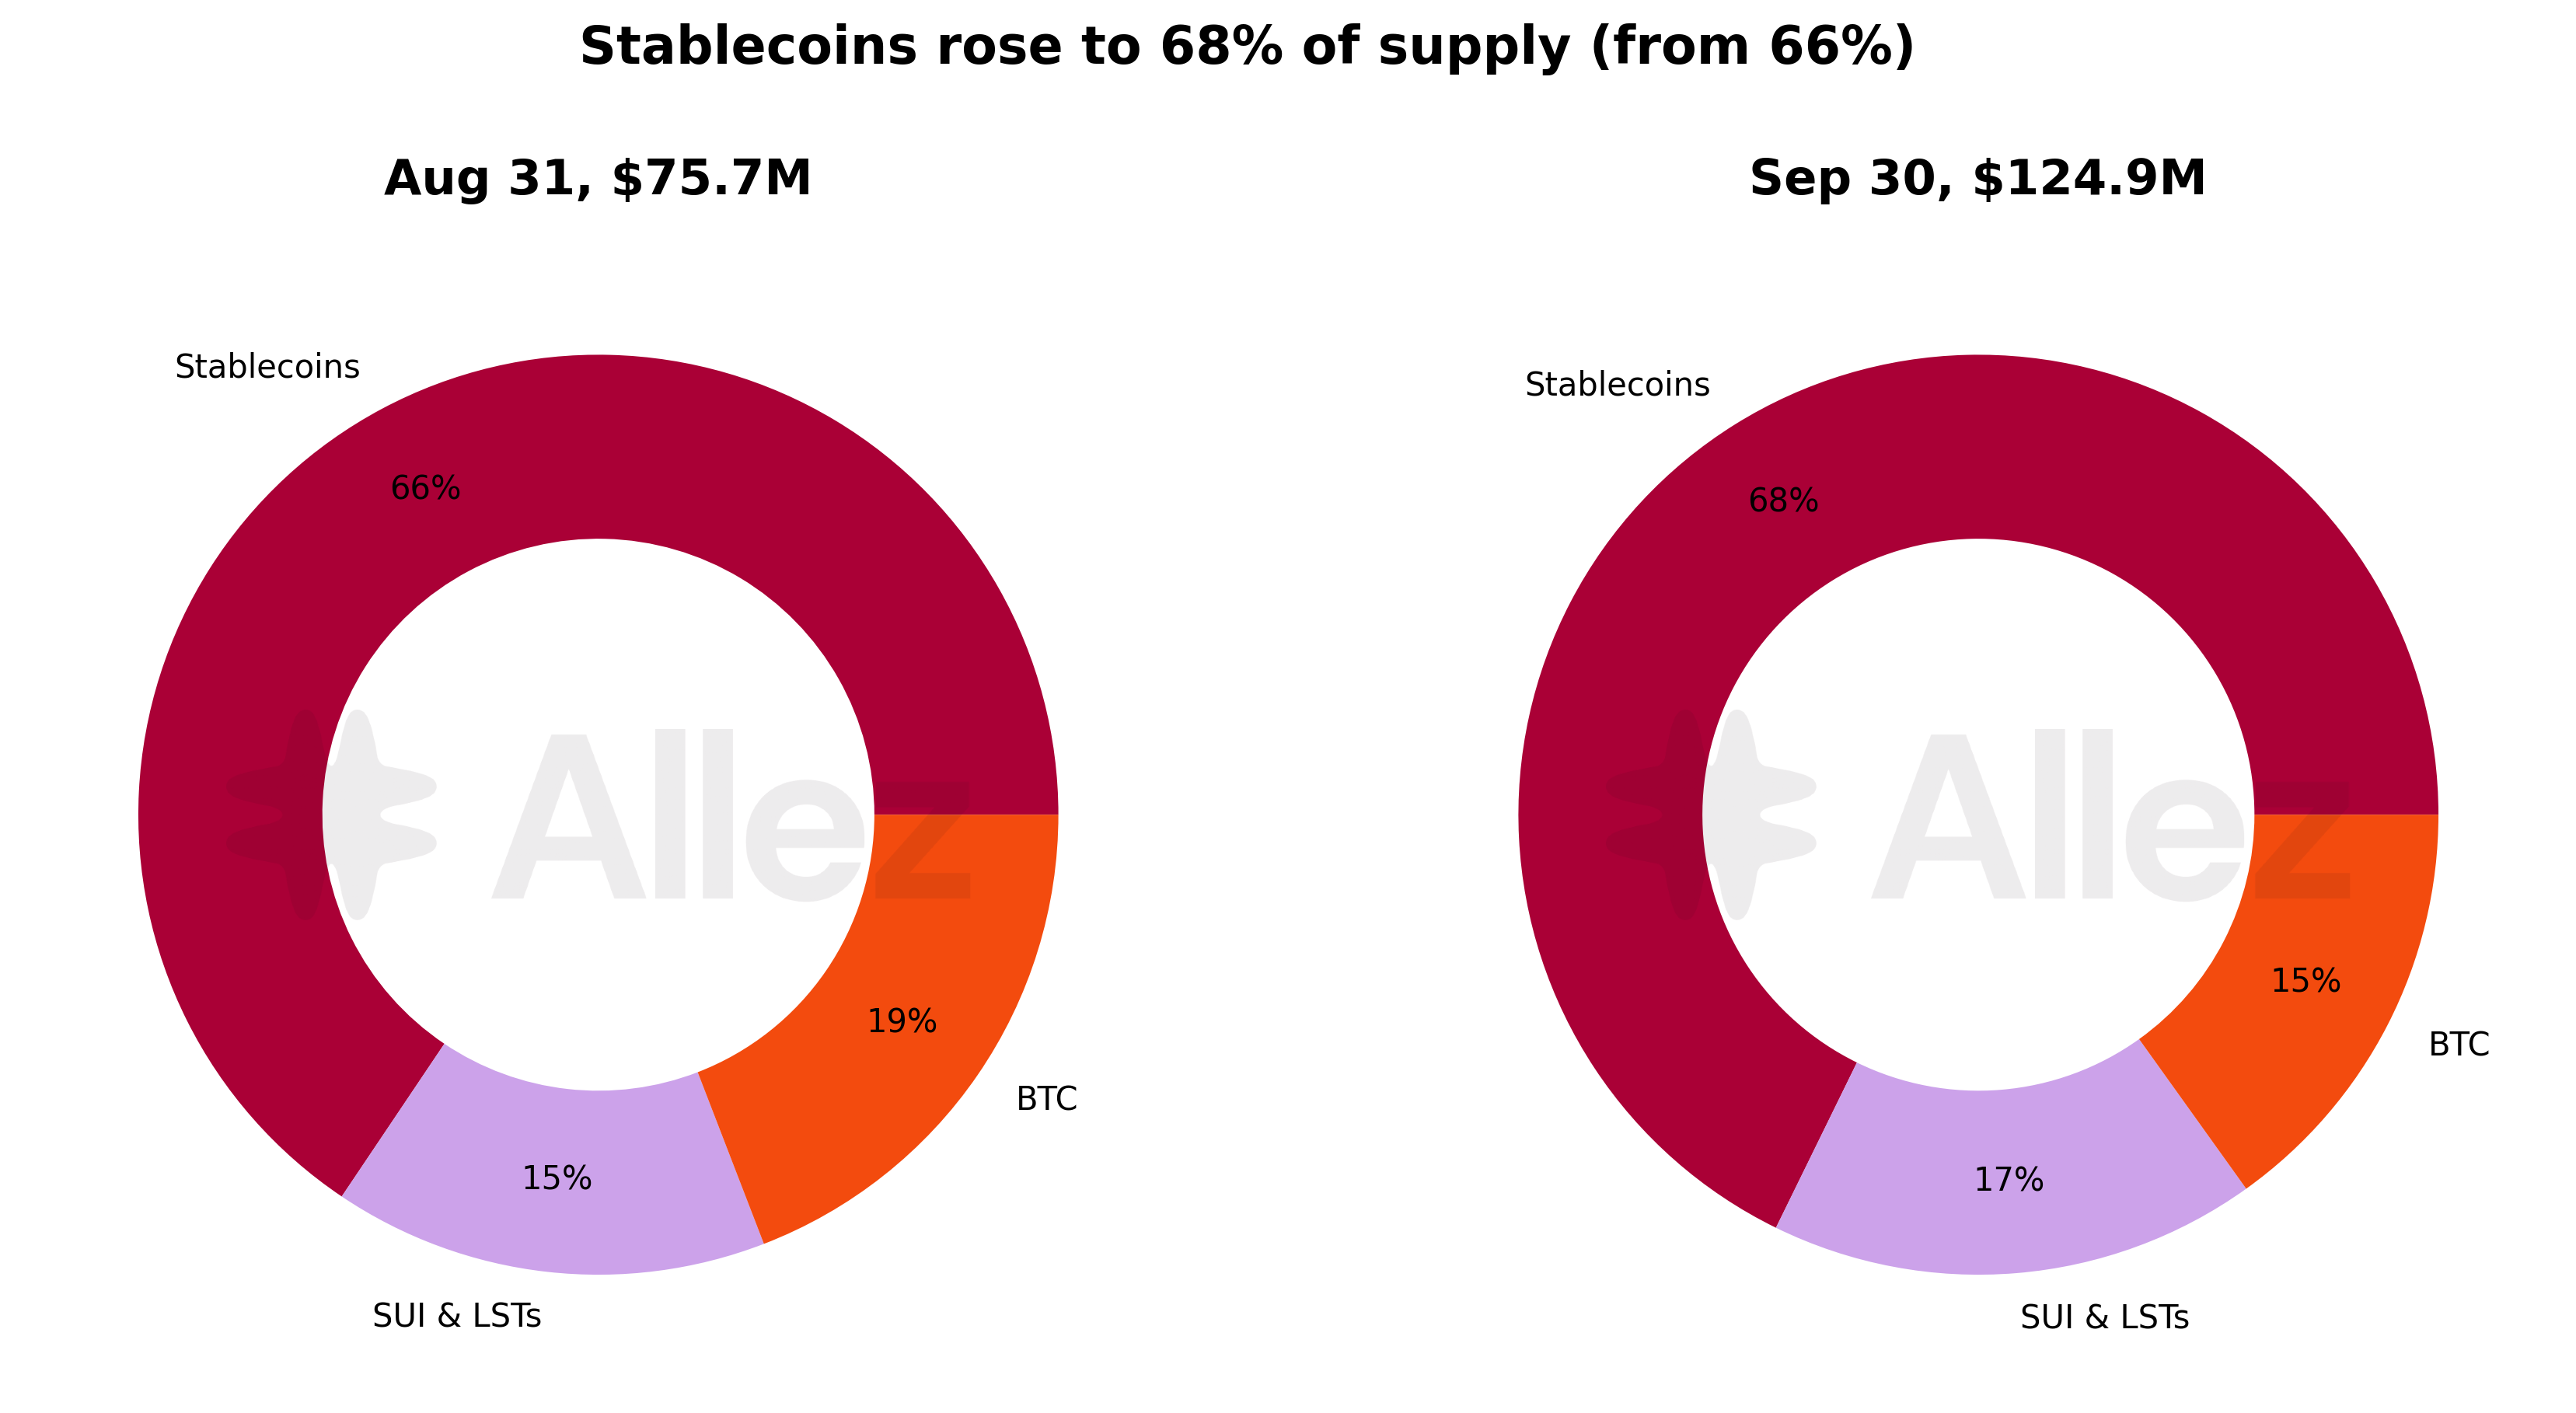
Of the $49.2M increase, $34.9M came from new stablecoin deposits, $3.4M from new BTC deposits and $2.9M from new SUI and LST deposits. Price changes added $7.9M, of which $6.9M came from SUI and haSUI balances already in place.
| Category | Aug 31 | Sep 30 | MoM | Share of supply |
|---|---|---|---|---|
| Stablecoins | $49.7M | $84.6M | +70.4% | 67.7% (+2.2pp) |
| SUI & LSTs | $11.6M | $21.4M | +85.0% | 17.1% (+1.9pp) |
| BTC | $14.5M | $18.9M | +30.2% | 15.1% (-4.0pp) |
Stablecoins grew fastest in token terms and raised their share of supply to 67.7%. BTC supply rose $4.4M, but its share fell 4.0pp as the other two categories grew faster.
Top reserves (Main market, September 30):
| Reserve | Supply | MoM | Debt | Utilization |
|---|---|---|---|---|
| USDC | $53.7M | +75% | $31.8M | 59% |
| usdSUI | $24.3M | +69% | $19.1M | 79% |
| svBTC | $16.4M | +26% | - | - |
| SUI | $13.9M | +84% | $11.8M | 85% |
| haSUI | $7.5M | +87% | - | - |
| USDT | $2.7M | +35% | $1.9M | 71% |
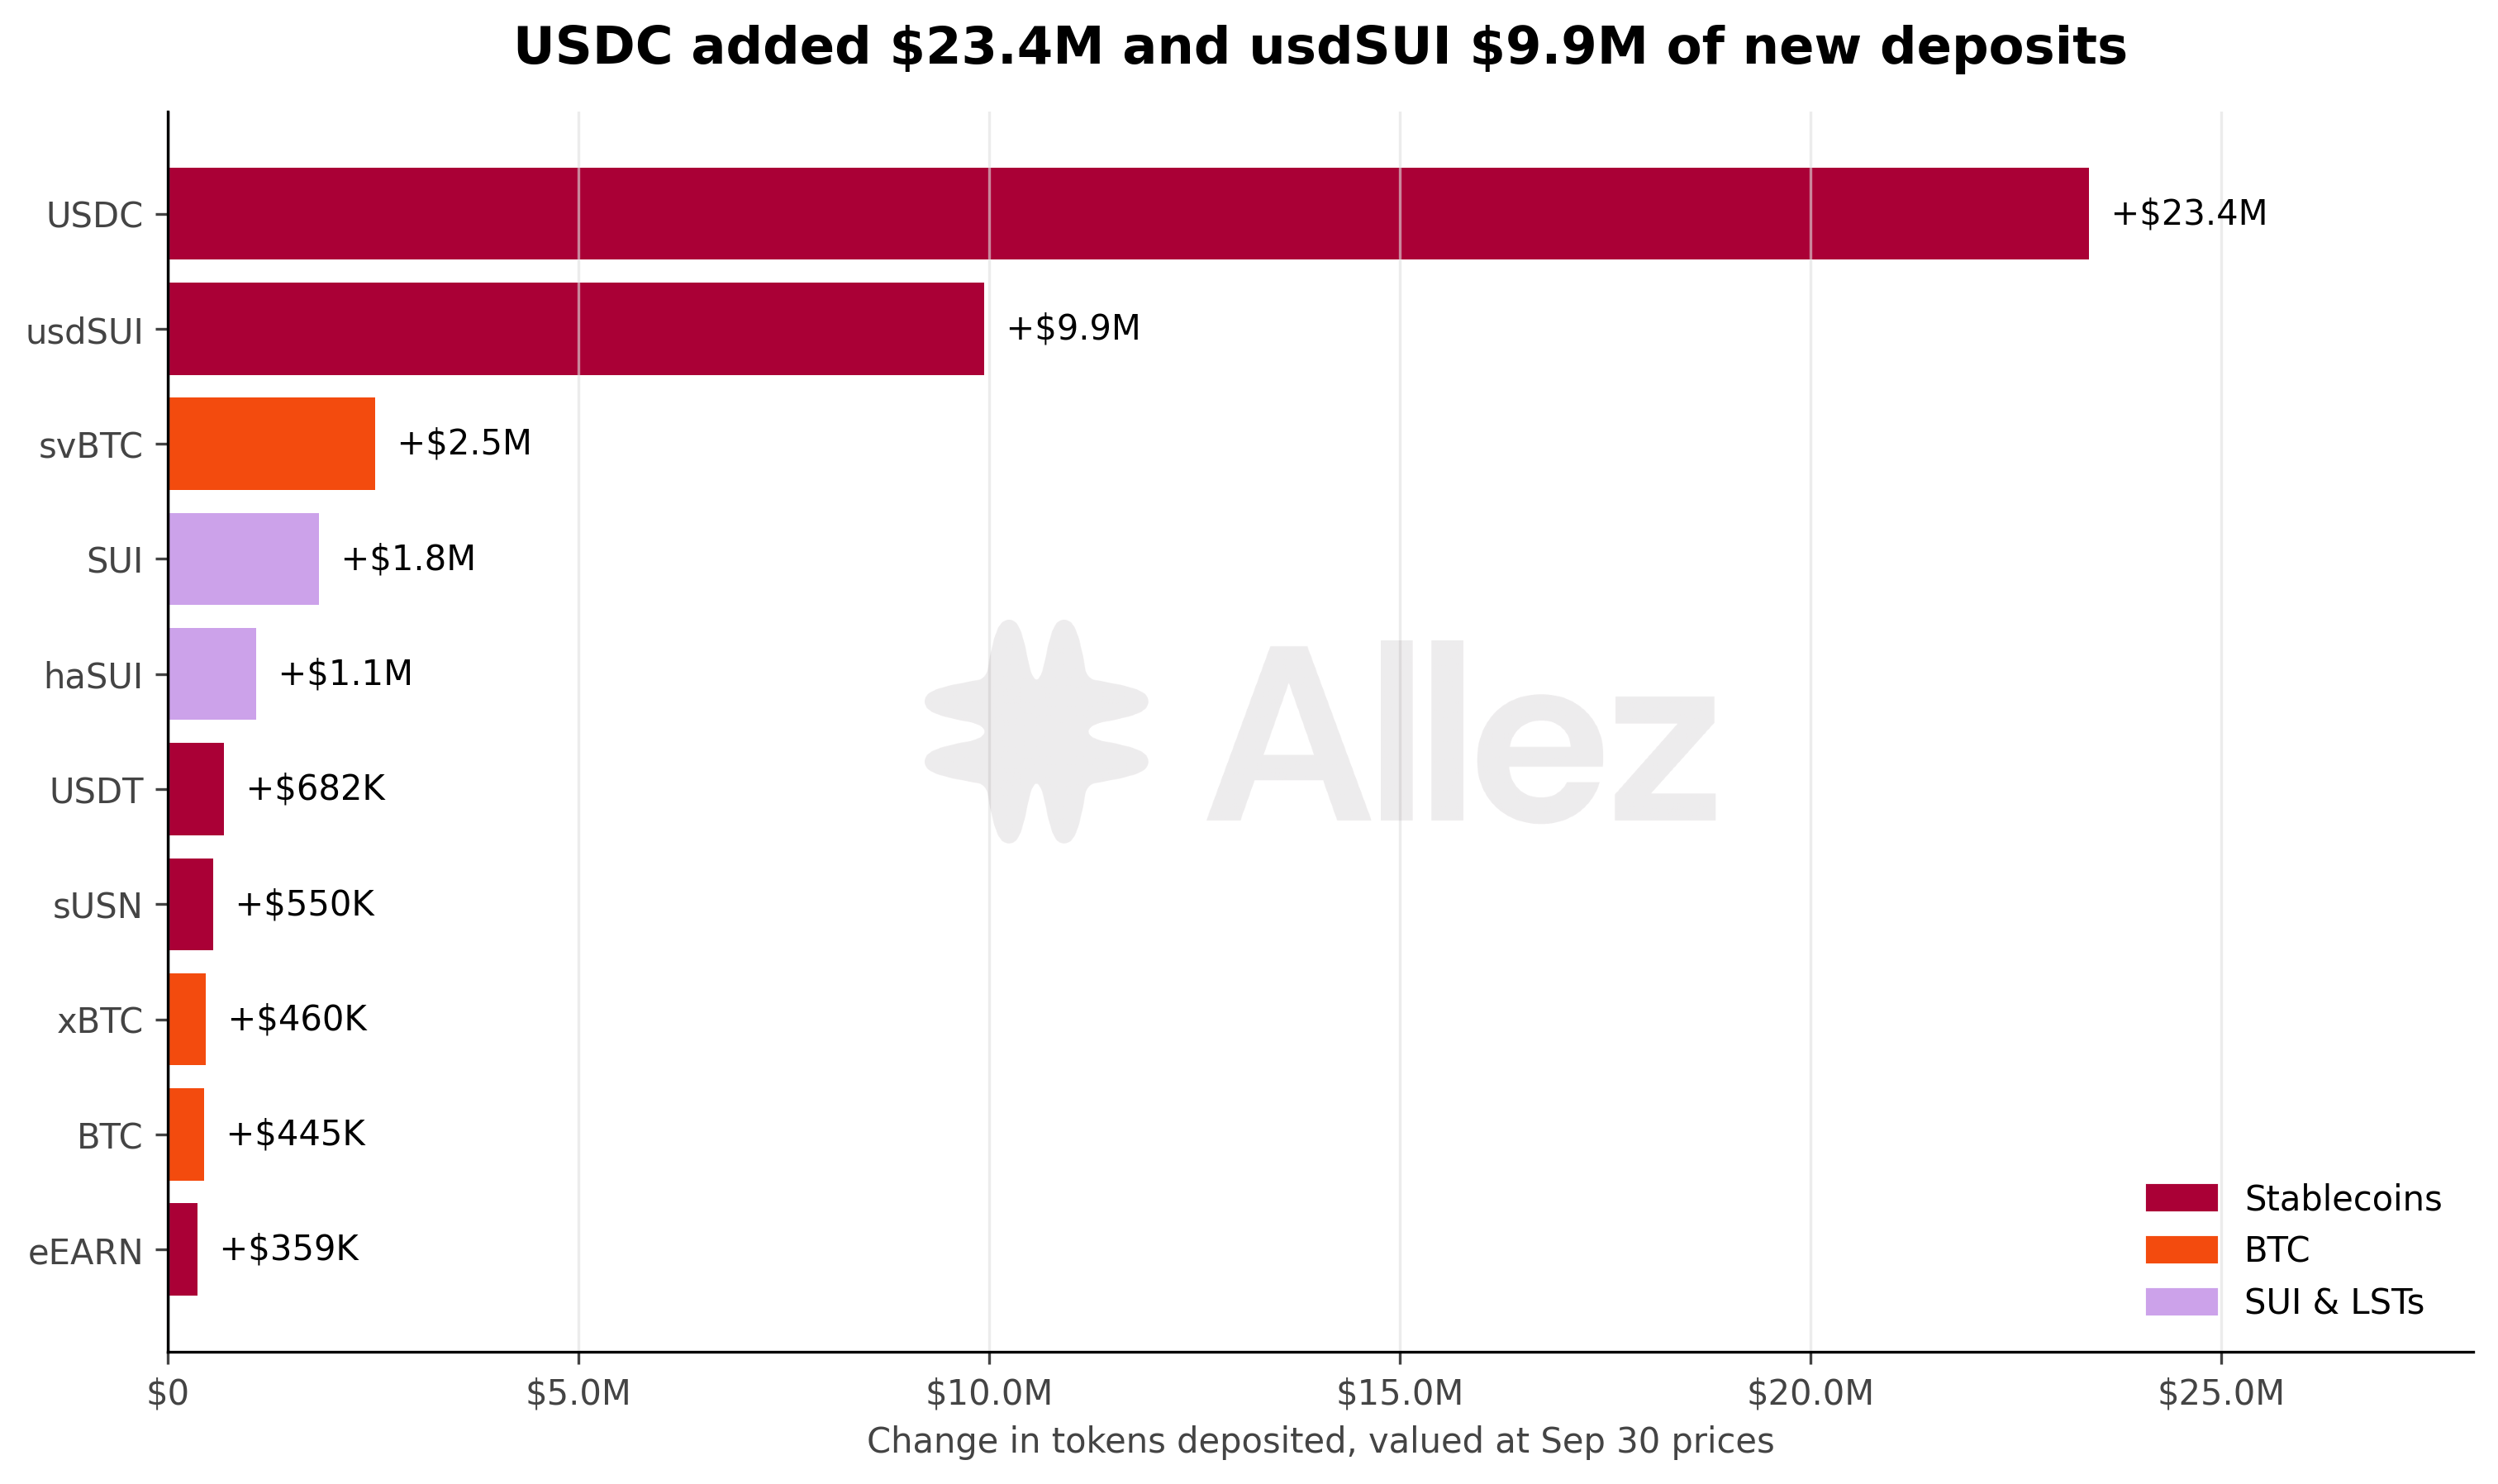
USDC added $23.1M of new deposits and usdSUI $9.9M while SUI and haSUI token counts grew 15% and 17%, so most of their 84% and 87% dollar gains came from price.
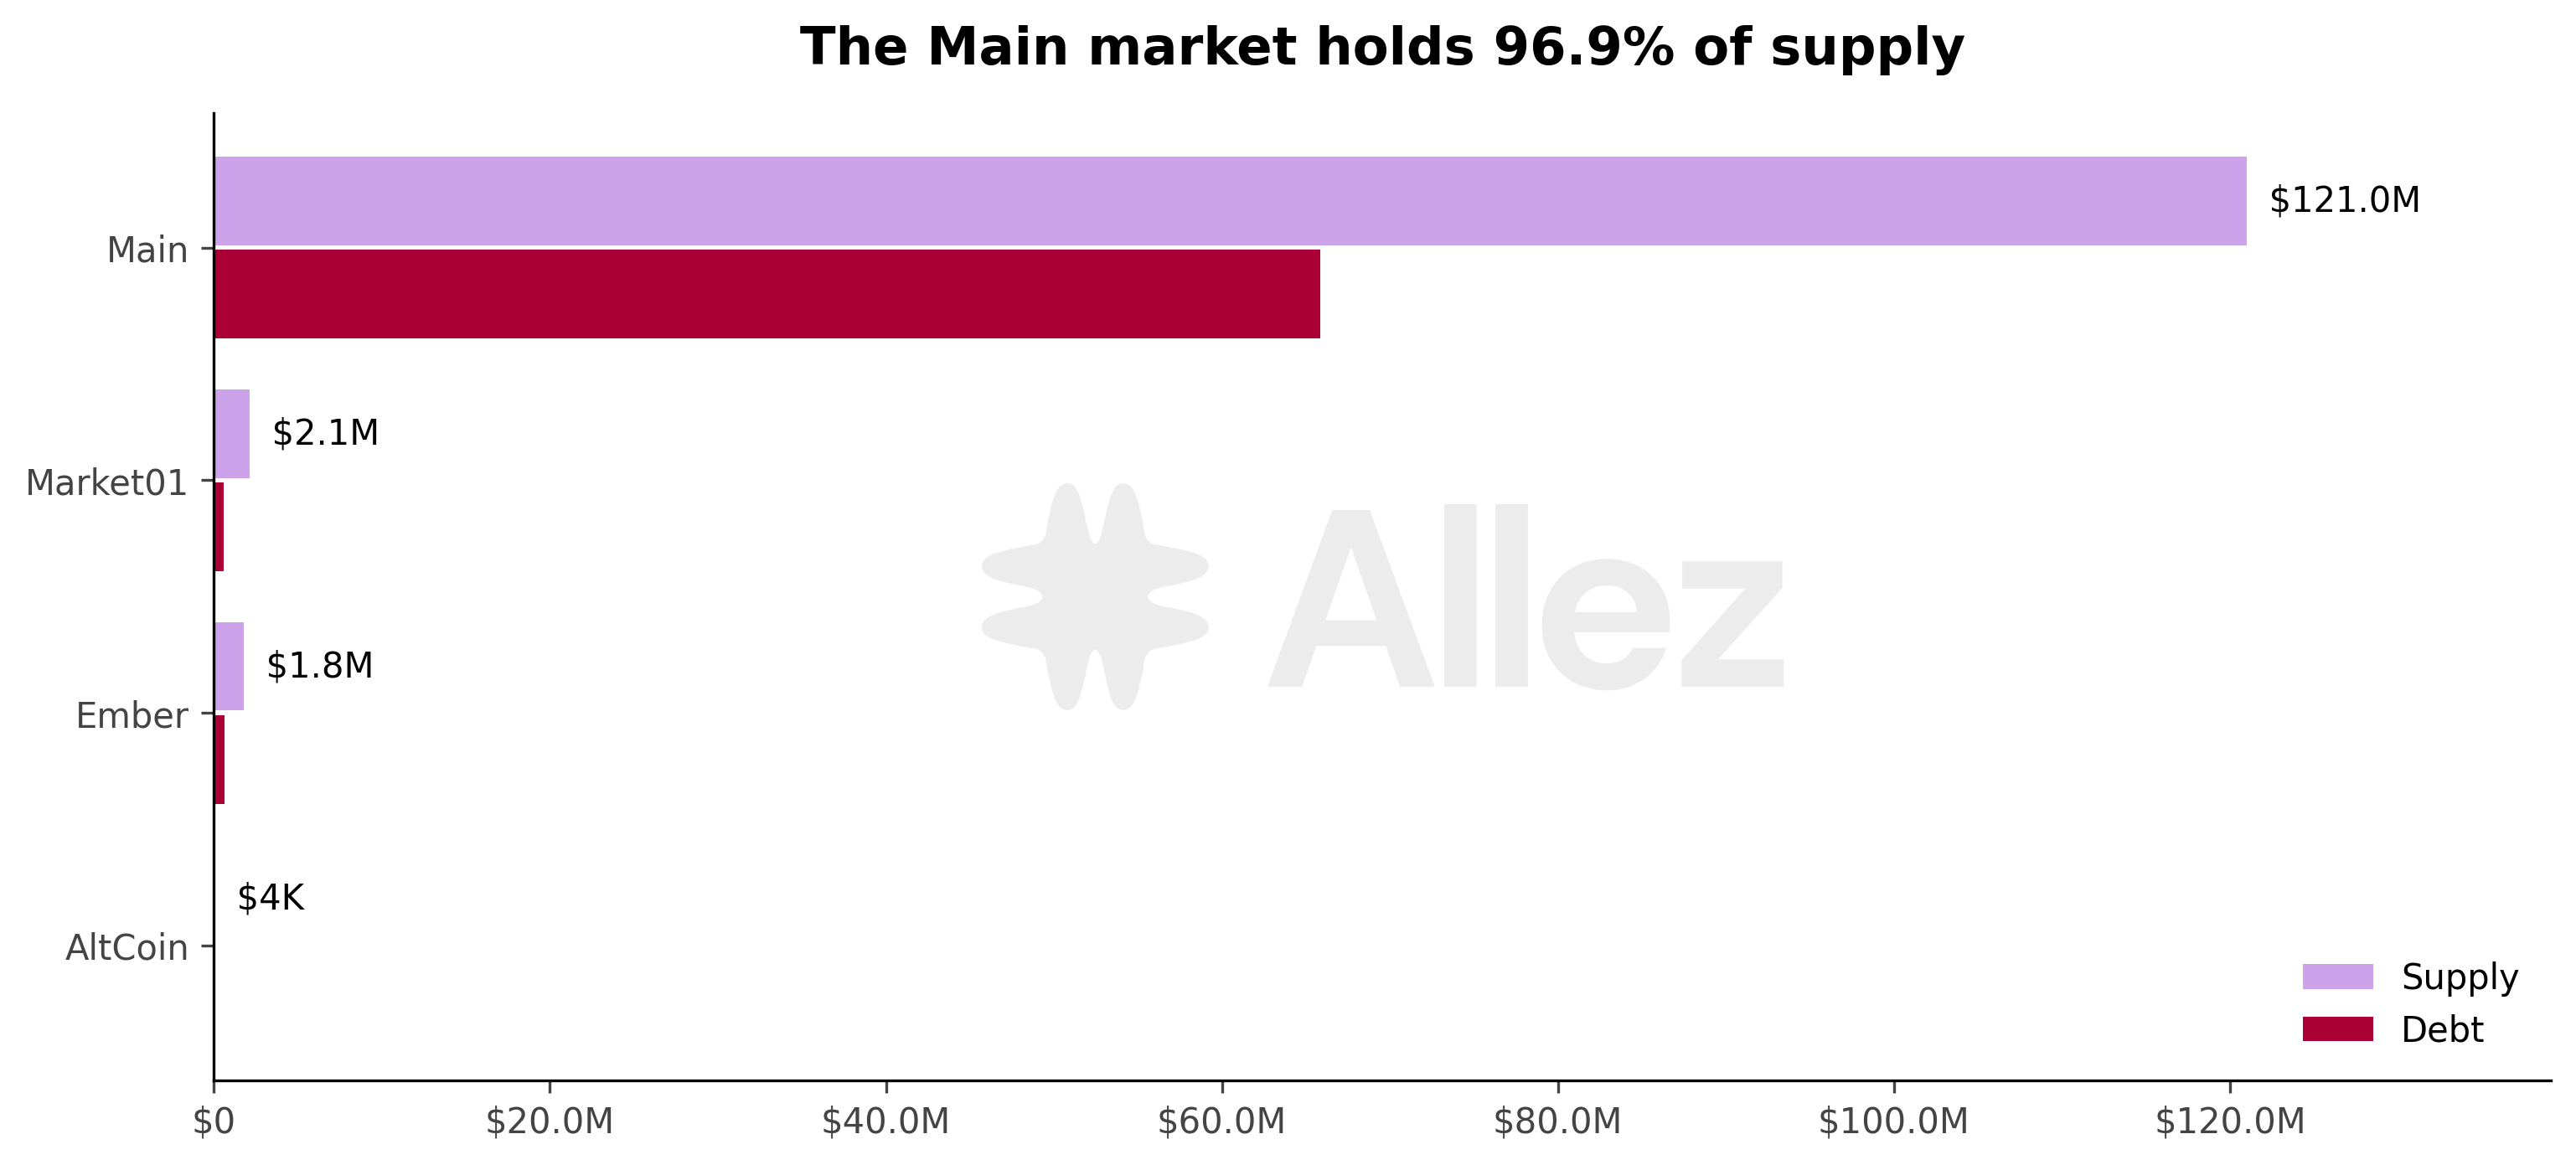
The Main market holds $121.0M of supply, 96.9% of the total. The sUSN market grew from $1.2M to $2.1M and Ember from $1.3M to $1.8M.
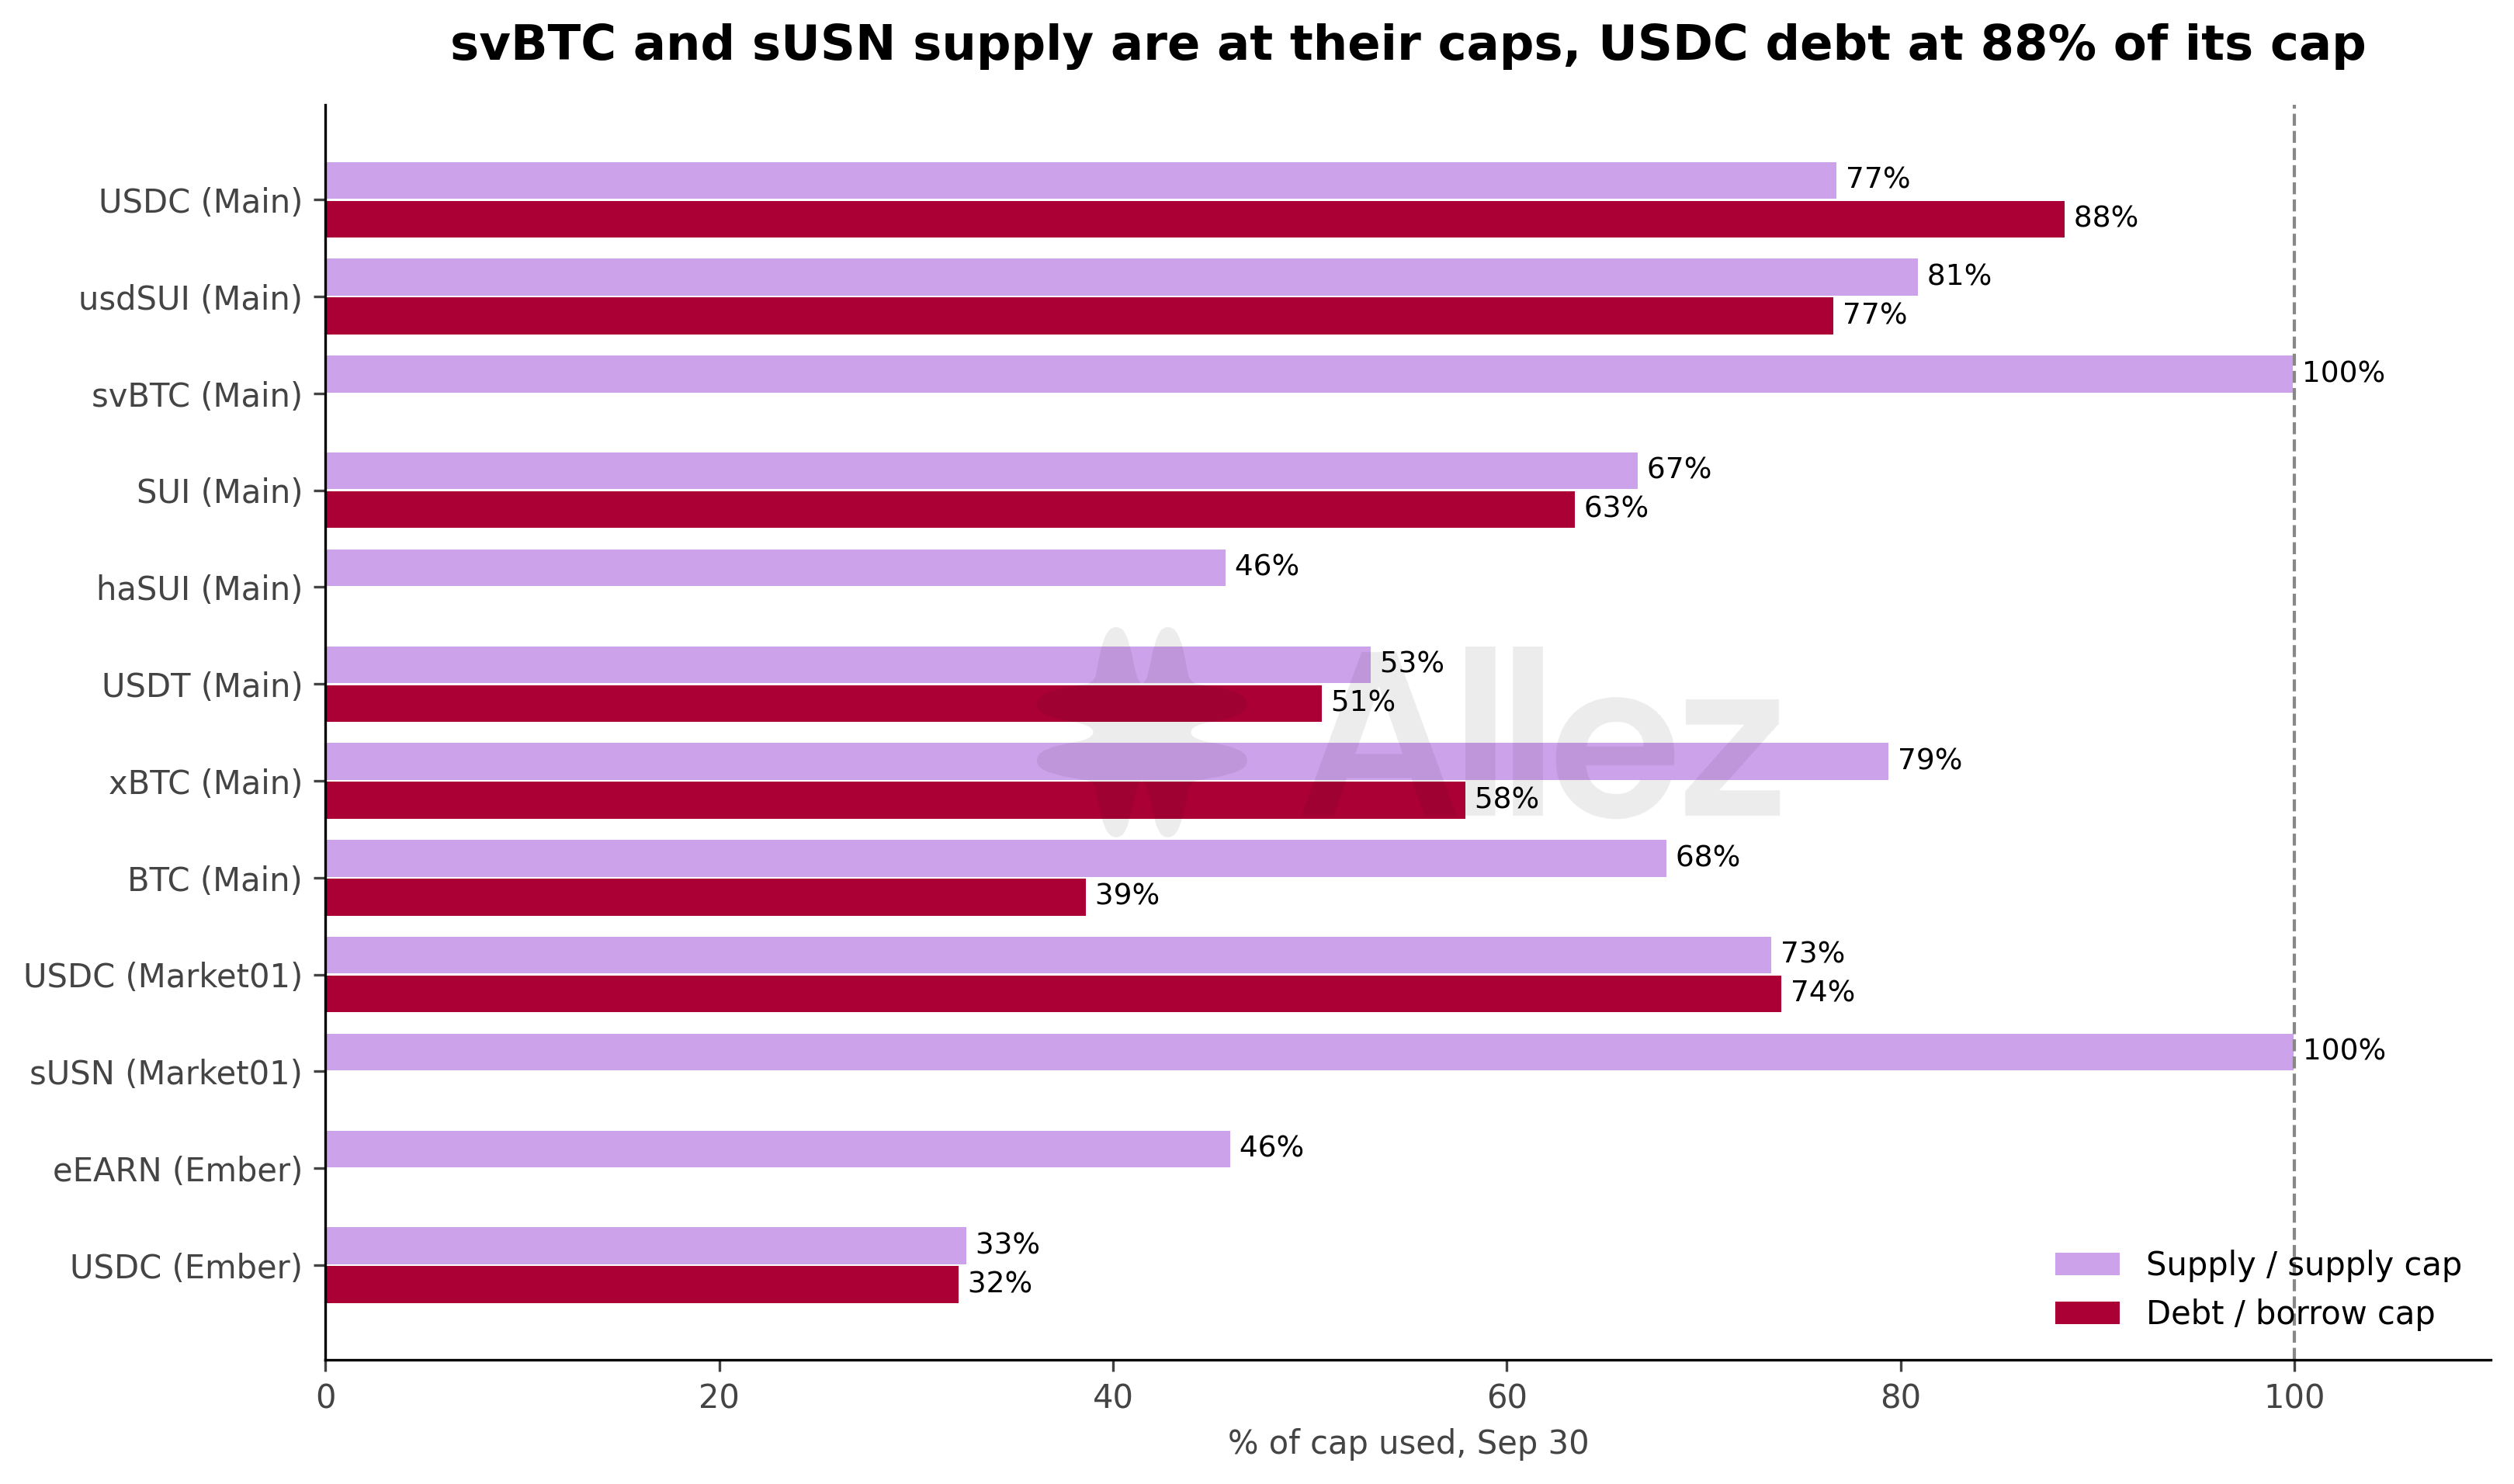
Cap changes in September:
| Date (UTC) | Market | Reserve | Supply cap | Borrow cap |
|---|---|---|---|---|
| Sep 5 | Main | svBTC | 165 to 195 svBTC | n/a |
| Sep 8 | Main | USDC | $40M to $50M | unchanged ($30M) |
| Sep 22 | Main | USDC | $50M to $70M | $30M to $36M |
| Sep 22 | Main | usdSUI | $20M to $30M | $15M to $25M |
| Sep 23 | sUSN | sUSN | 500K to 818K sUSN | n/a |
| Sep 23 | sUSN | USDC | $0.8M to $1.5M | $0.63M to $0.75M |
| Sep 25 | Main | SUI | 15M to 18M SUI | 13M to 16M SUI |
| Sep 25 | Main | BTC, xBTC | 100 to 20 (each) | 50 to 15 (each) |
| Sep 25 | Main | LBTC | 40 to 10 LBTC | n/a |
| Sep 26 to 27 | Main | SUI | unchanged | borrowing paused (01:00 Sep 26 to 04:00 Sep 27) |
3. Growth Drivers
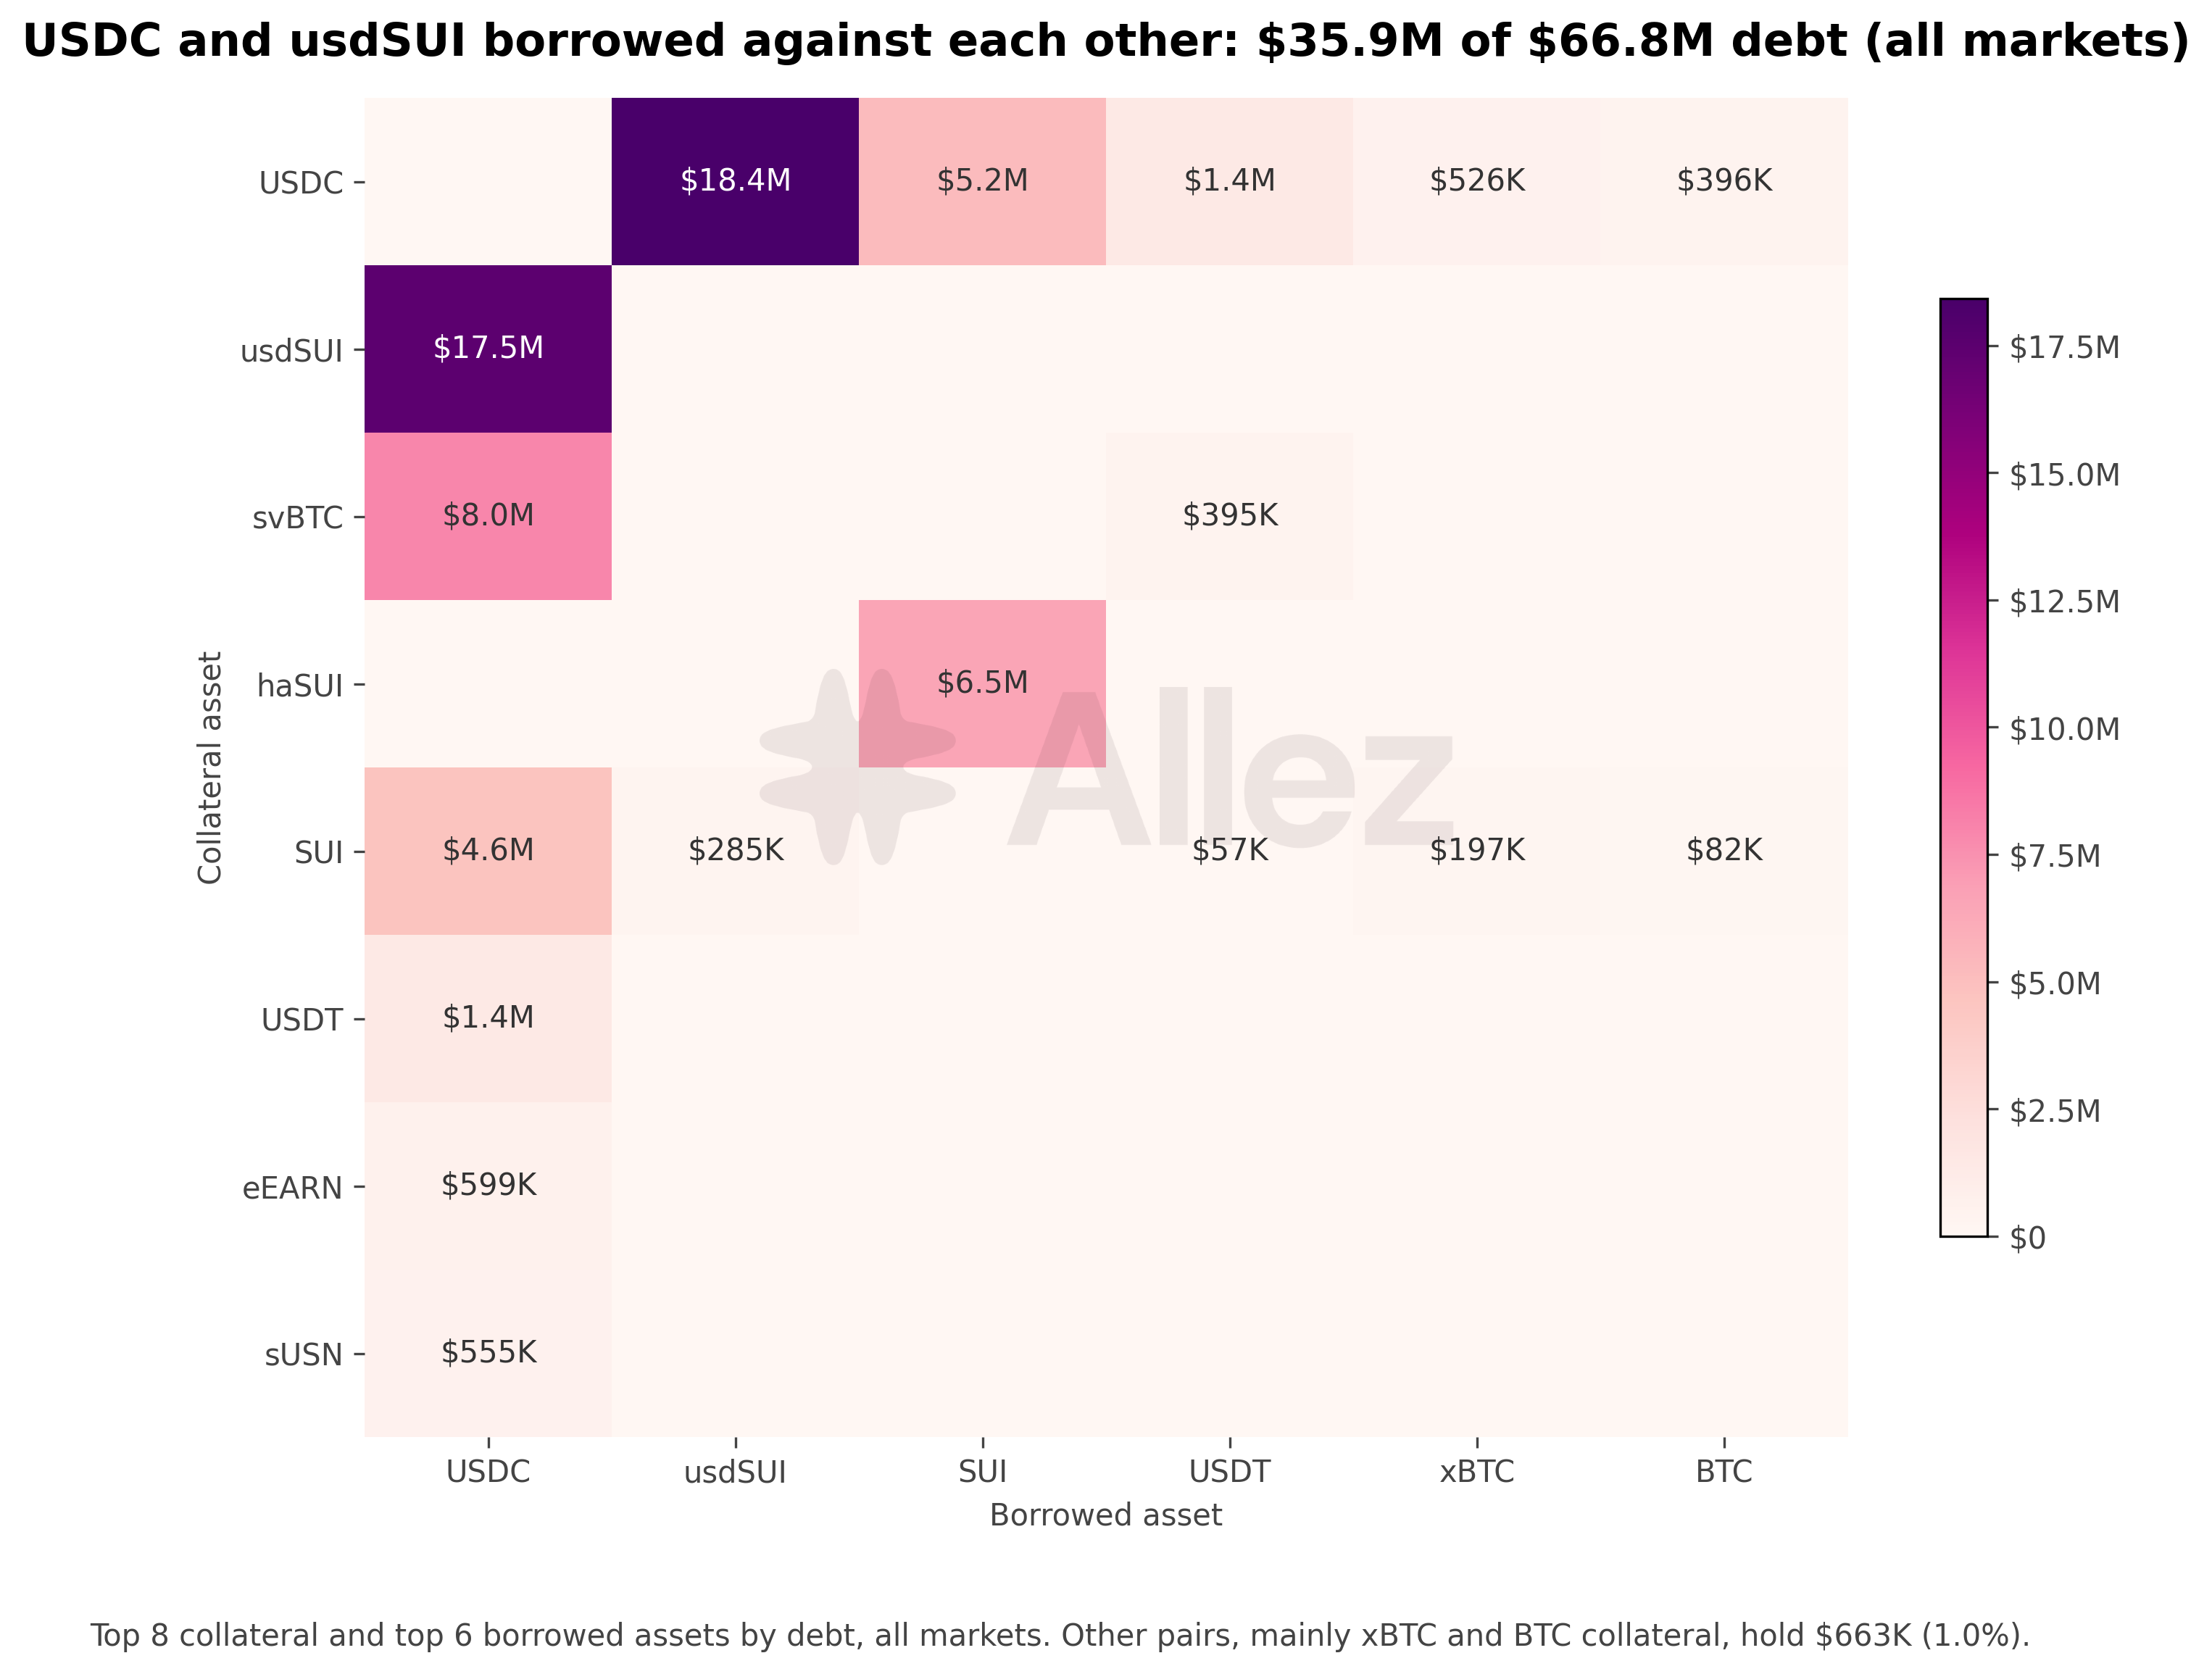
Stablecoin pairs represent a majority of the debt across all markets. USDC collateral against usdSUI debt holds $18.4M and usdSUI collateral against USDC debt $17.5M, together $35.9M (from $22.4M on August 31). Debt in both stablecoin e-mode groups roughly doubled: usdSUI to USDC from $4.6M to $10.0M, and USDC to usdSUI from $2.6M to $5.6M.
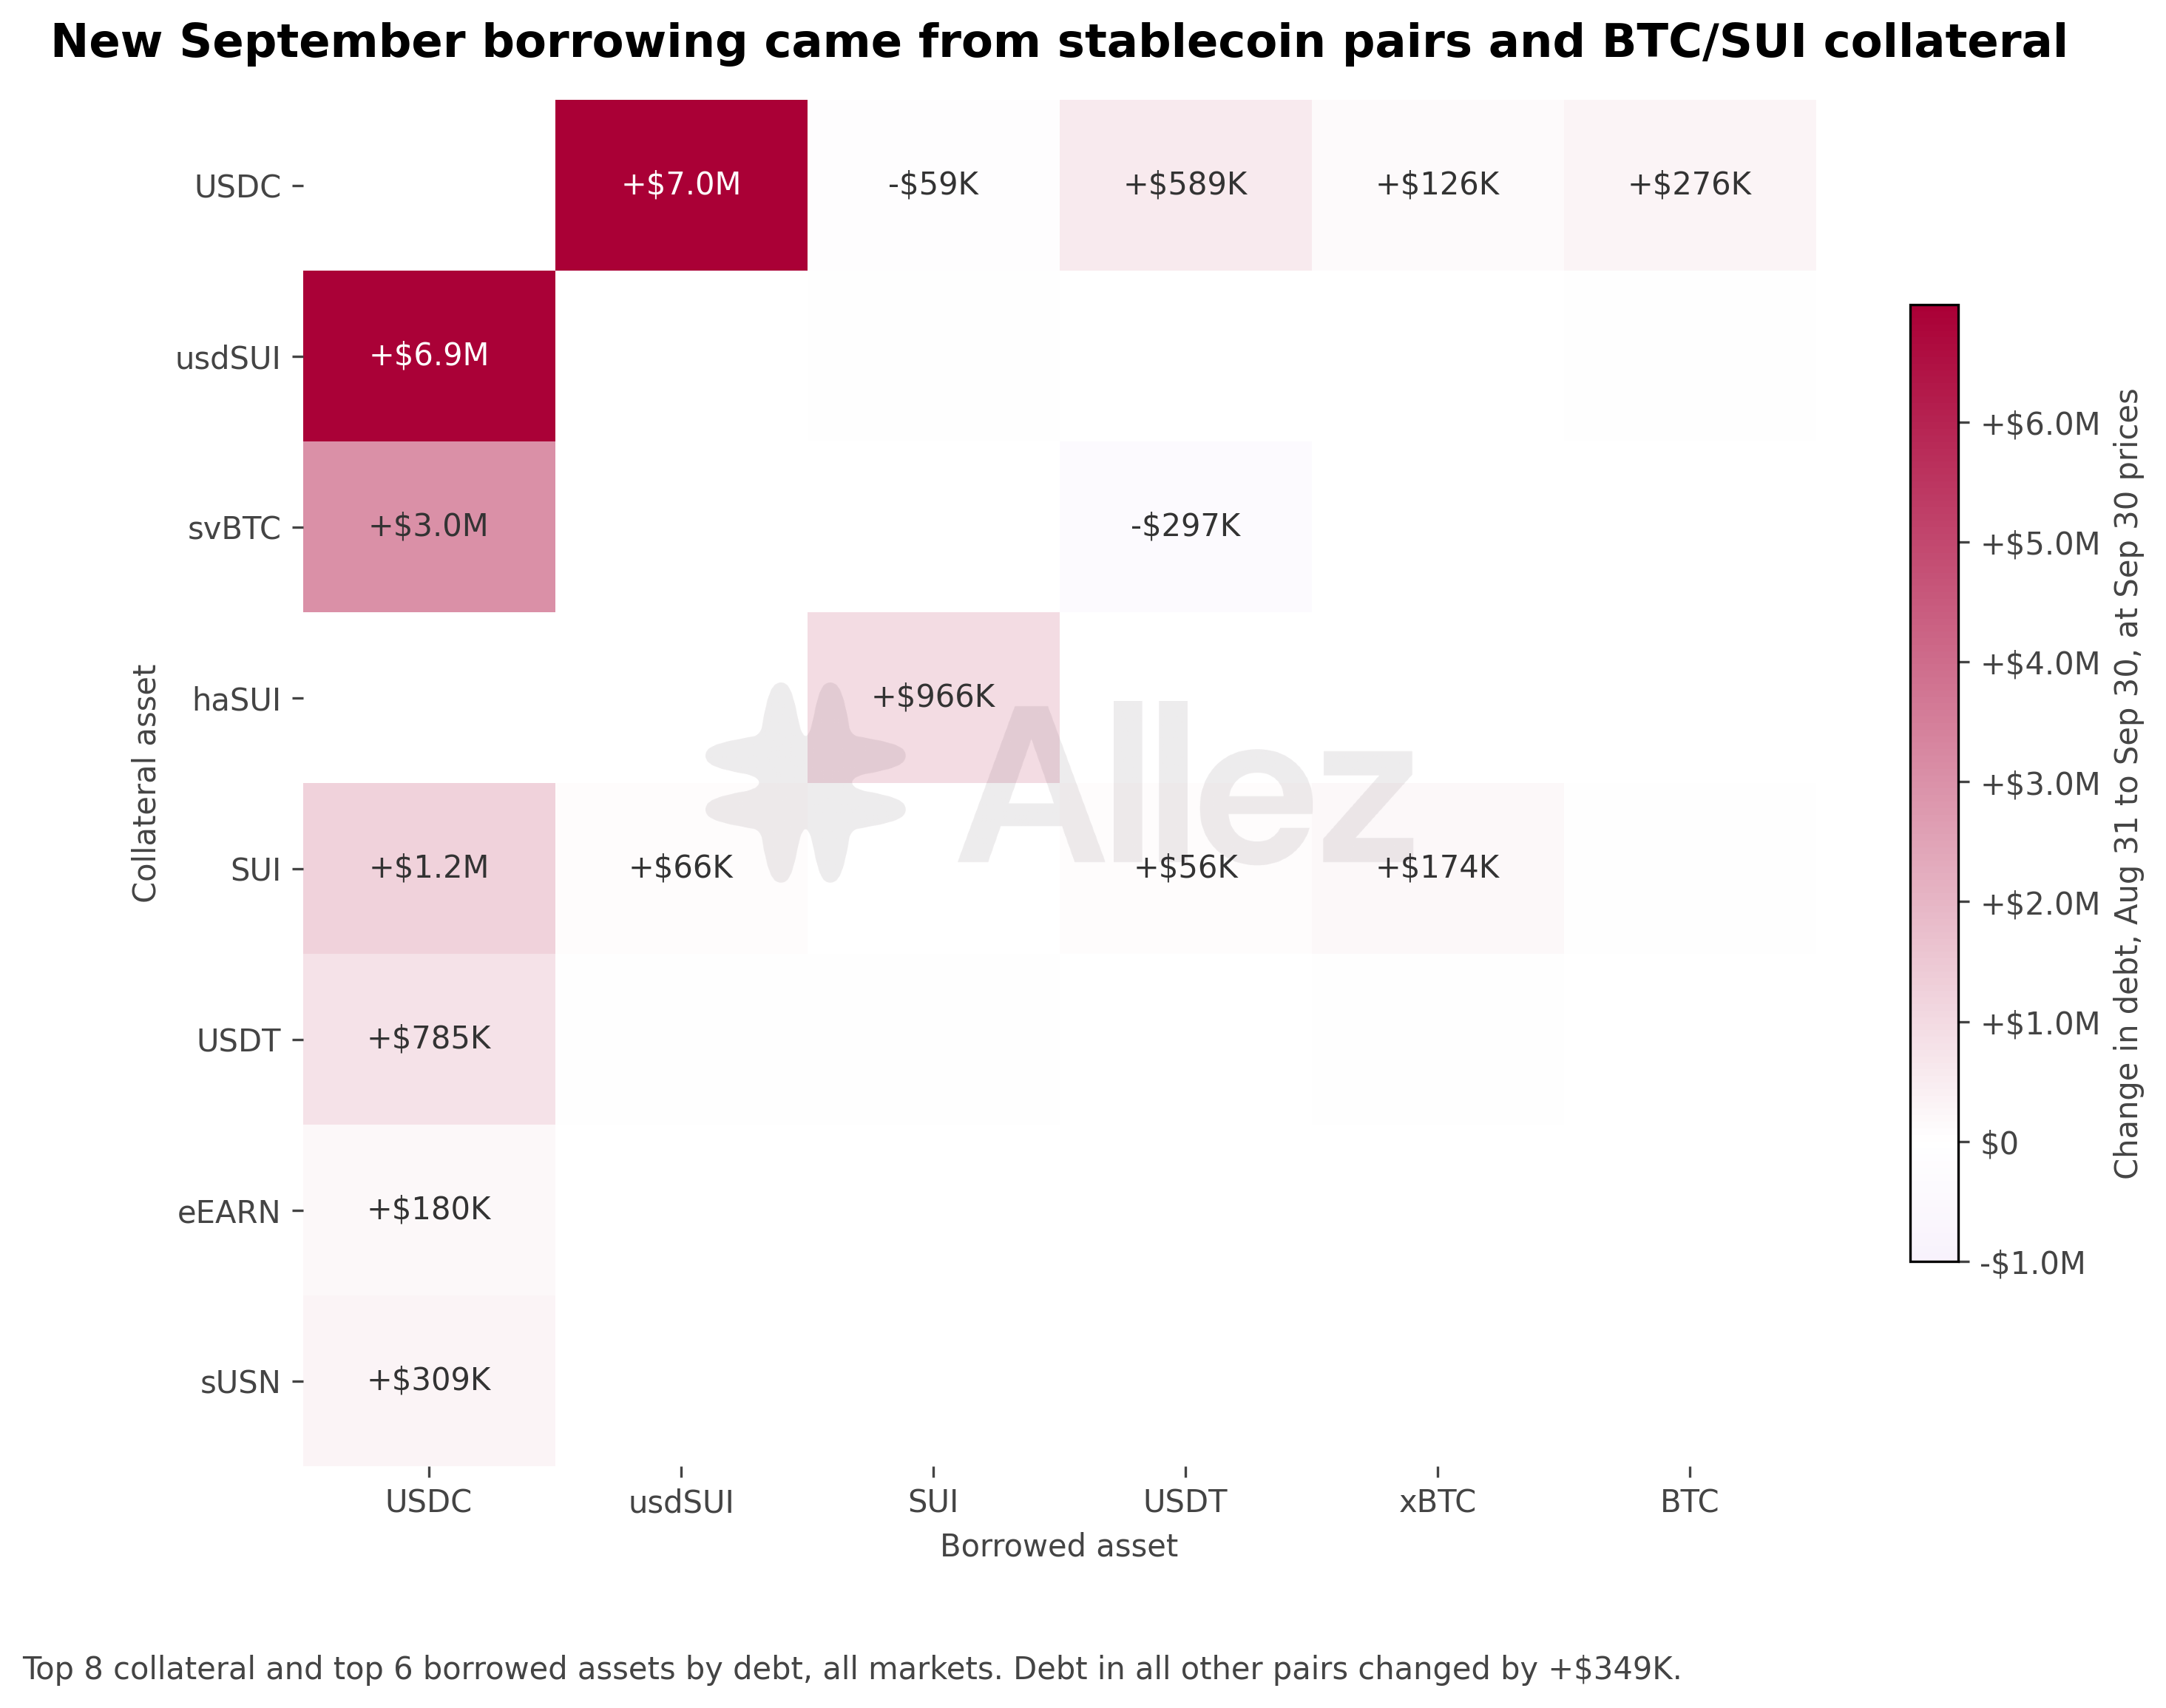
At September 30 prices, debt across all markets grew $21.7M. Stablecoin pairs added about two thirds of it while USDC collateral against SUI debt was flat, so its dollar rise came from the SUI price.
4. Liquidation Risk and Position Health
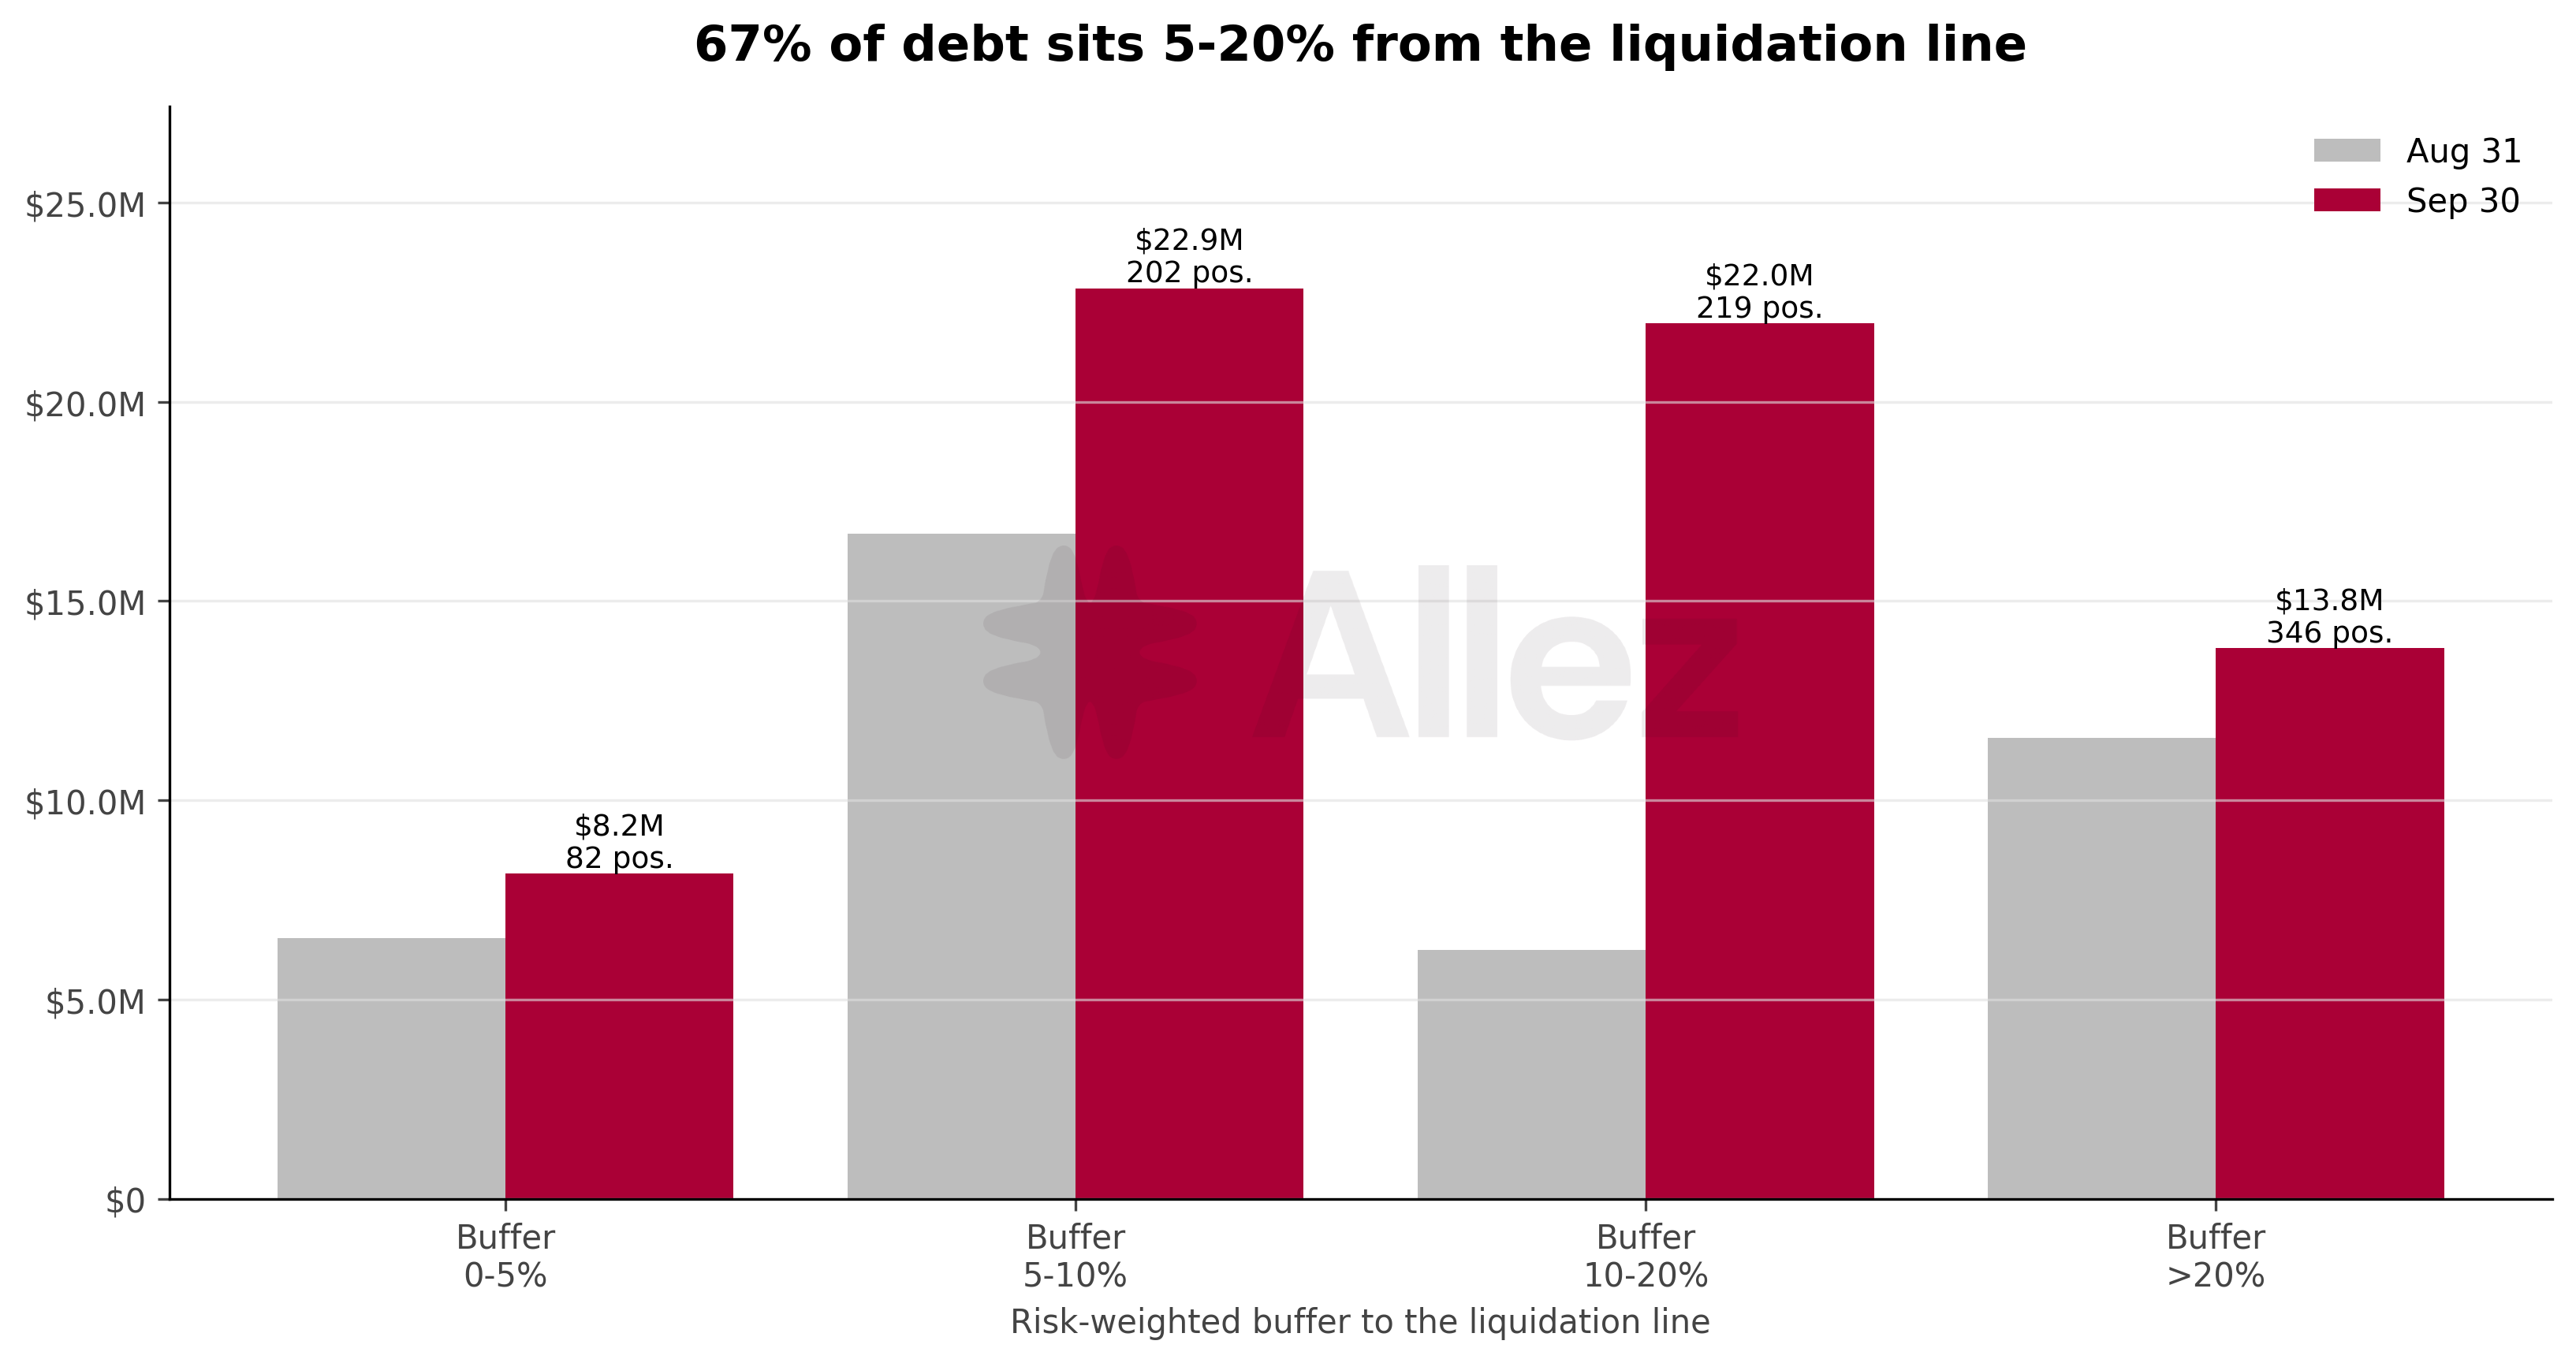
| Buffer to the liquidation line | Positions | Debt | Aug 31 debt |
|---|---|---|---|
| 0 to 5% | 82 | $8.16M | $6.53M |
| 5 to 10% | 202 | $22.85M | $16.68M |
| 10 to 20% | 219 | $21.98M | $6.24M |
| Above 20% | 346 | $13.81M | $11.58M |
The buffer is the risk-weighted distance to the liquidation line, valued at market prices with the protocol's collateral and borrow weights. Debt in the 10 to 20% tier rose from $6.24M to $21.98M, the largest move of the month.
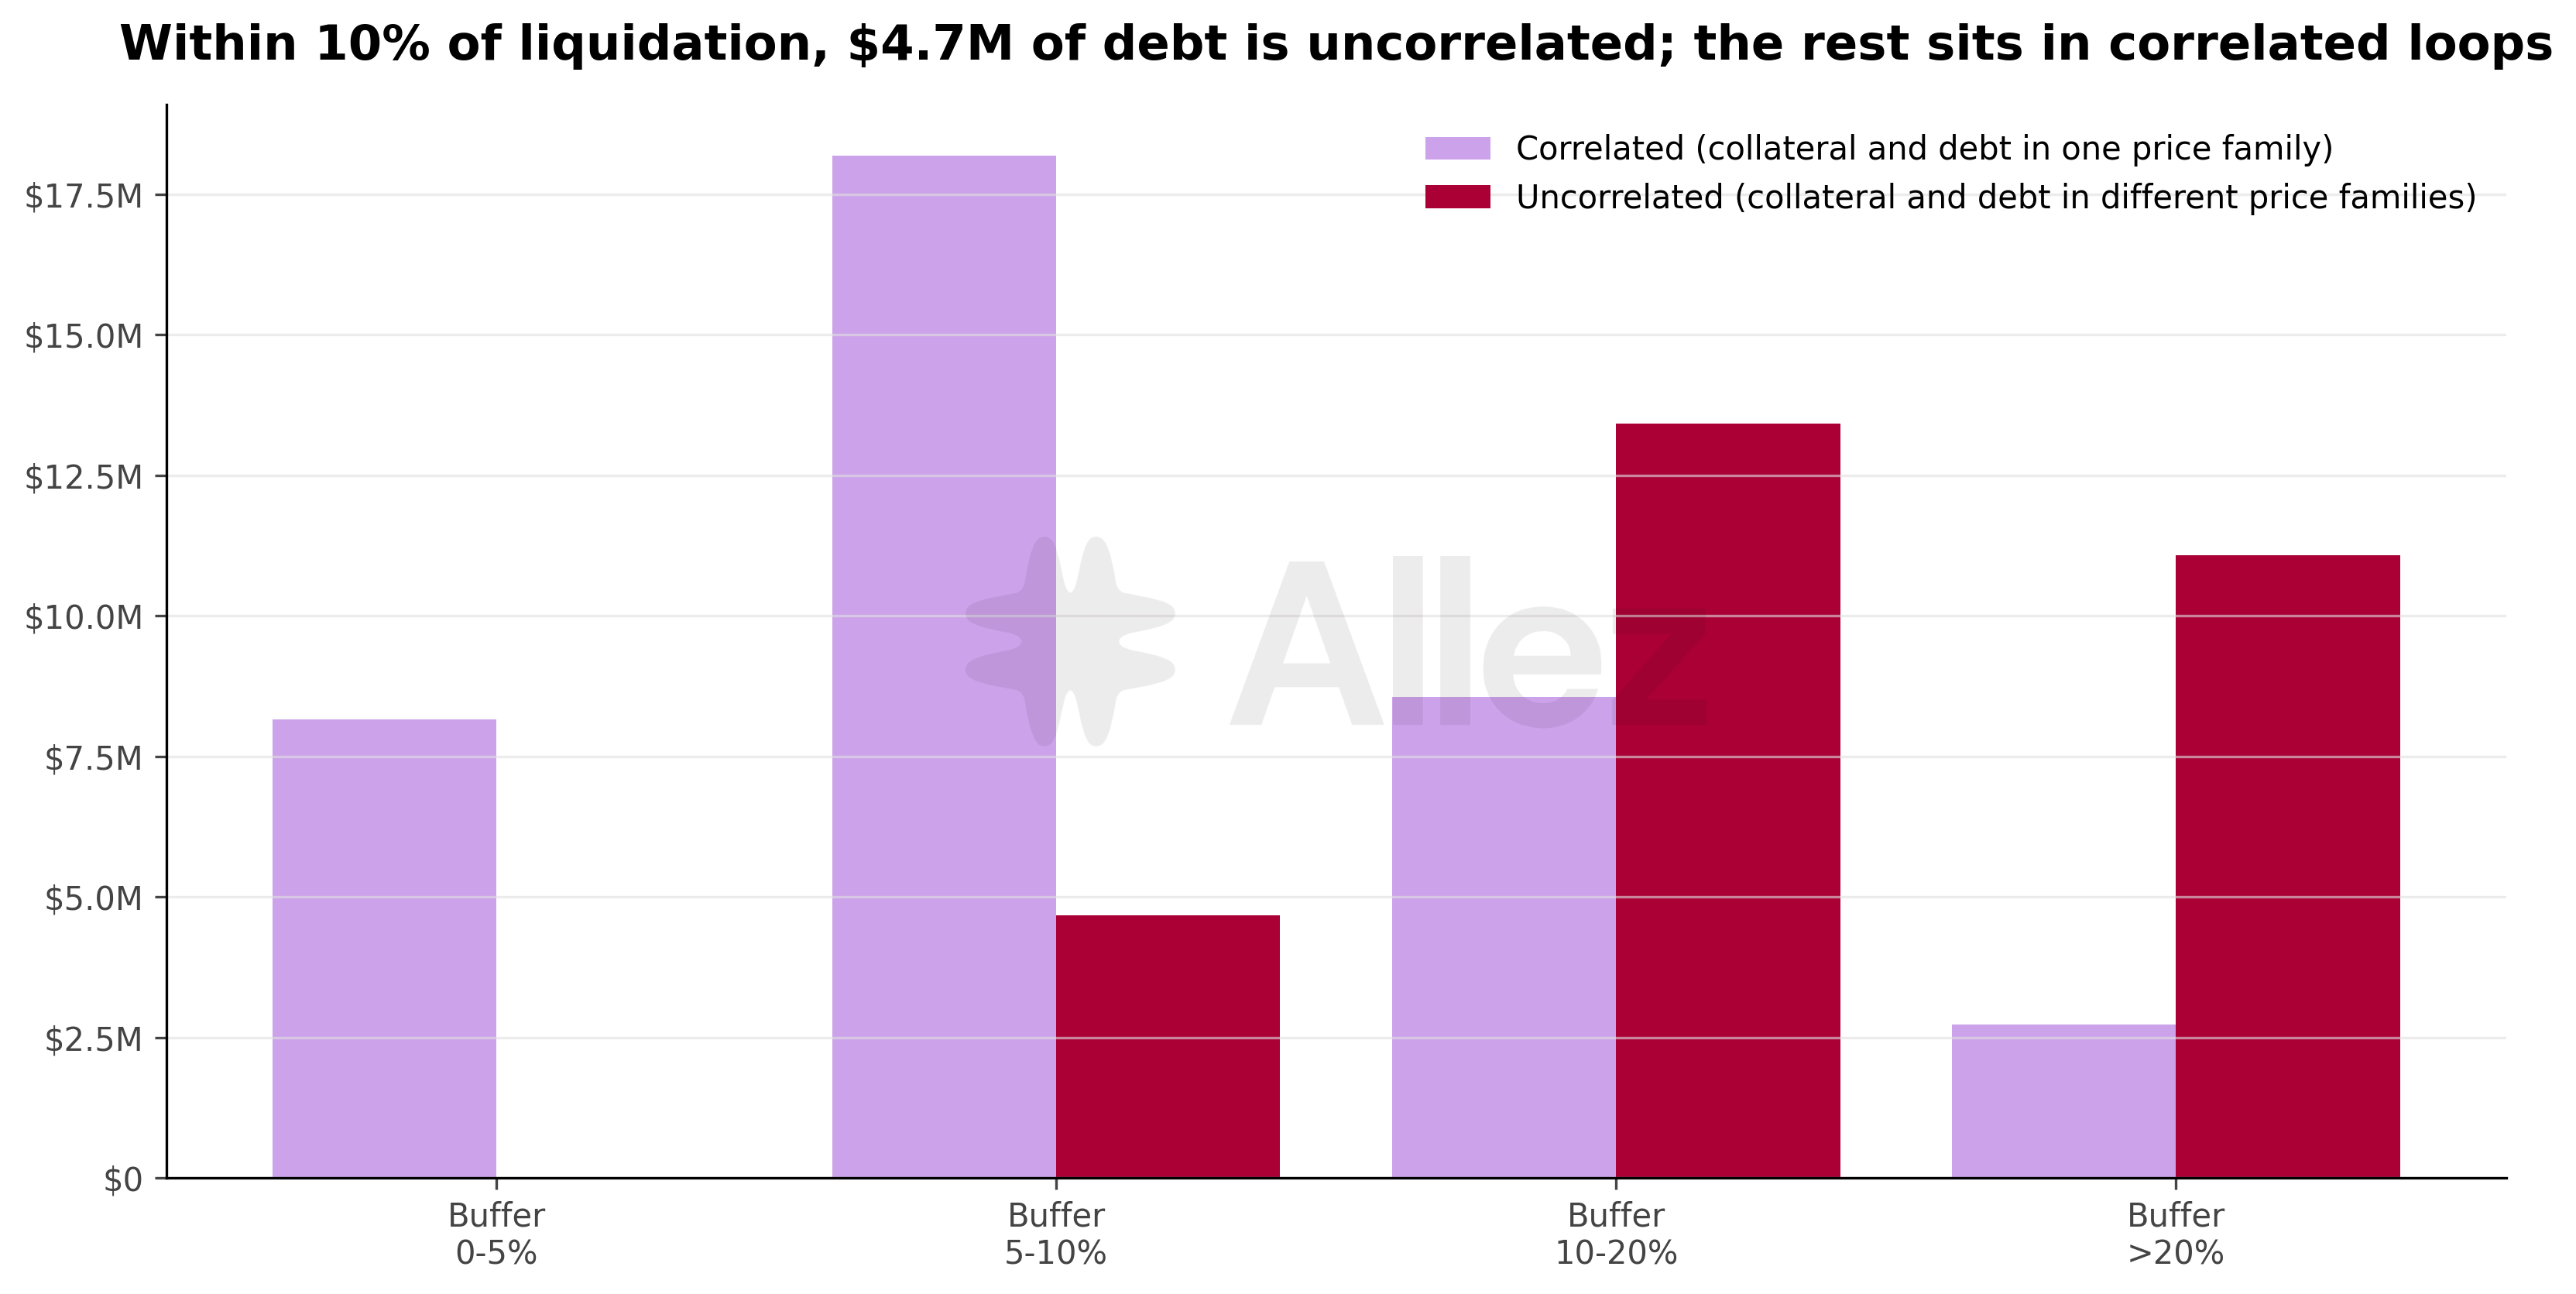
Correlated positions hold collateral and debt in one price family, such as haSUI against SUI or usdSUI against USDC. Their health moves little when both legs move together, and they can run close to liquidation. A price gap between the two legs still affects them. Uncorrelated positions hold collateral and debt in different families, such as SUI against USDC.
| Within 10% of liquidation | Aug 31 | Sep 30 |
|---|---|---|
| Correlated | $17.4M (282 positions) | $26.3M (278 positions) |
| Uncorrelated | $5.8M (10 positions) | $4.7M (6 positions) |
One general pool position accounts for $4.41M of the $4.7M: $6.44M of USDC collateral against usdSUI, SUI and USDT debt, with an 8.1% buffer. Only one uncorrelated position, with $260 of debt, sits within 5%.
Among correlated positions within 10% of liquidation, haSUI to SUI loops hold $6.0M, usdSUI to USDC $5.6M, general pool positions $5.4M and the stablecoin loops $5.3M. Of the 81 correlated positions within 5%, 75 are haSUI to SUI loops, four are stablecoin loops ($5.0M of debt) and two are eSUI loops.
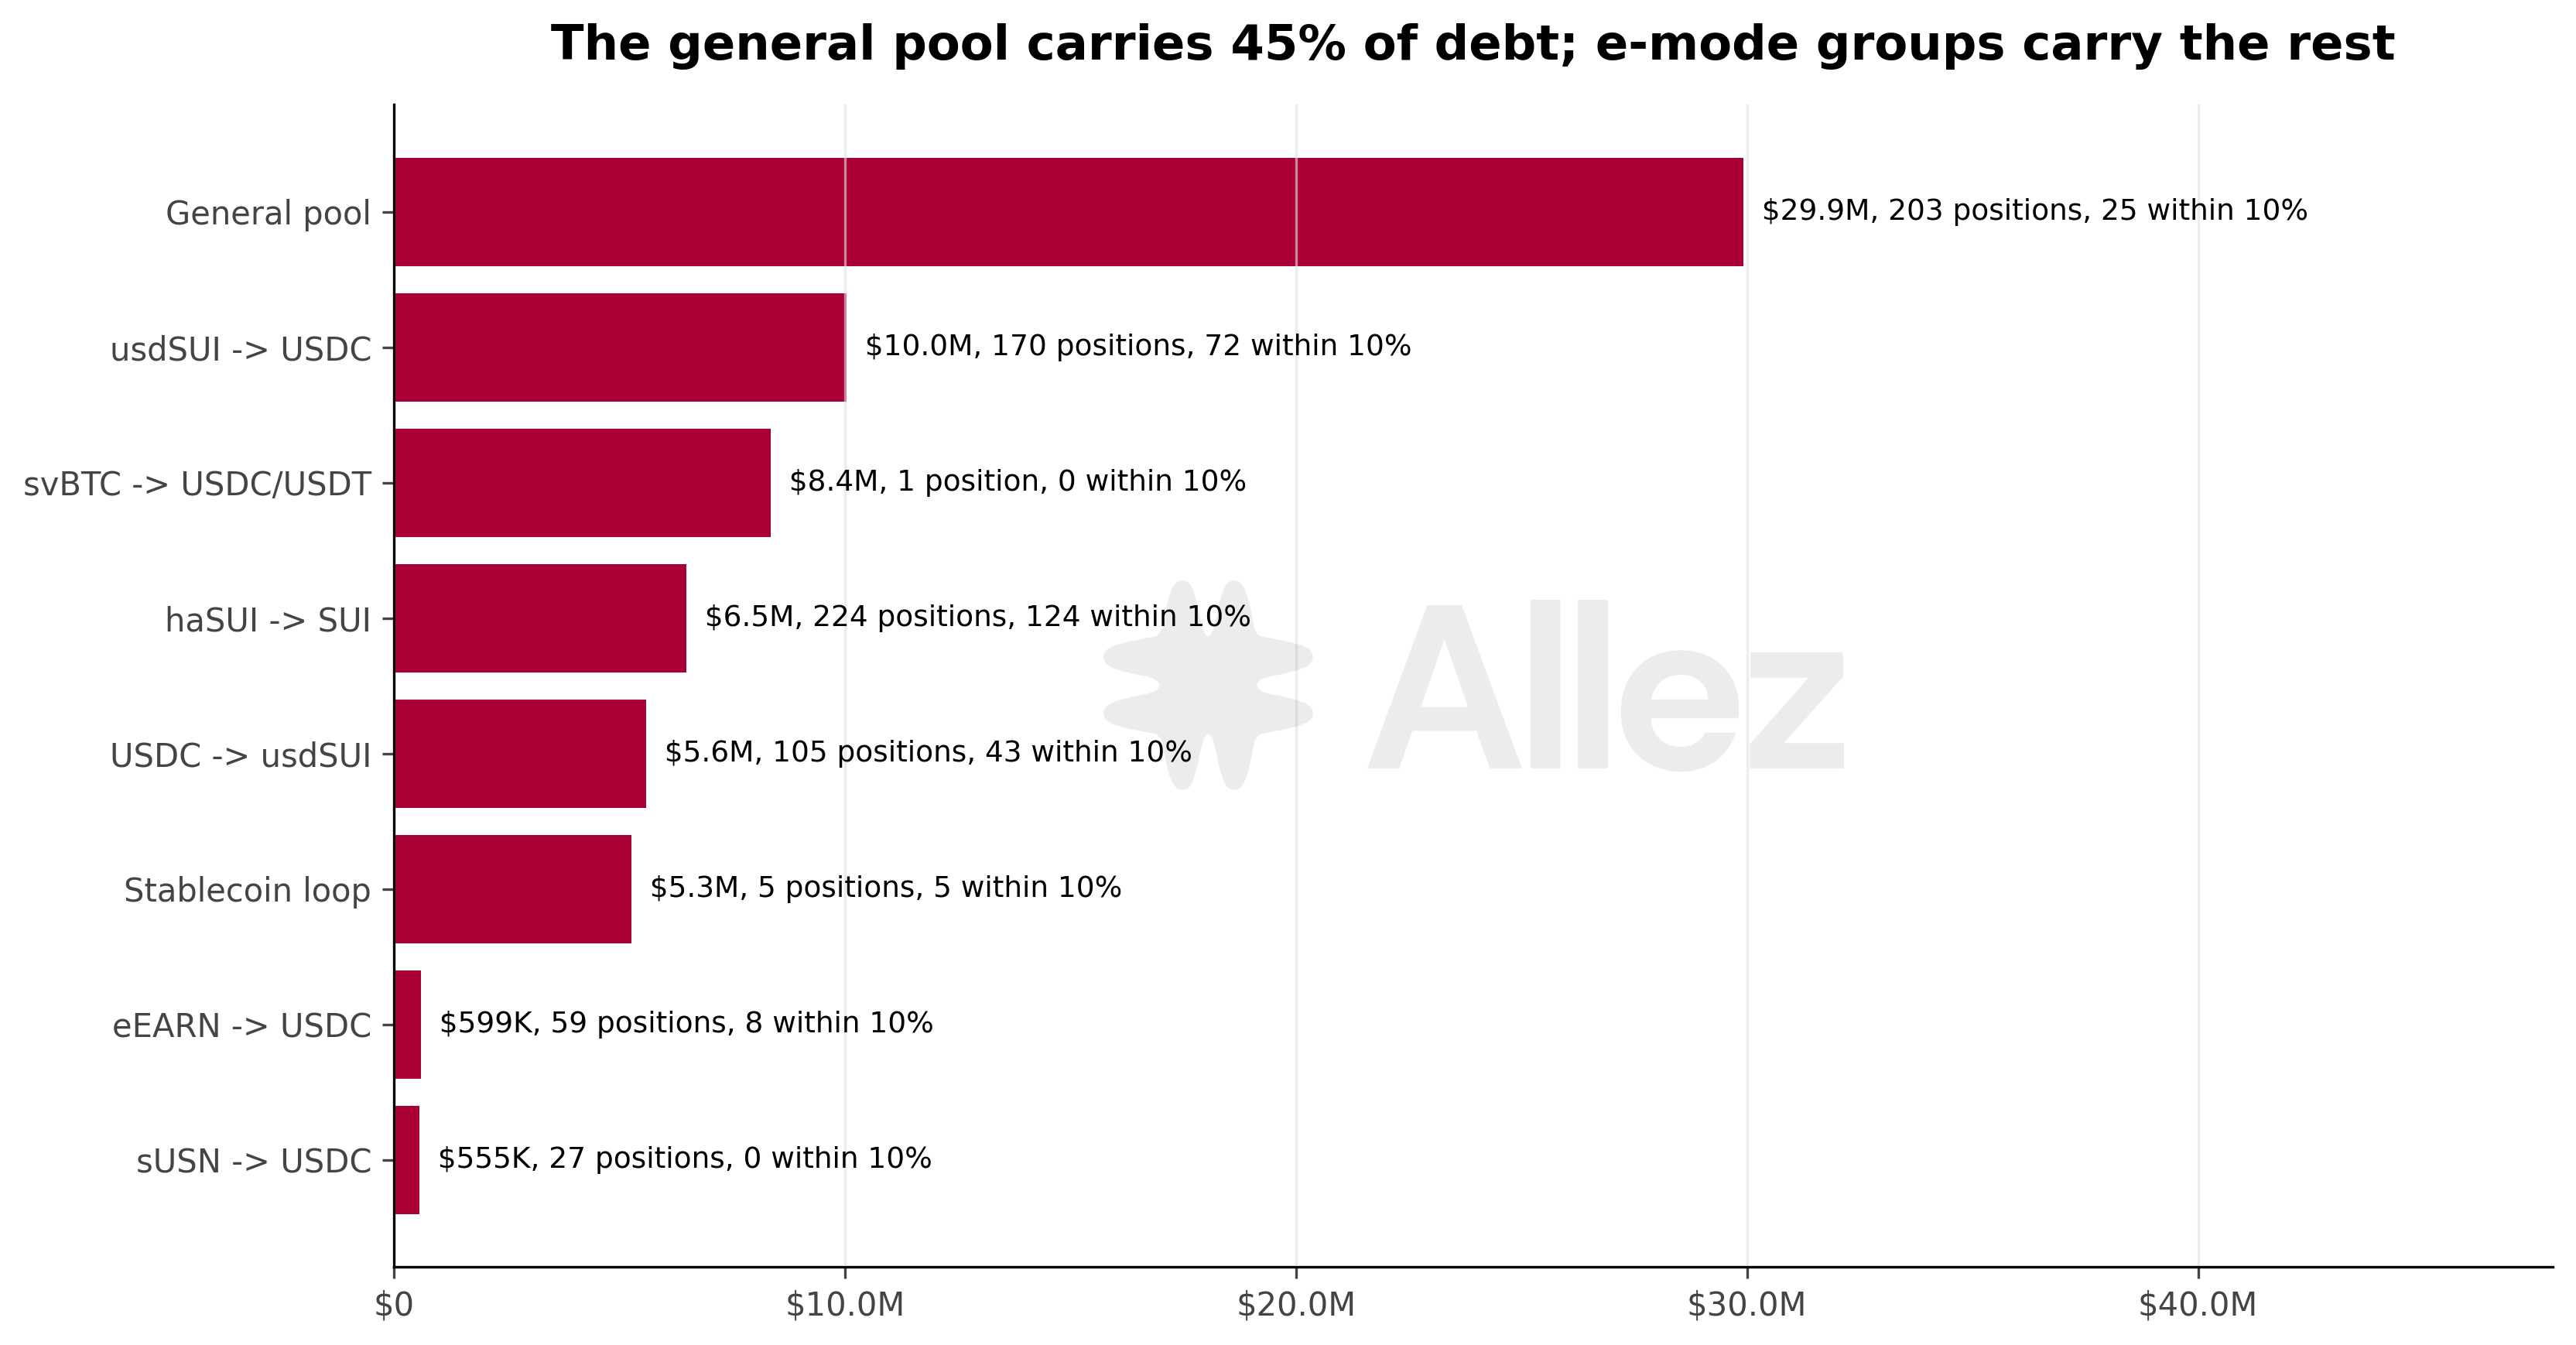
The general pool holds 44.8% of debt ($29.9M across 203 positions), down from 46.3%. The usdSUI to USDC group rose to second place with $10.0M. The haSUI to SUI group holds the most positions near liquidation, 124 of 224 within 10%.
Stress testing. Volatile assets (SUI, LSTs, BTC and ETH) take the stated drop. Stablecoins hold their price.
| Price shock | Collateral at risk | August | Potential bad debt | Positions at risk |
|---|---|---|---|---|
| -10% | $45 | $83K | $0 | 1 |
| -20% | $122K | $3.2M | $0 | 7 |
| -30% | $4.8M | $6.7M | $196 | 15 |
| -40% | $19.9M | $6.4M | $3.7K | 34 |
| -50% | $17.6M | $12.4M | $246K | 59 |
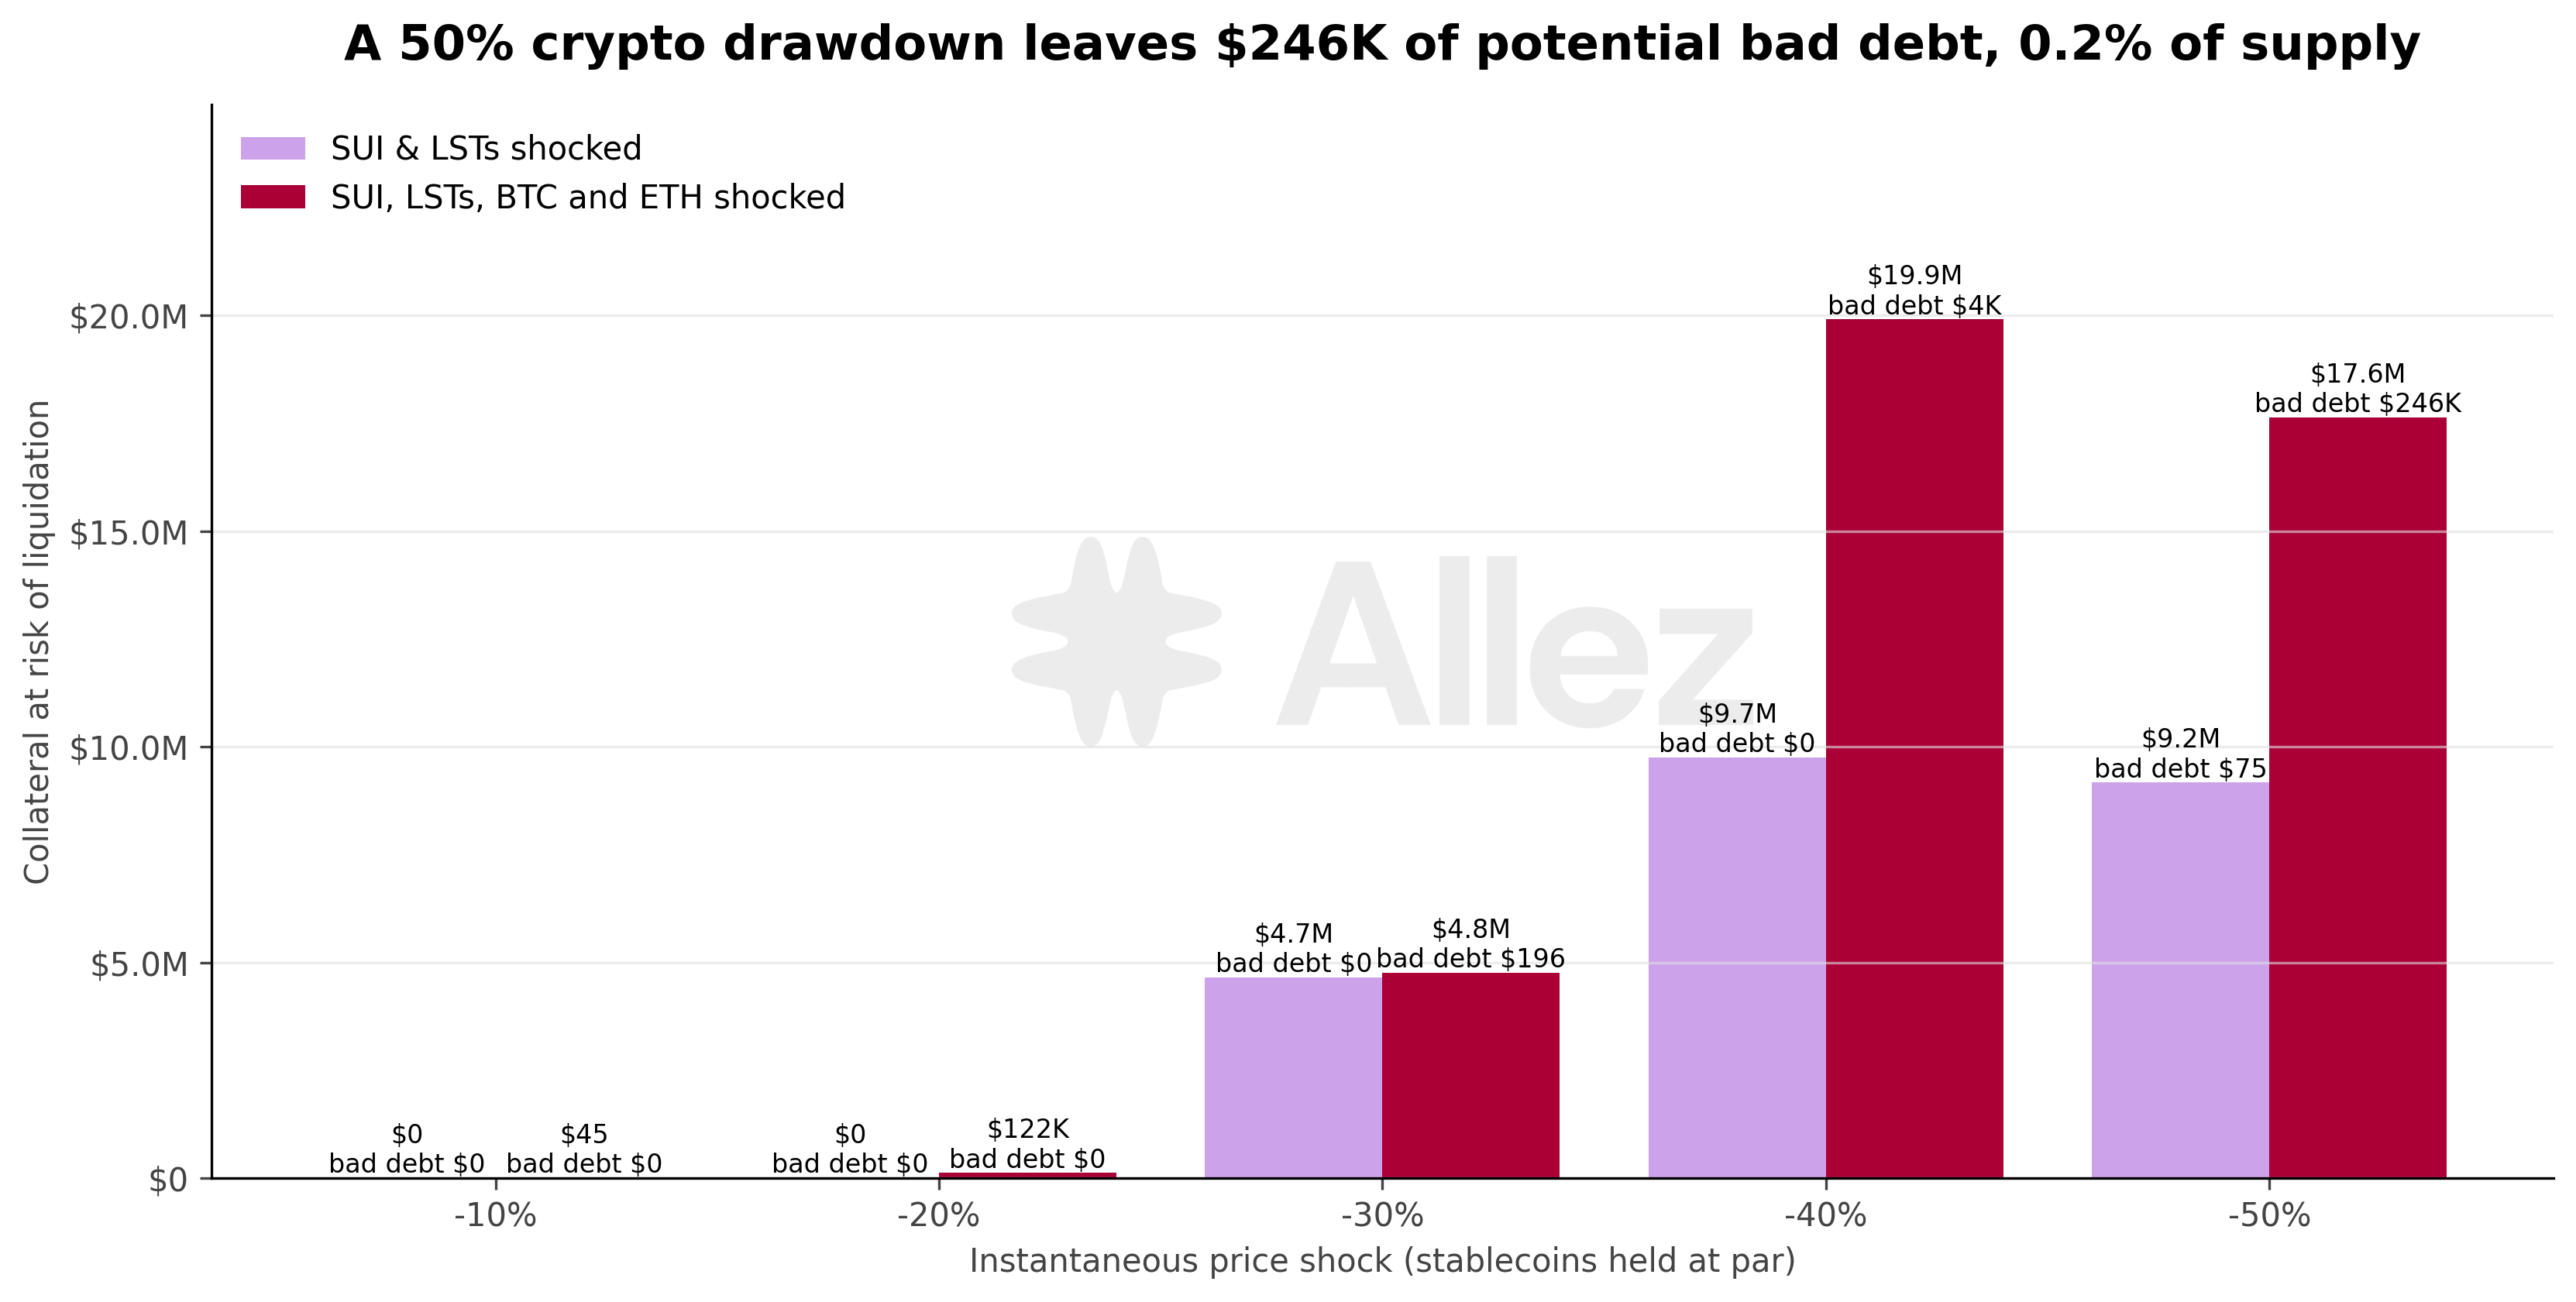
Down to a 20% drop, collateral at risk stays below $125K, against $3.2M in August. Across the correlated collateral-debt pairs, a 5% usdSUI depeg would make two stablecoin loops with $3.4M of collateral eligible for liquidation.
Liquidations (September):
| Metric | August | September |
|---|---|---|
| Events | 32 | 31 |
| Positions liquidated | 21 | 12 |
| Debt repaid | $3,273 | $4,514 |
| Collateral seized | $3,493 | $4,779 |
| Largest repayment | $1,209 | $982 |
USDC collateral against SUI debt accounted for 29 of the 31 events and $3,470 of repaid debt across 10 positions. 26 of those 29 events fell between September 19 and 27, during the SUI rally.
5. Activity and Volume
| Type | August | September | MoM |
|---|---|---|---|
| Deposit | $111.8M | $140.7M | +25.8% |
| Withdraw | $73.7M | $100.7M | +36.6% |
| Borrow | $38.0M | $53.1M | +39.6% |
| Repay | $17.3M | $32.8M | +90.1% |
| Lending volume | $240.9M | $327.3M | +35.9% |
| Flash loans (excluded) | $25.8M | $33.9M | +31.4% |
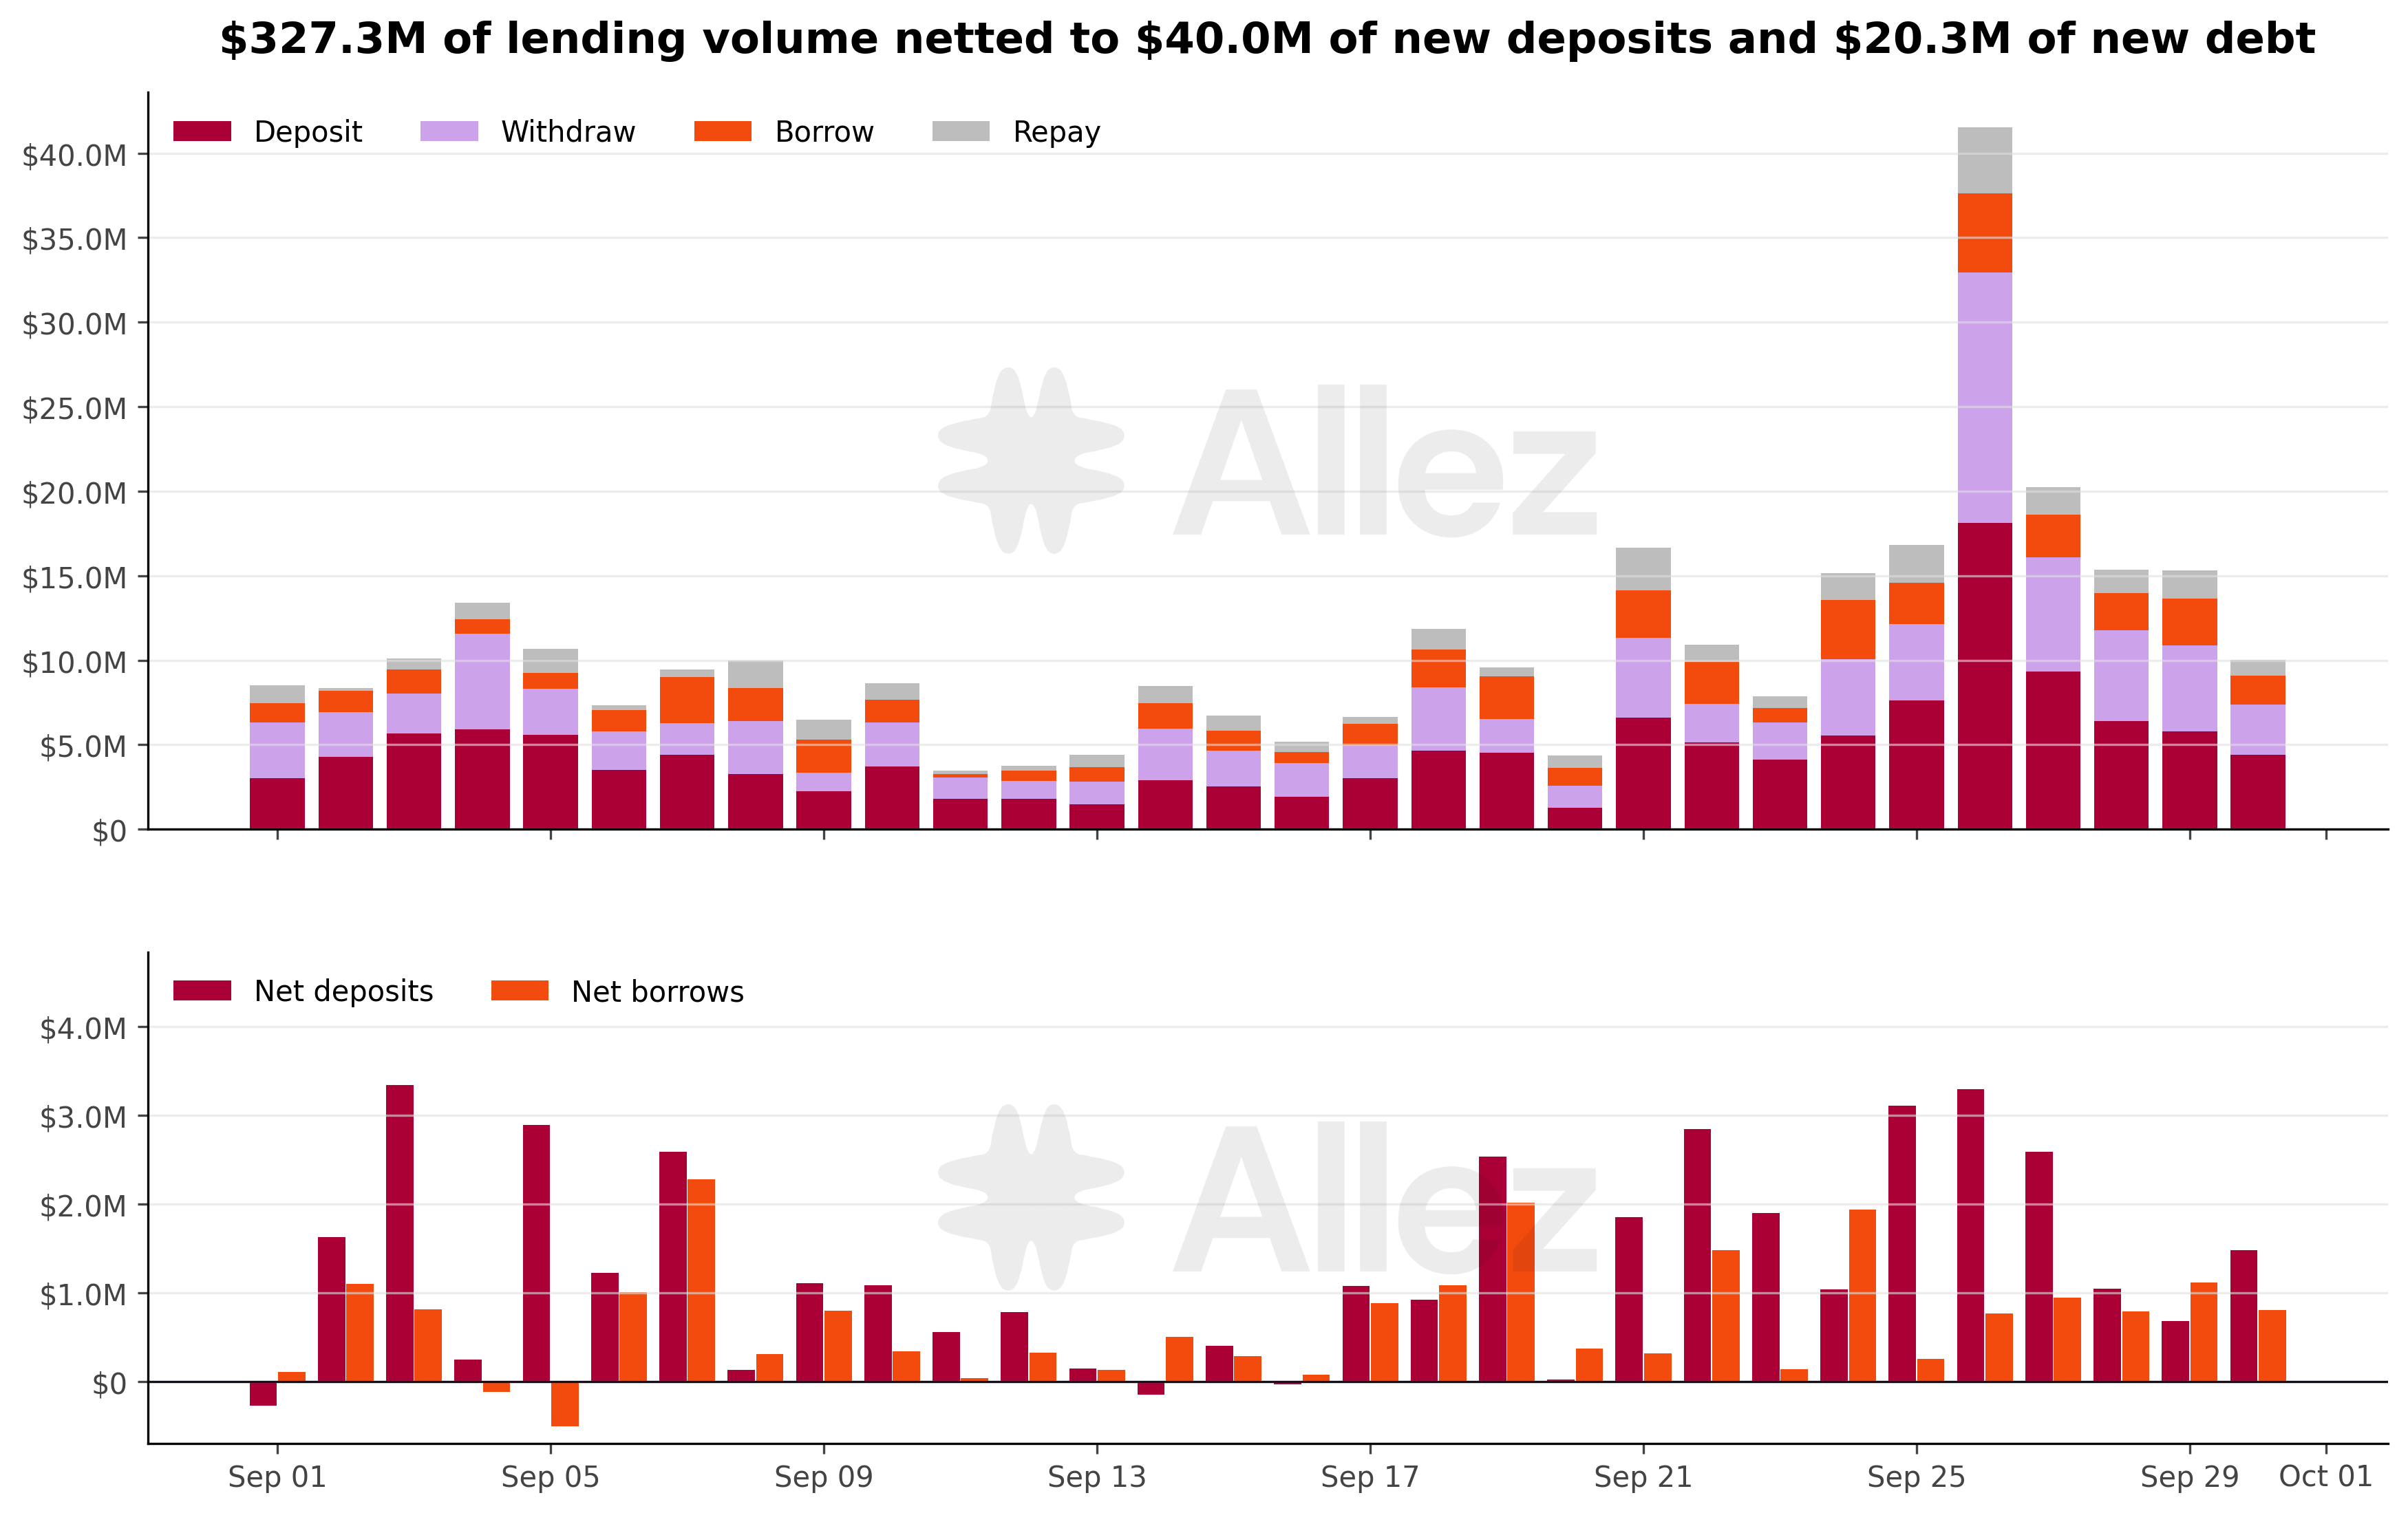
Deposits exceeded withdrawals by $40.0M and borrows exceeded repayments by $20.3M, close to August's net flows. Activity concentrated in the last ten days of the month: September 26 was the busiest day at $41.5M, led by USDC deposits and SUI and USDC withdrawals.
The number of deposit, withdrawal, borrow and repay events fell 4.6% to 45,480 while volume rose. 358 addresses borrowed during the month, against 351 in August.
6. Revenue and Utilization
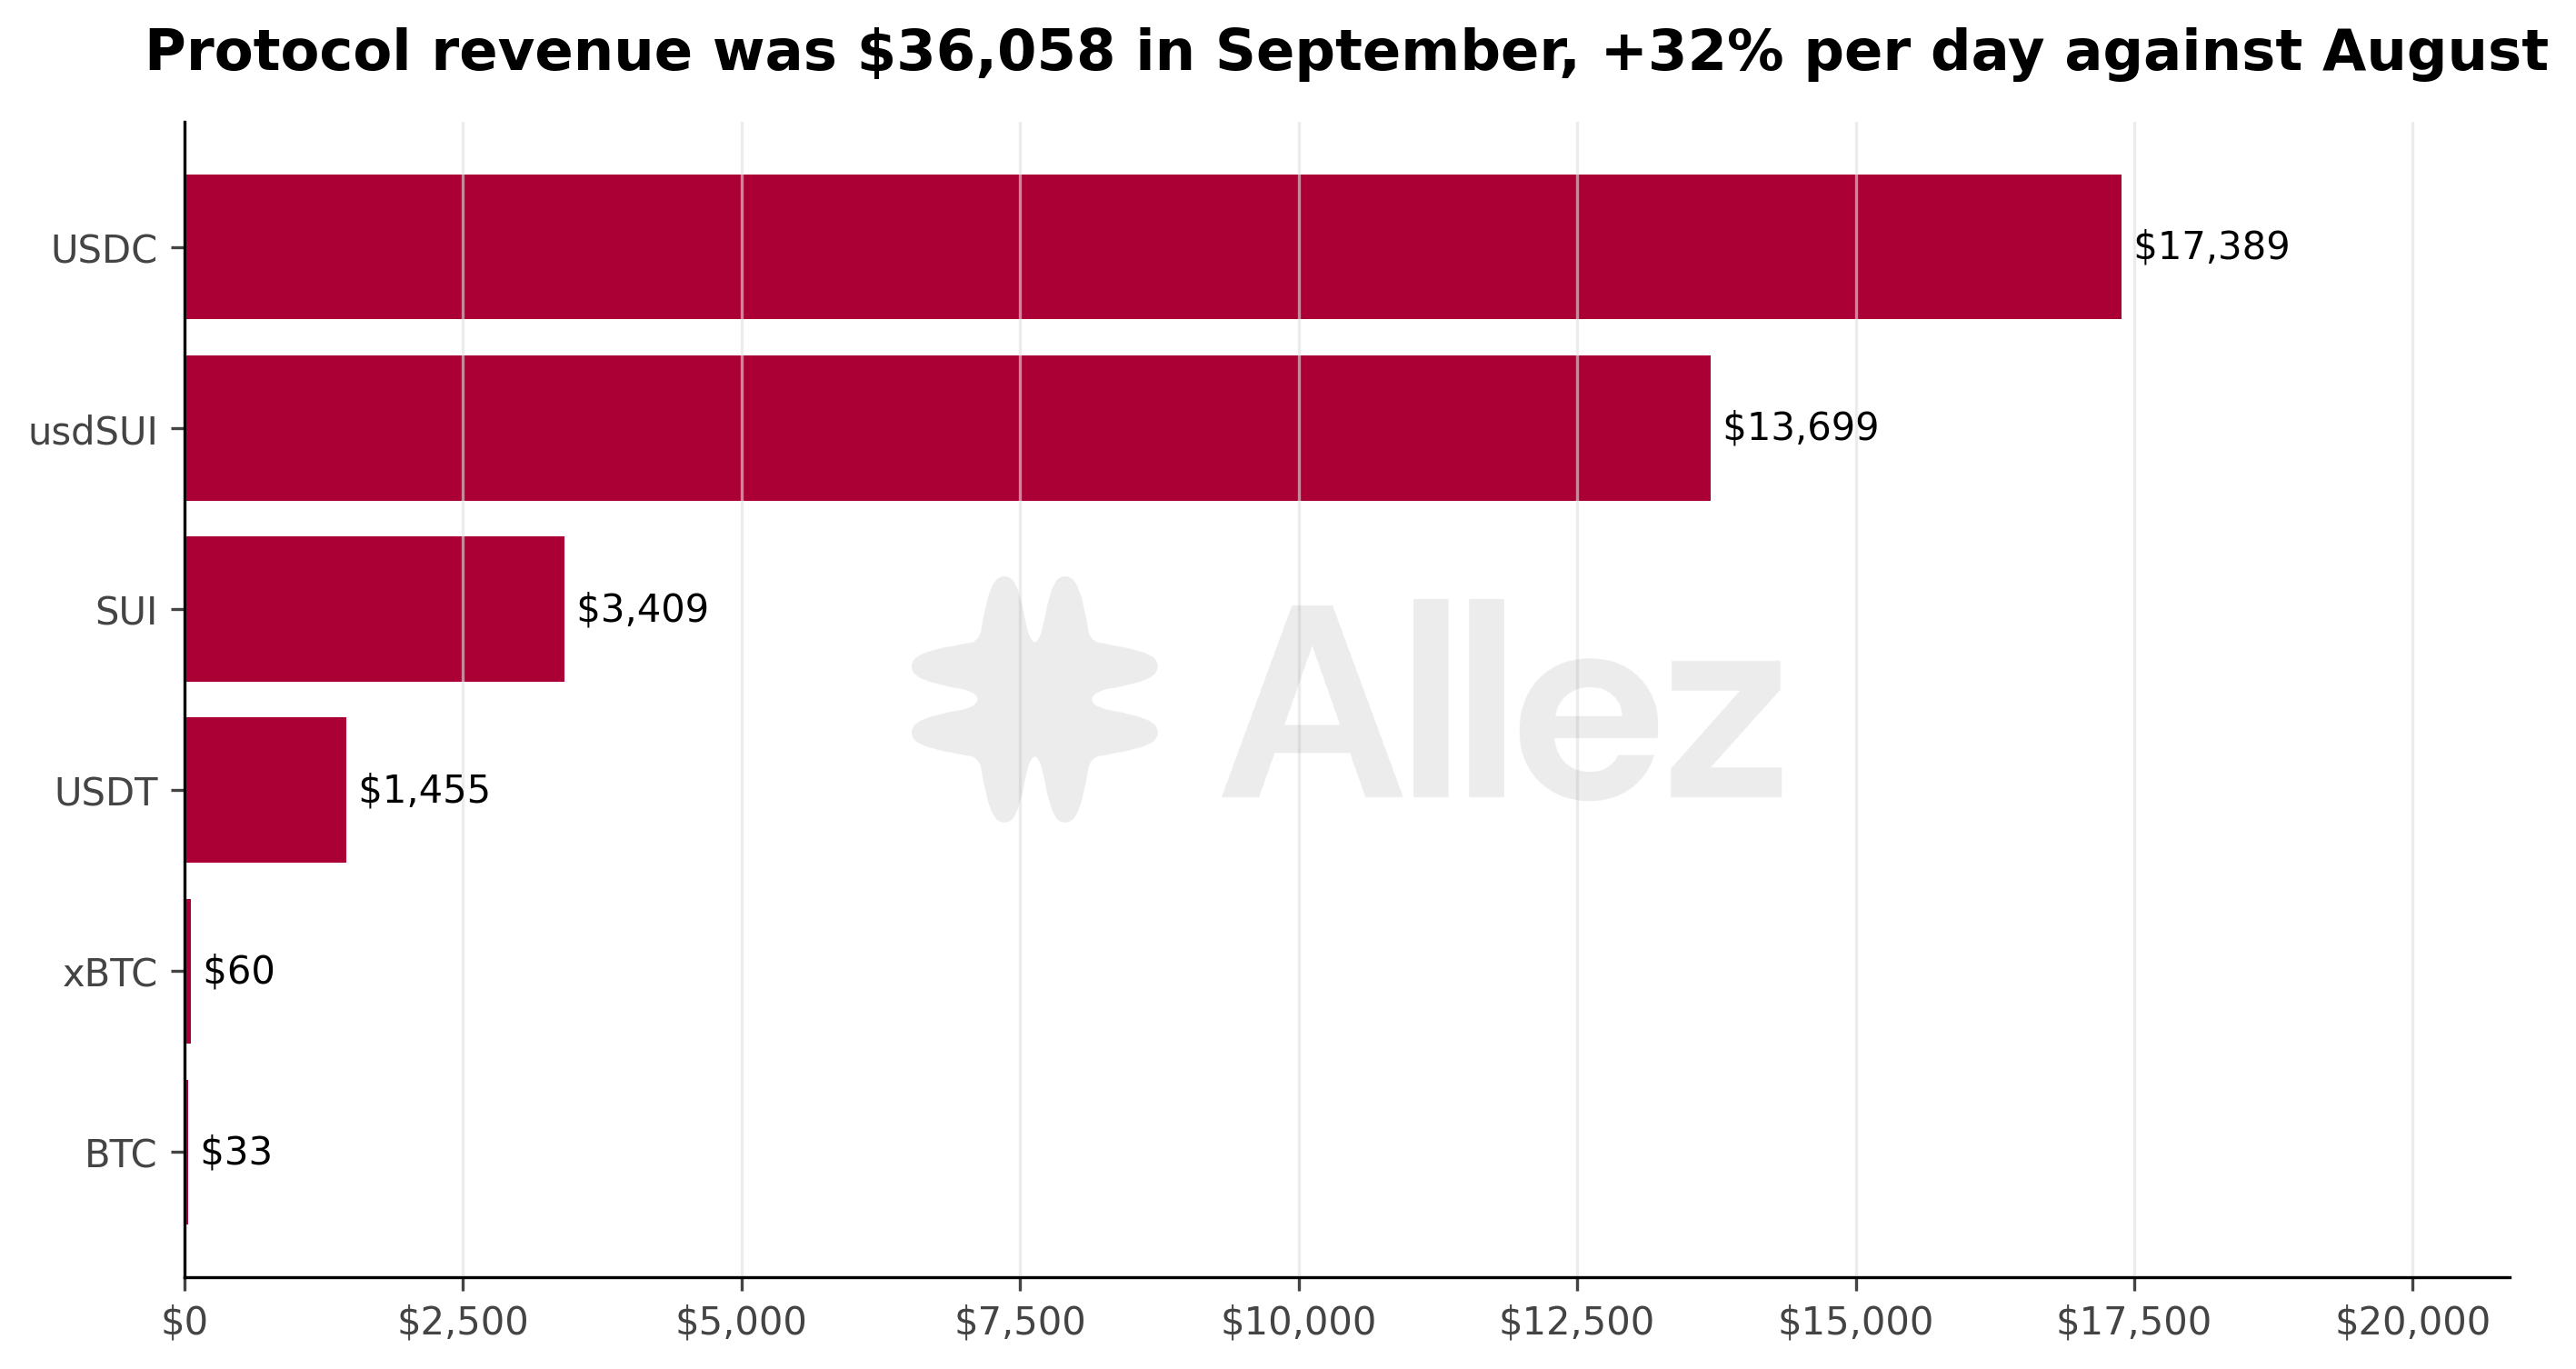
Protocol revenue reached $36,058 in September. Average daily revenue rose 32.2% to $1,202, from $909 in August. USDC contributed $17,389 and usdSUI $13,699, together 86% of the total. SUI added $3,409 and USDT $1,455. Daily revenue rose from $974 on September 1 to $1,402 on September 30, in line with debt.
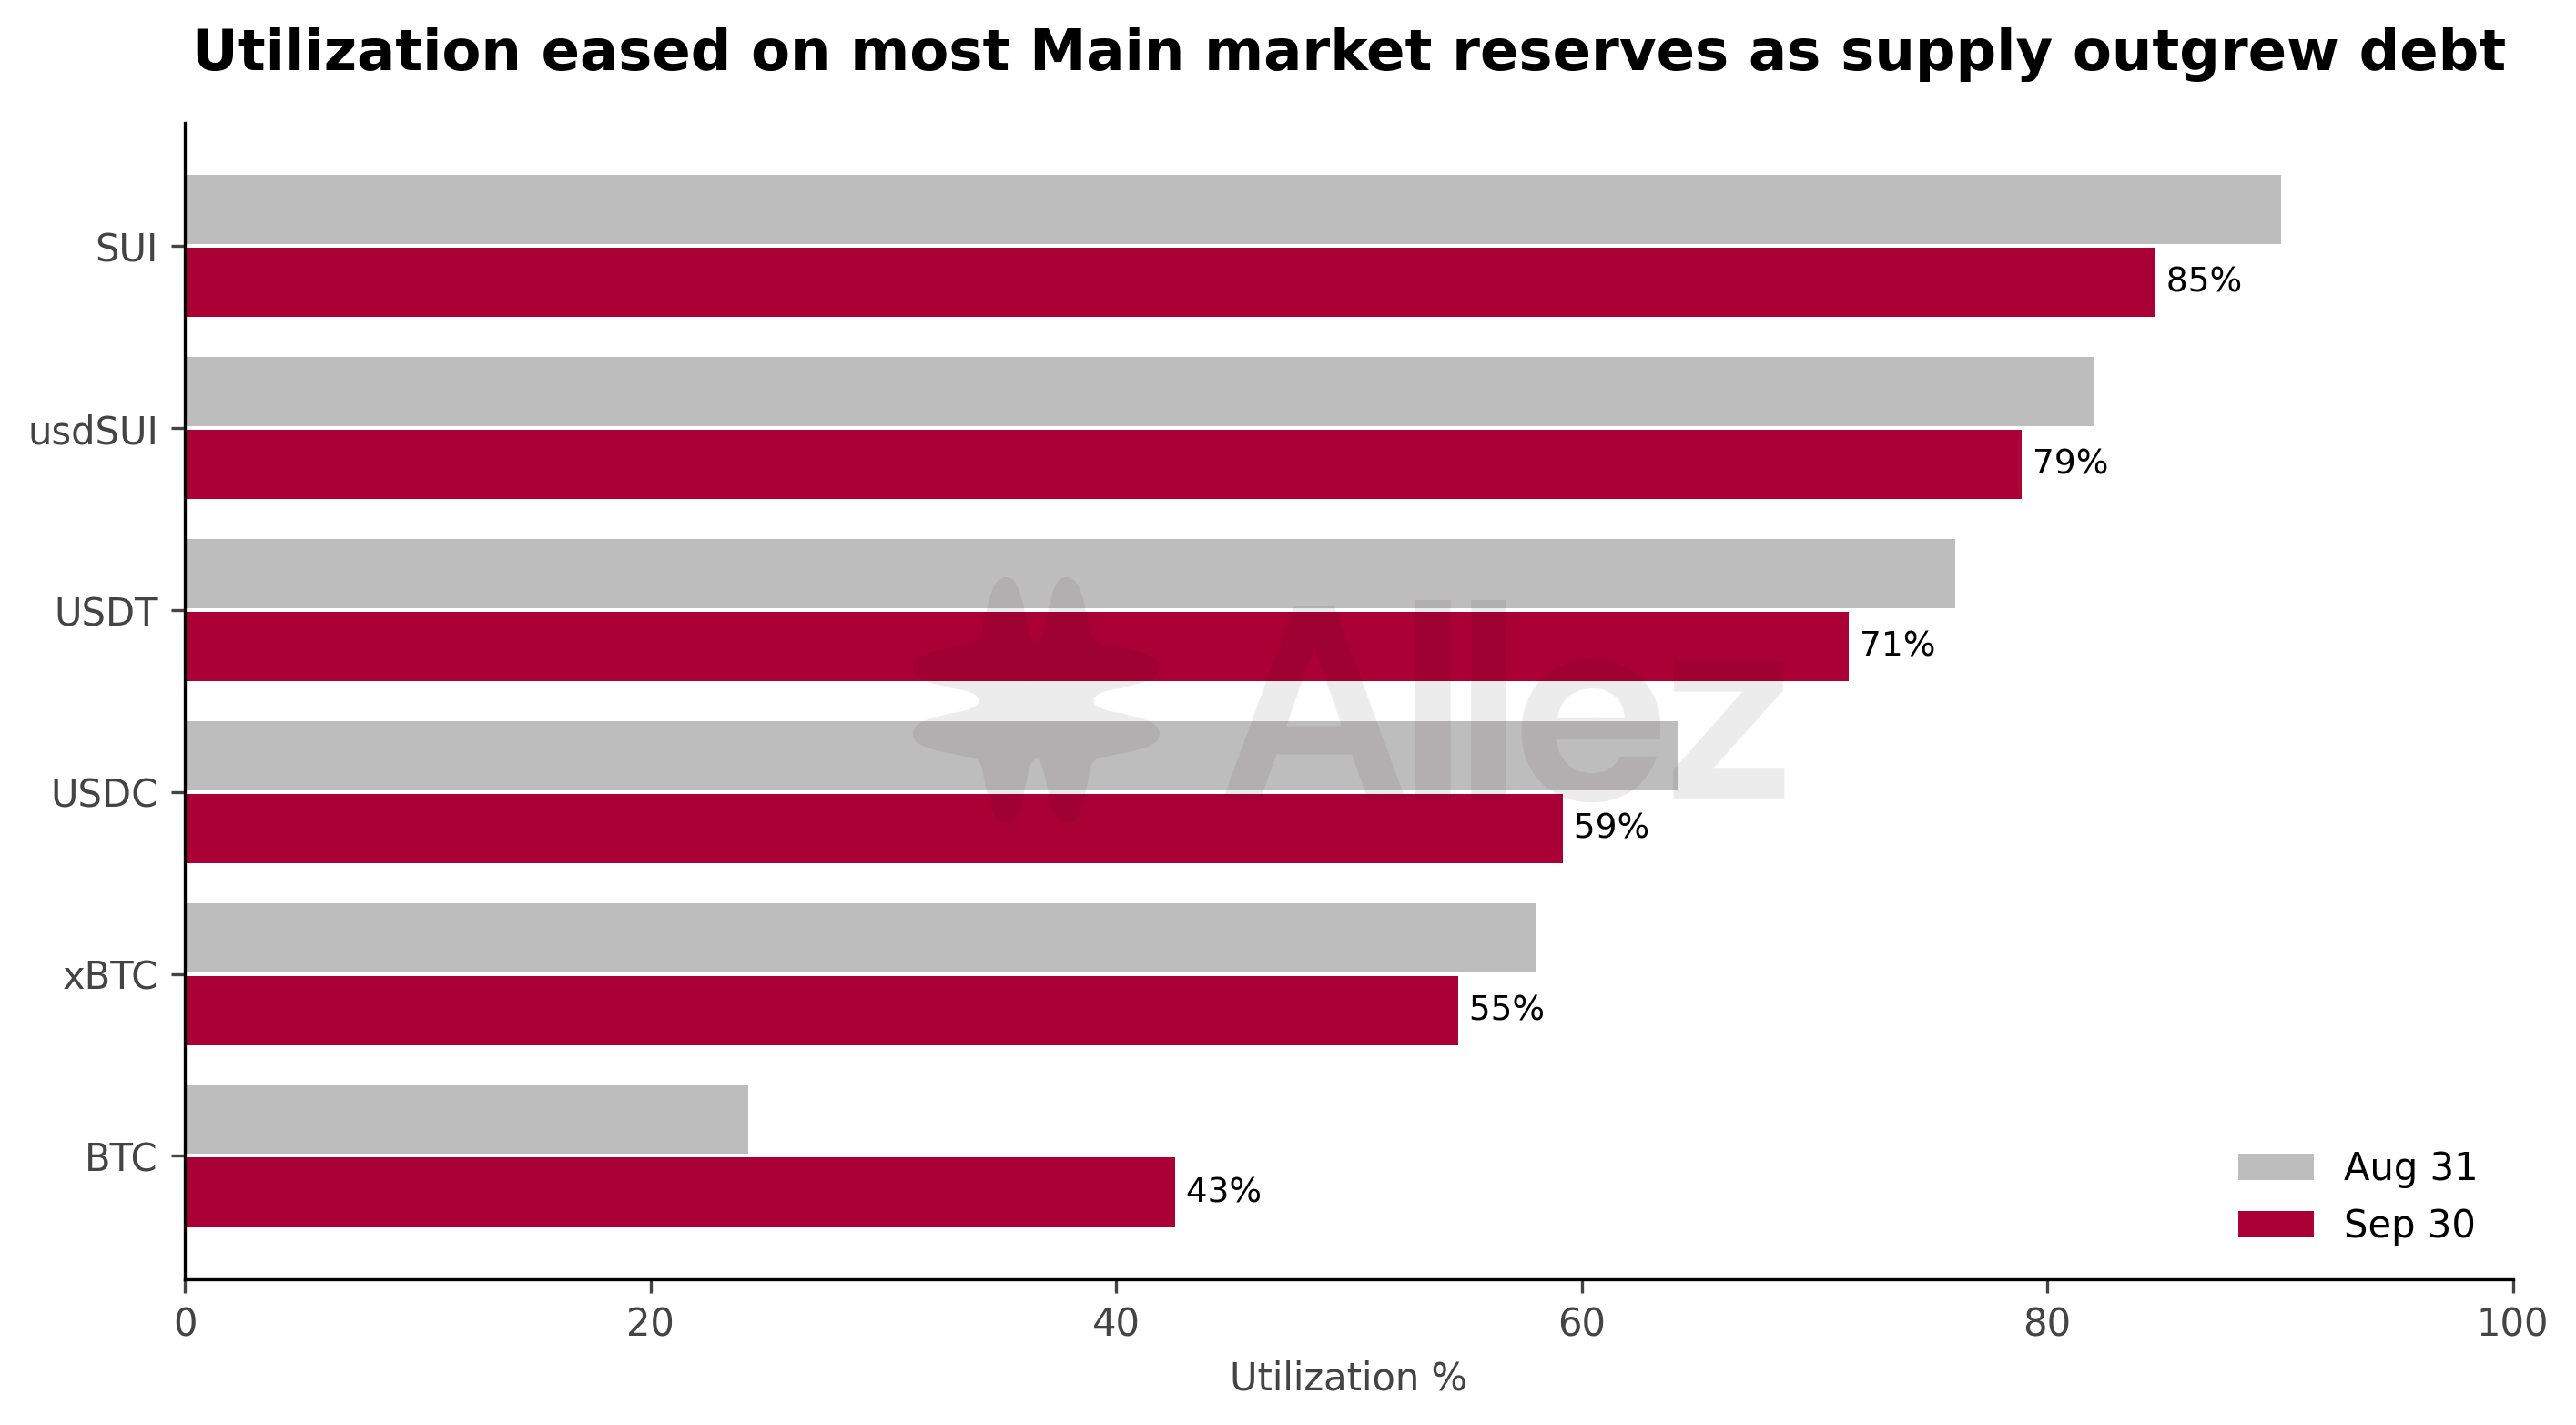
| Reserve | Utilization Aug 31 | Utilization Sep 30 | Borrow APY Sep 30 |
|---|---|---|---|
| SUI | 90.1% | 84.7% | 1.24% |
| usdSUI | 82.0% | 78.9% | 5.07% |
| USDT | 76.0% | 71.5% | 4.63% |
| USDC | 64.2% | 59.2% | 3.91% |
| xBTC | 58.0% | 54.7% | 0.50% |
| BTC | 24.2% | 42.5% | 0.50% |
Utilization eased on every major reserve except BTC, as supply grew faster than debt. SUI remains the most utilized reserve at 84.7%, with $11.8M of debt. BTC utilization rose to 42.5% on a small base of $0.5M of debt.
7. Conclusions and Risk Posture
The risk profile remains robust after this month of large inflows. Most of the debt within 10% of liquidation, $26.3M of $31.0M, sits in correlated loops, which move little in a broad market move. Uncorrelated debt within 10% of liquidation fell from August, even as total debt grew 63%. Liquidations stayed small, and a 20% drop in volatile assets puts less collateral at risk than in August.
Outlook. For October, Allez will watch borrowing against the raised stablecoin caps with USDC debt at 88% of its new borrow cap at month-end.
Appendix: Methodology and Scope
-
Window. September 1 to 30, 2026 (UTC), compared with August. Month-end figures use the 23:00 UTC snapshot on September 30 and the 22:00 UTC snapshot on August 31.
-
Pricing. Balances are valued at each hour's oracle price. Where an oracle had stopped updating, the report values the asset at a market reference price.
-
Supply and debt changes are split into a quantity effect (token change × month-end price) and a price effect (August balance × price change).
-
Position health uses each position's collateral and borrow weights in its market and e-mode group. Debt includes accrued interest.
-
Correlated positions hold all collateral and debt in one price family (stablecoins, SUI and LSTs, or BTC). All others are uncorrelated.
-
Stress tests apply an instantaneous shock to the named assets for positions as of September 30 and August 31. Collateral at risk is the post-shock collateral of positions that become eligible for liquidation. Potential bad debt is debt in excess of collateral. Liquidation incentives and price impact are not modelled.
-
Lending volume sums deposits, withdrawals, borrows and repayments at each day's price, and excludes flash loans.
-
Revenue is the daily growth in protocol reserves, plus same-day treasury withdrawals, at each day's price. The August average covers August 2 to 31.
-
Coverage. Position figures (sections 3 and 4) cover all markets. Reserve tables cover the Main market.
| Category | Assets |
|---|---|
| Stablecoins | USDC, usdSUI, USDT, sUSN, eEARN, USDY, FDUSD, USDB, sUSDe |
| SUI & LSTs | SUI, haSUI, afSUI, stSUI, vSUI (CERT), springSUI, eSUI |
| BTC | svBTC, xBTC, BTC, LBTC |
This report represents independent risk analysis by Allez Labs for the Current Finance community.
Prepared by: Allez Labs Risk Team
Report Date: October 12, 2026