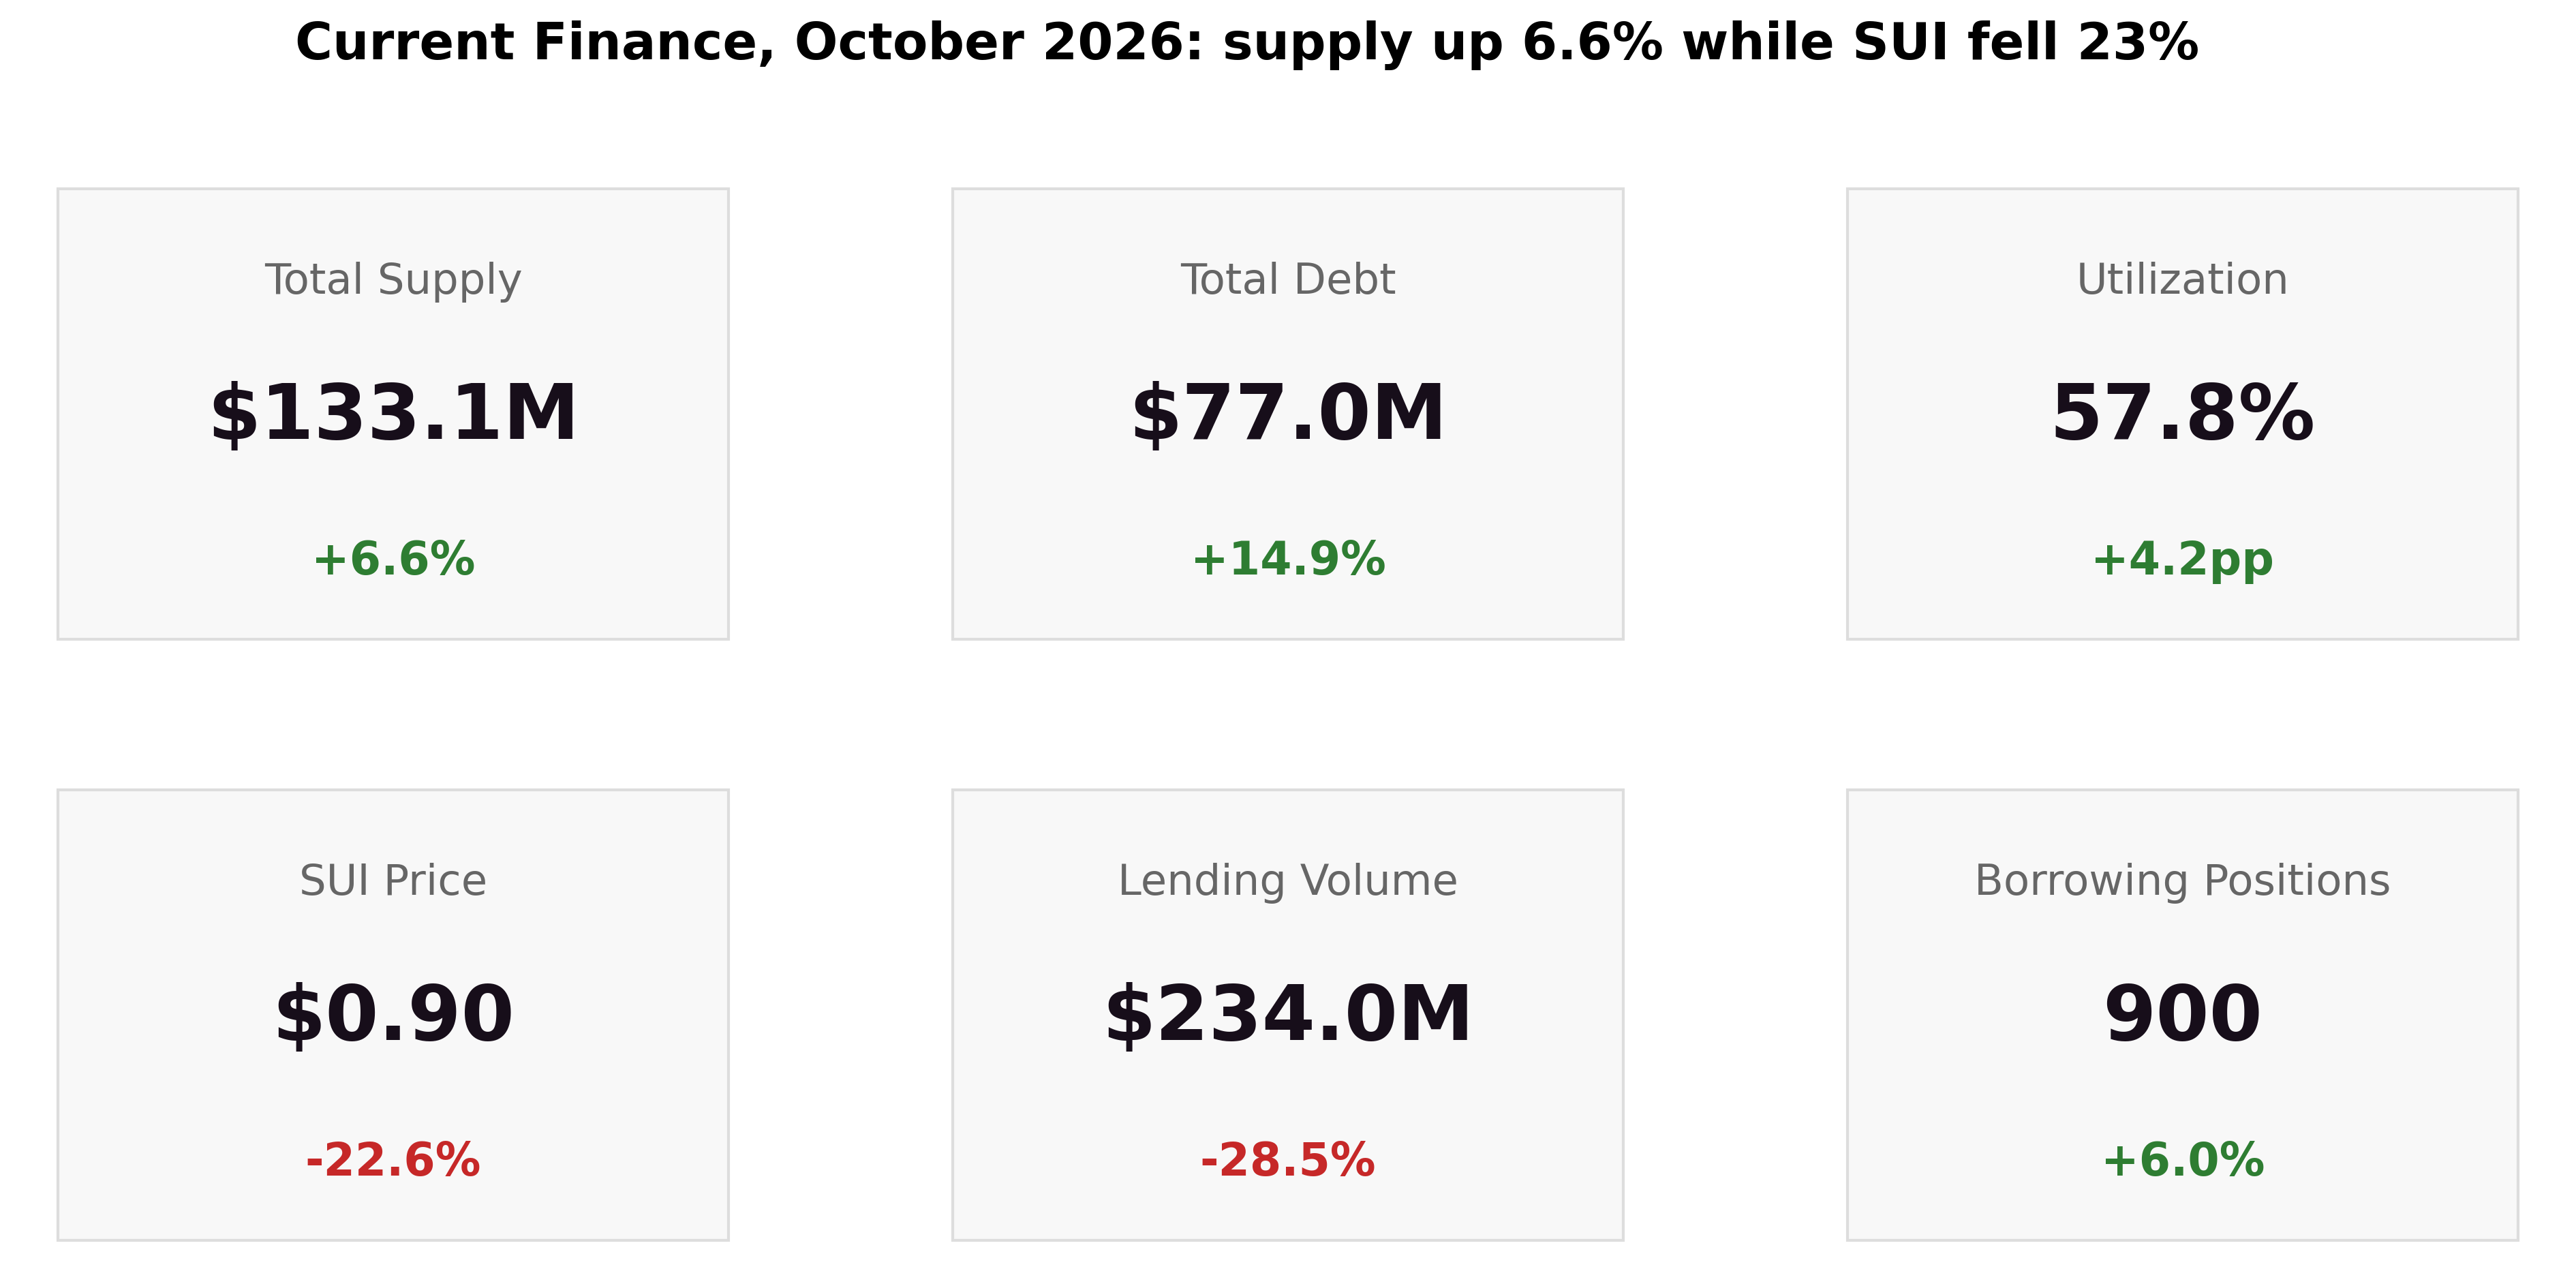
Current Finance grew through October despite the largest hack in crypto's history occurring and SUI falling 23%. Total supply increased 7% to $133M, while outstanding debt rose 15% to $77M, pushing protocol utilization to 58%. Despite the month's volatility, liquidation activity remained low through the selloff, with only 10 liquidation events ($179). Points Season 3 launched with 86,100 SUI and 5M CRT in rewards. Additional incentives introduced on October 31 pushed supply APYs outside the Main market to attractive levels.
1. Market Context
Current Ecosystem Updates:
-
sUSN-USDC Multiply (October 1). The one-click sUSN loop opened after an oracle upgrade and a risk parameter calibration with Allez Labs.
-
Cap changes (October 8 and 24). Current raised the USDC borrow cap, the usdSUI supply cap and both caps in the sUSN market.
-
Borrow pause (October 30 to 31). After the Binance hot wallet incident on October 29, Current prioritized safety by pausing new borrowing of BTC, xBTC and SUI on the Main market as a precaution, in coordination with Allez Labs. The attacker had used stablecoin collateral on other lending markets to borrow volatile assets. With no attacker funds bridged to Sui, SUI and BTC borrowing resumed on October 31, while xBTC remained paused at month-end.
-
Points Season 3 (October 22). A 123-day season with 86,100 SUI and 5M CRT in rewards. Season 2 closed with 46,000 SUI distributed on October 26.
-
Nexus Mutual cover (October 29). The annual cover fee for Current fell 38% to 2.4%, with up to $4.4M of cover available.
-
Incentives beyond the Main market (October 31). New supply incentives on the Ember, sUSN and AltCoin markets, with advertised supply rates of 16% on USDC (Ember), 13% on USDC (sUSN) and 70% on DEEP (AltCoin).
2. Supply and Market Overview
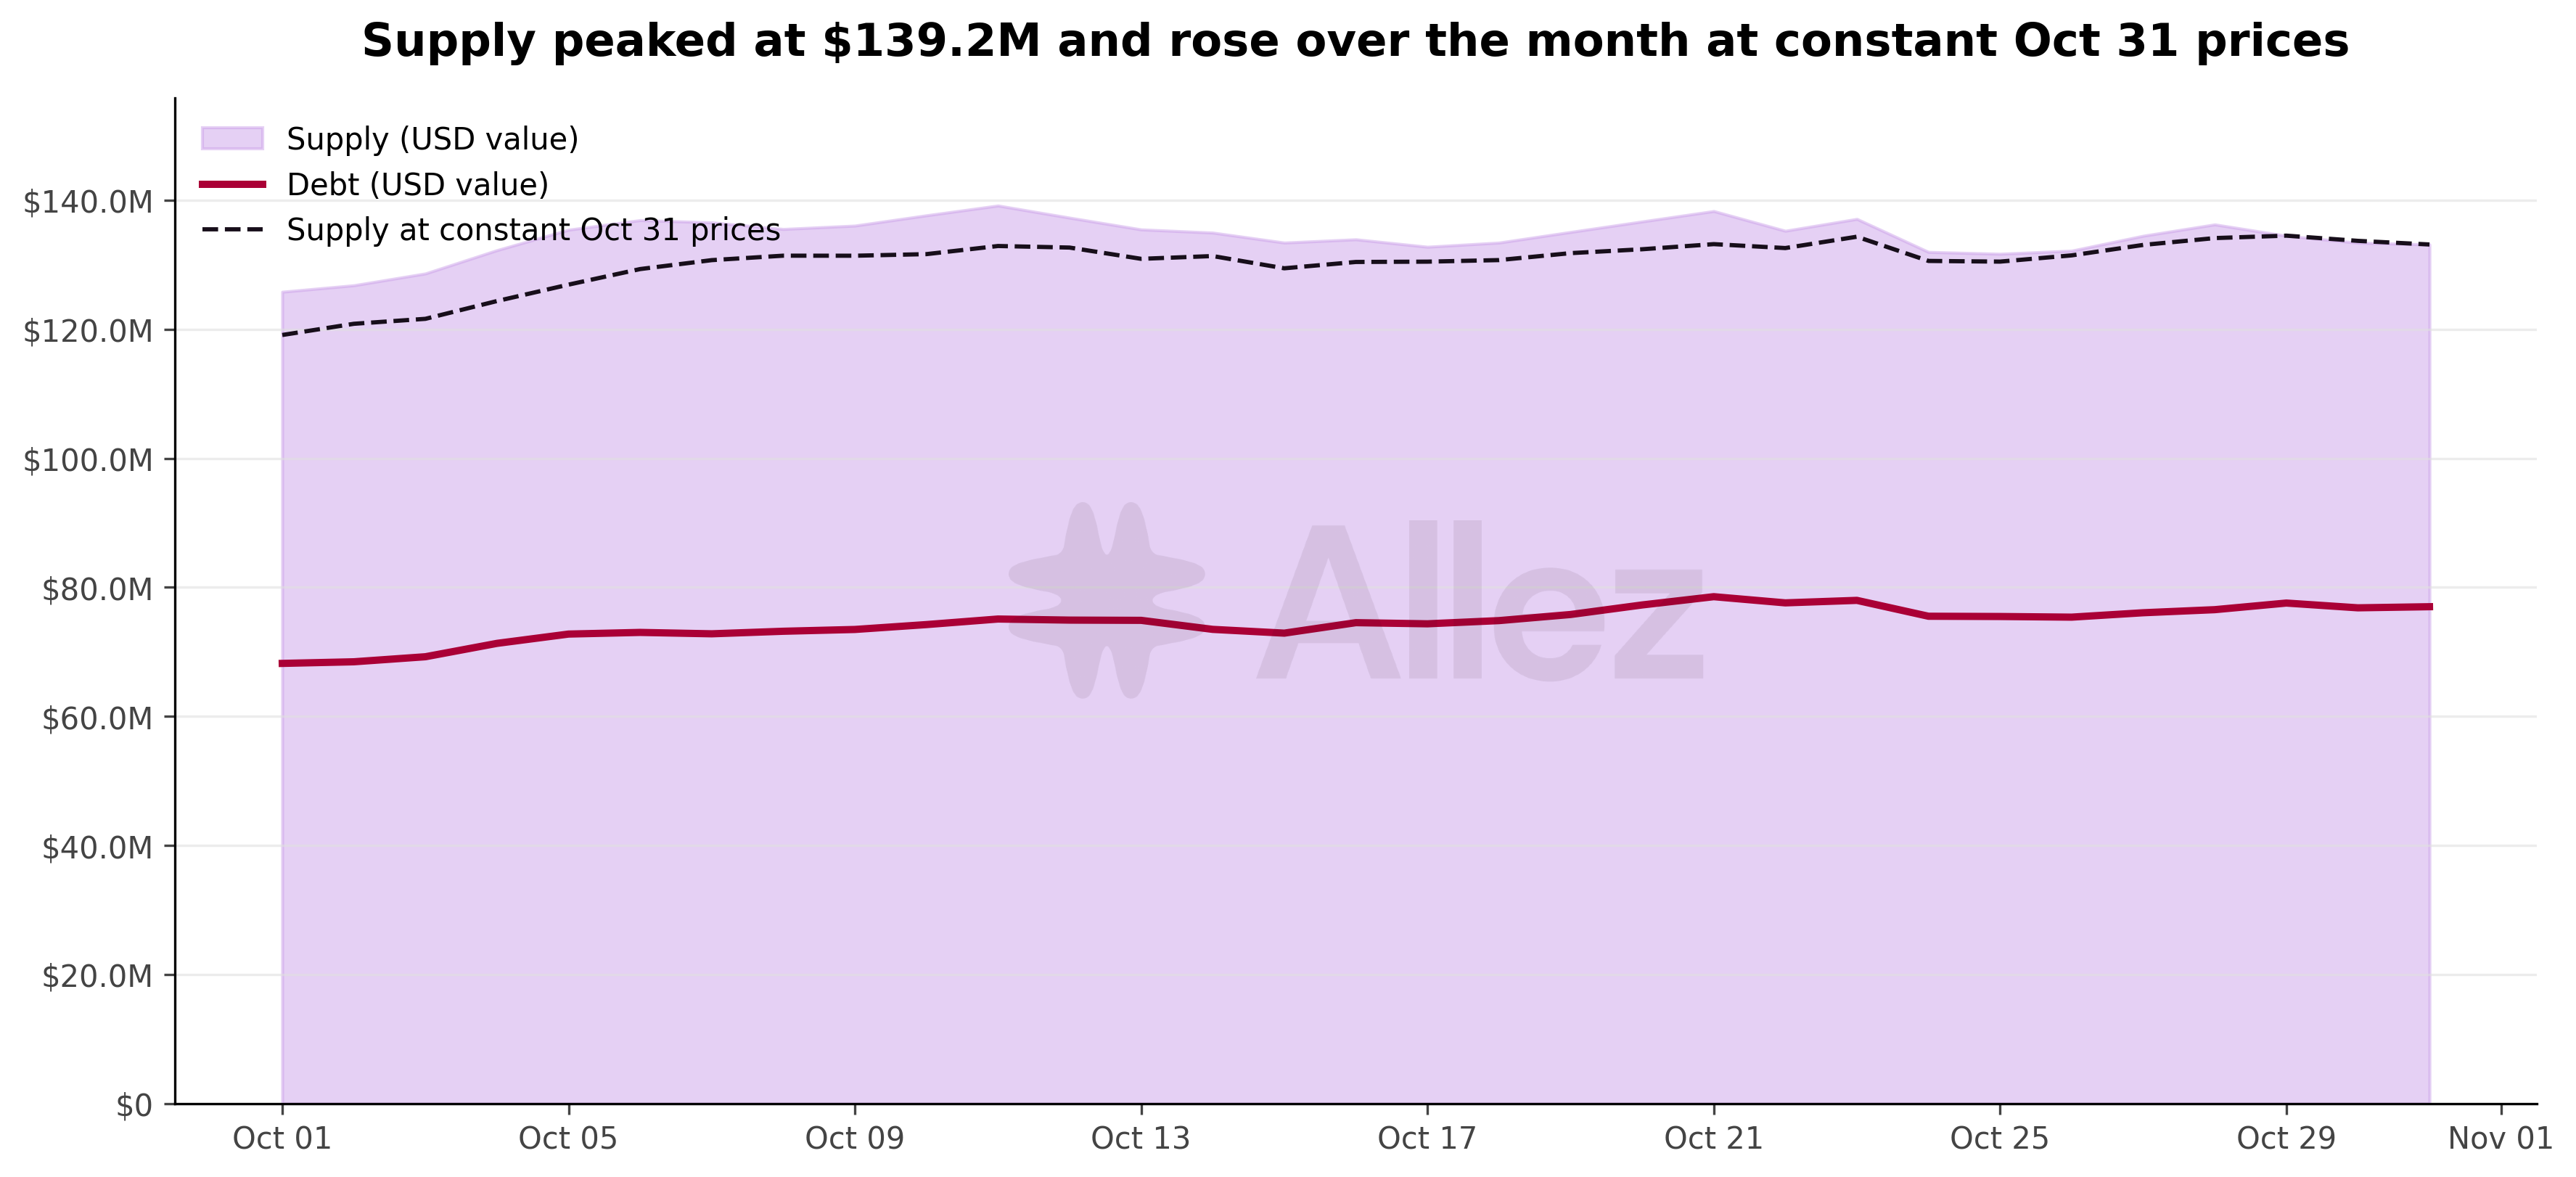
Supply peaked at $139M on October 11 and ranged between $132M and $138M for the rest of the month. At fixed October 31 prices (dashed line), supply rose over the month. Deposits continued to grow, but declining SUI and BTC prices partly offset the inflows in USD terms.
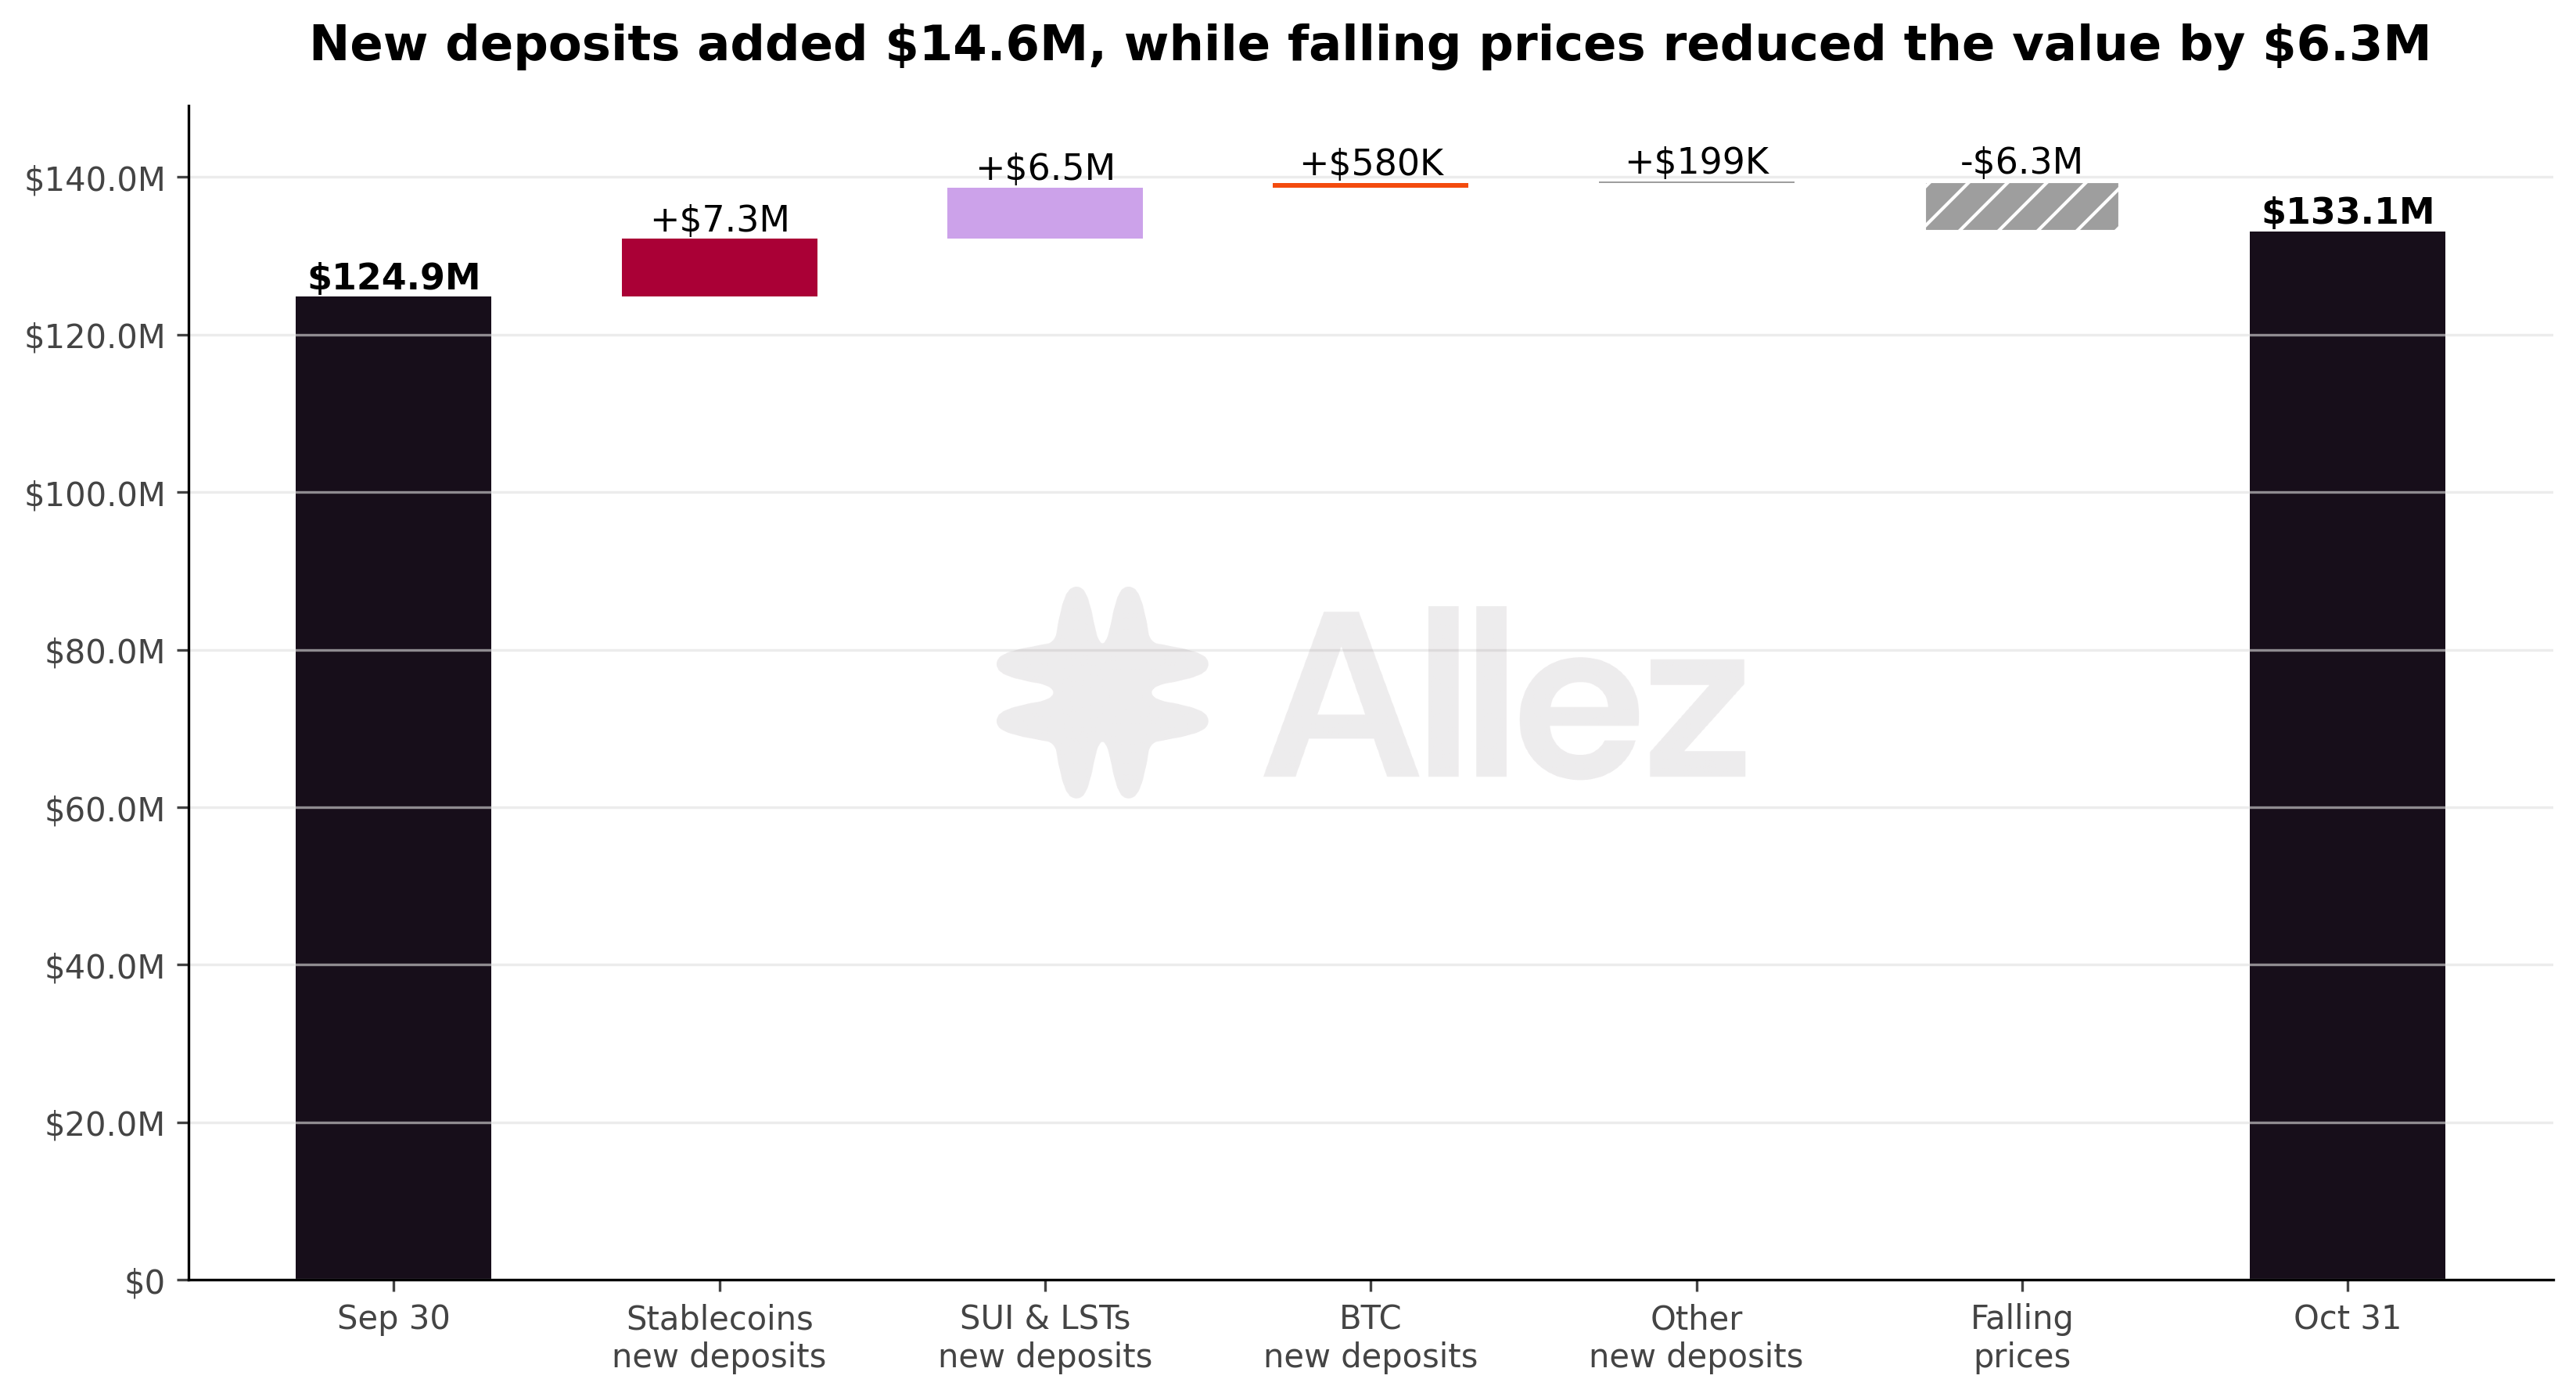
New deposits added $14.6M:
-
$7.3M of stablecoins
-
$6.5M of SUI and LSTs
-
$0.6M of BTC
-
$0.2M of other assets
Falling prices reduced the value by $6.3M, of which $4.8M came from SUI and LST balances and $1.5M from BTC.
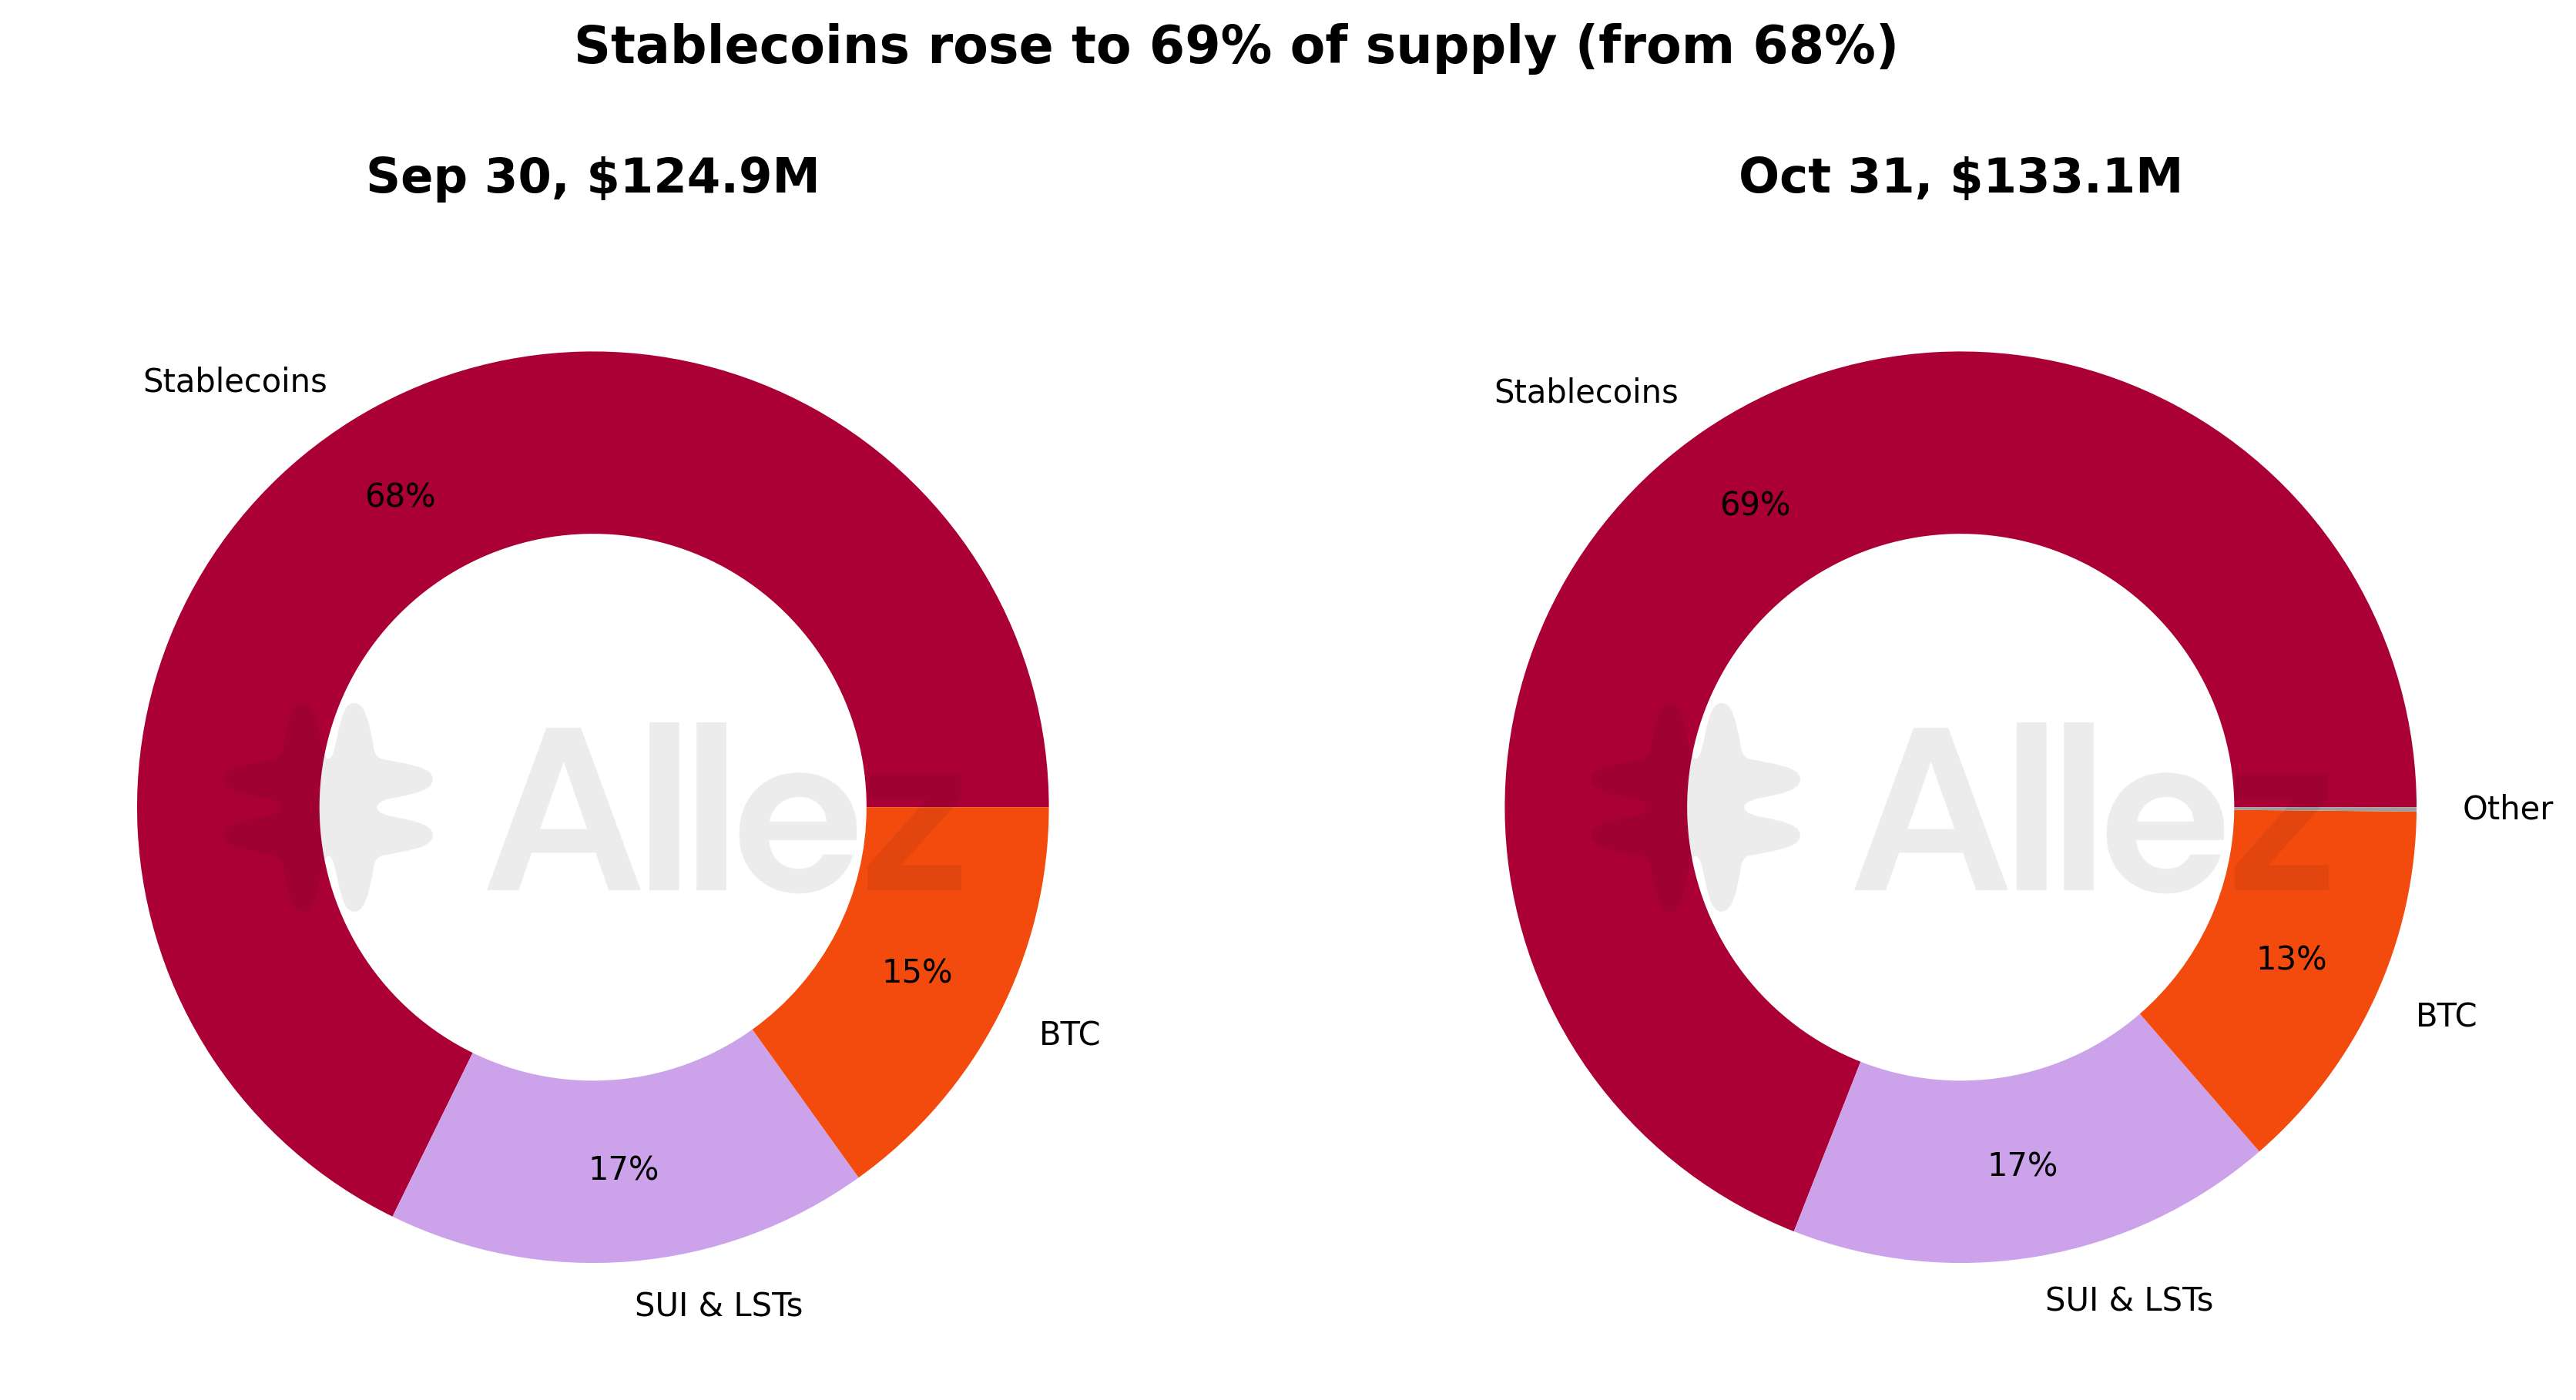
| Category | Sep 30 | Oct 31 | MoM | Share of supply |
|---|---|---|---|---|
| Stablecoins | $84.6M | $91.9M | +8.7% | 69.0% (+1.3pp) |
| SUI & LSTs | $21.4M | $23.1M | +7.8% | 17.3% (+0.2pp) |
| BTC | $18.9M | $17.9M | -4.8% | 13.5% (-1.6pp) |
SUI and LST supply still grew 8% in USD terms on continued deposit inflows. BTC was the only category to decline, with xBTC reaching its supply caps while BTC fell 7%.
Top reserves (Main market, October 31):
| Reserve | Supply | MoM | Debt | Utilization |
|---|---|---|---|---|
| USDC | $55.3M | +3% | $37.6M | 68% |
| usdSUI | $29.0M | +20% | $22.9M | 79% |
| SUI | $15.2M | +9% | $11.6M | 76% |
| haSUI | $7.8M | +5% | collateral only | n/a |
| USDT | $3.5M | +30% | $2.3M | 67% |
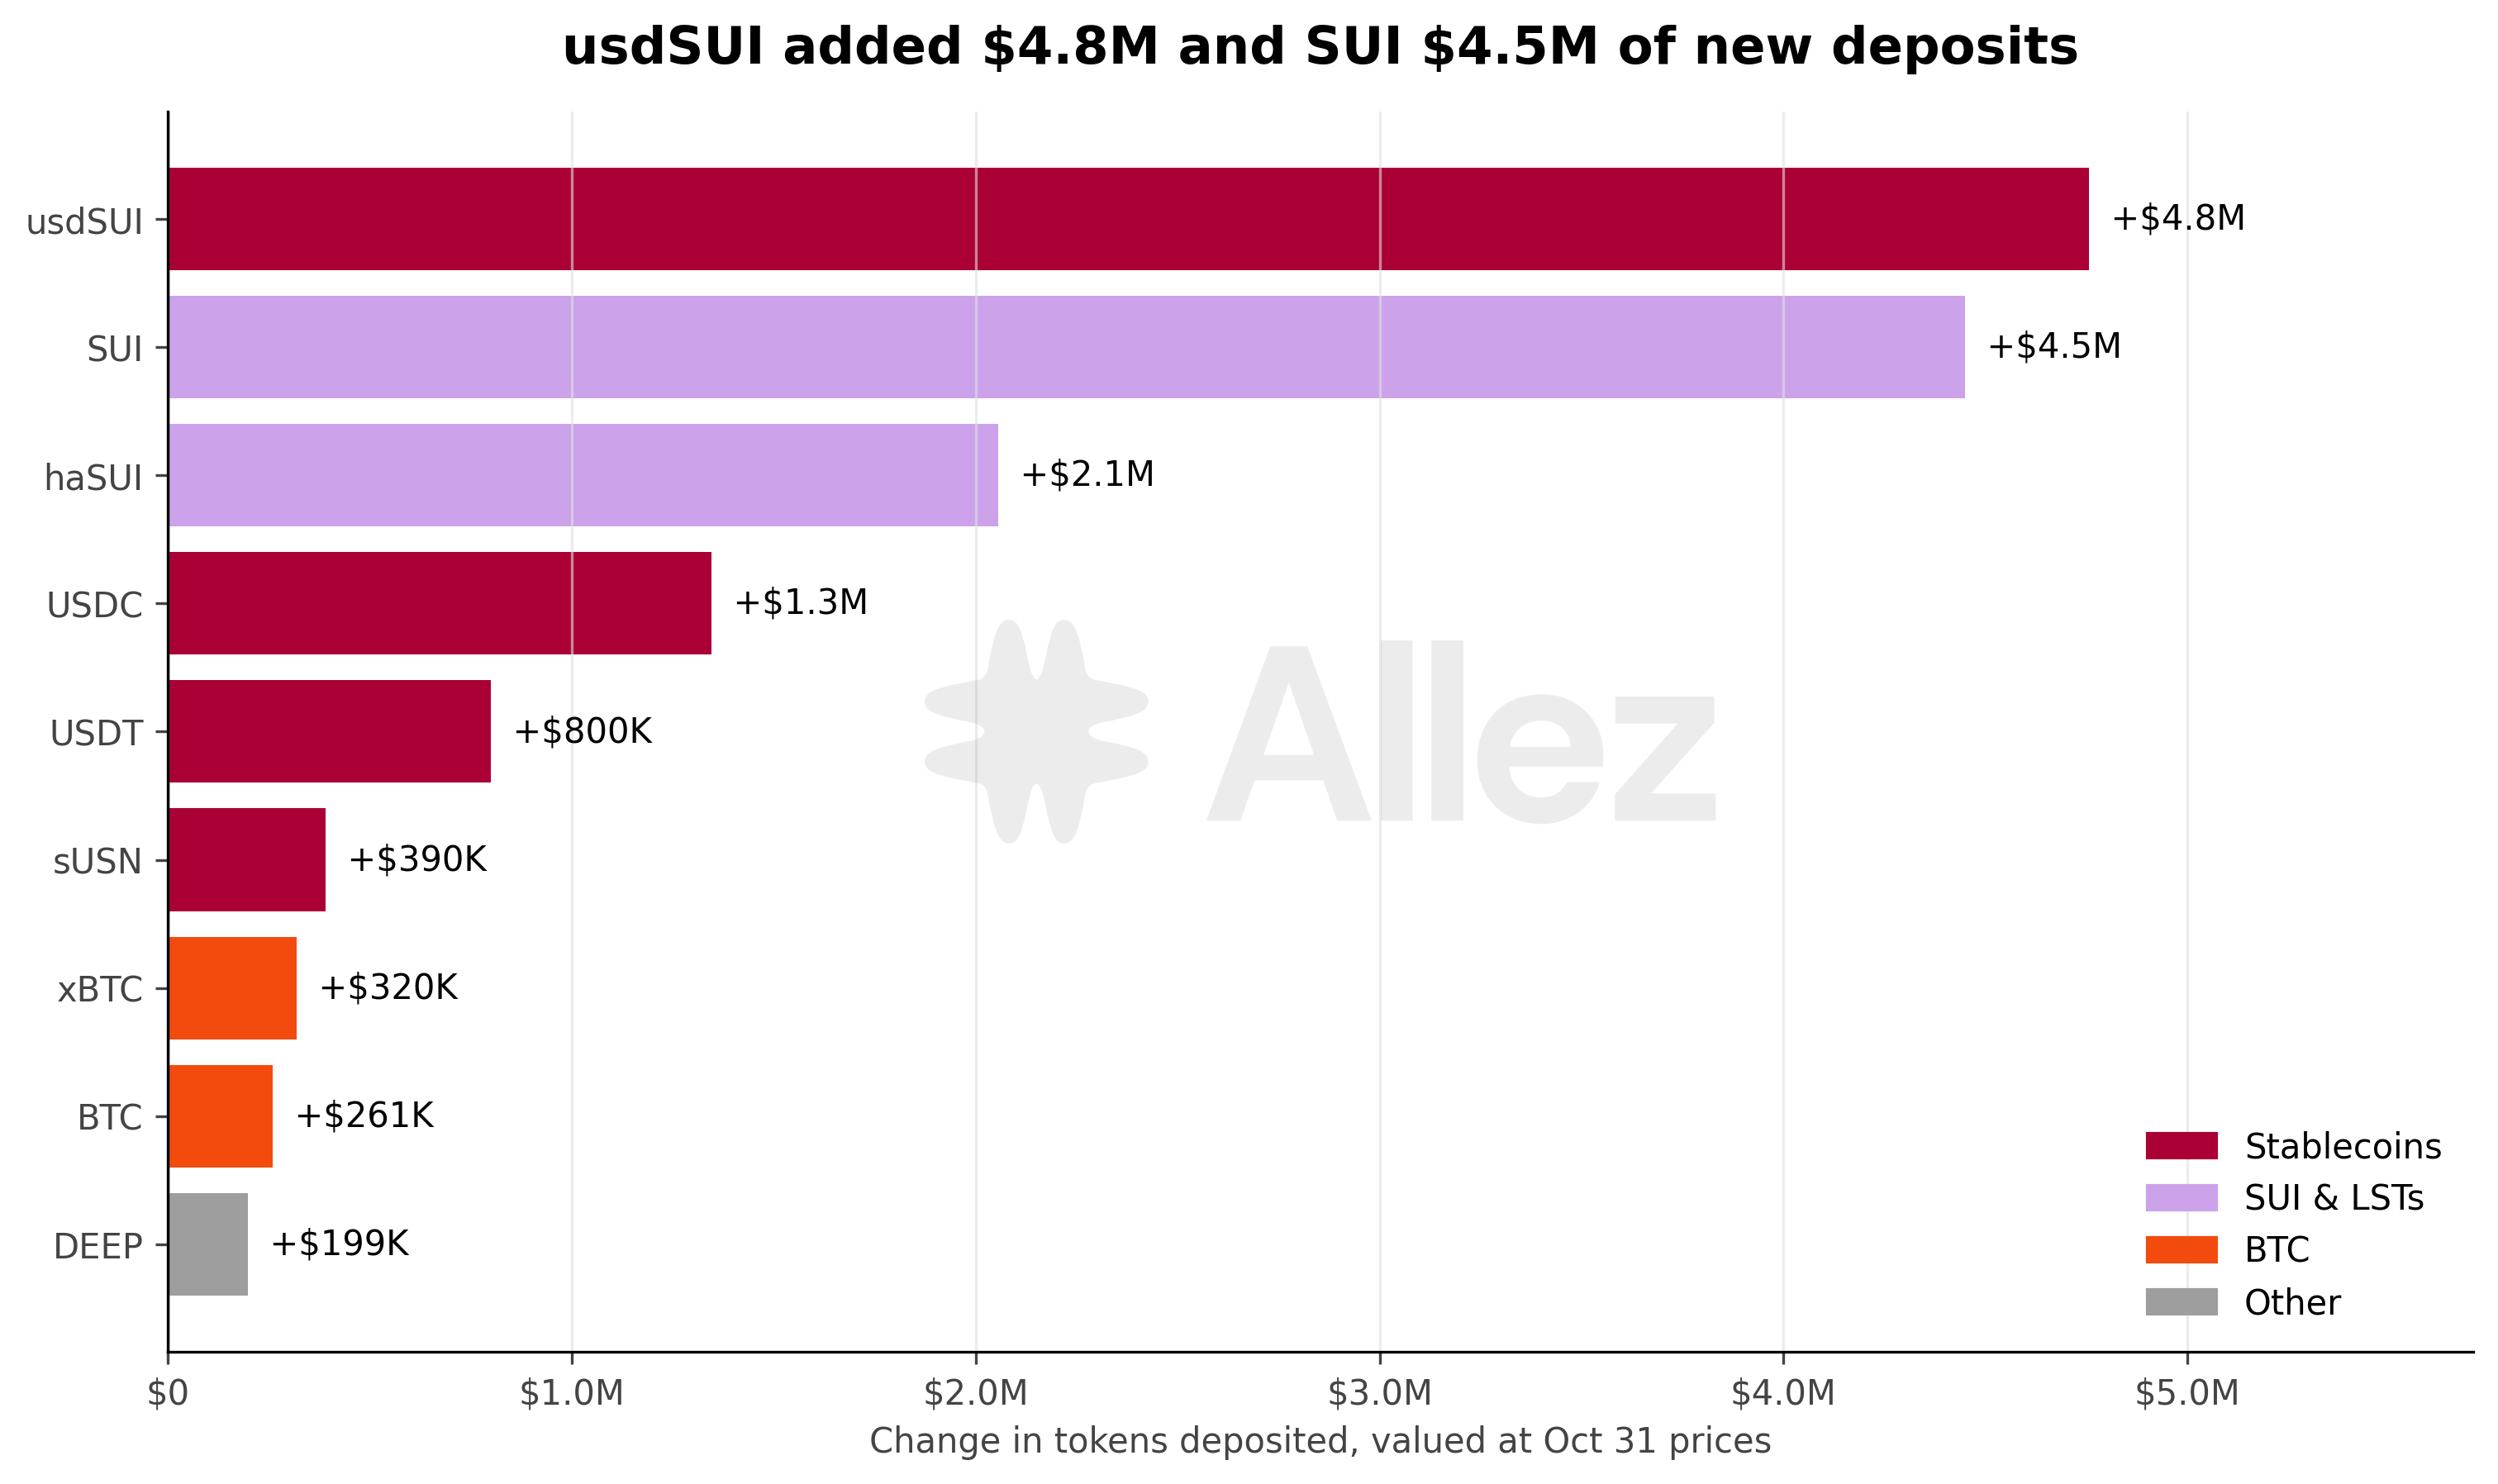
usdSUI added $4.8M of new deposits and SUI $4.5M. SUI deposits rose from 12M to 17M tokens (+41%) and haSUI from 5.9M to 8.1M (+36%).
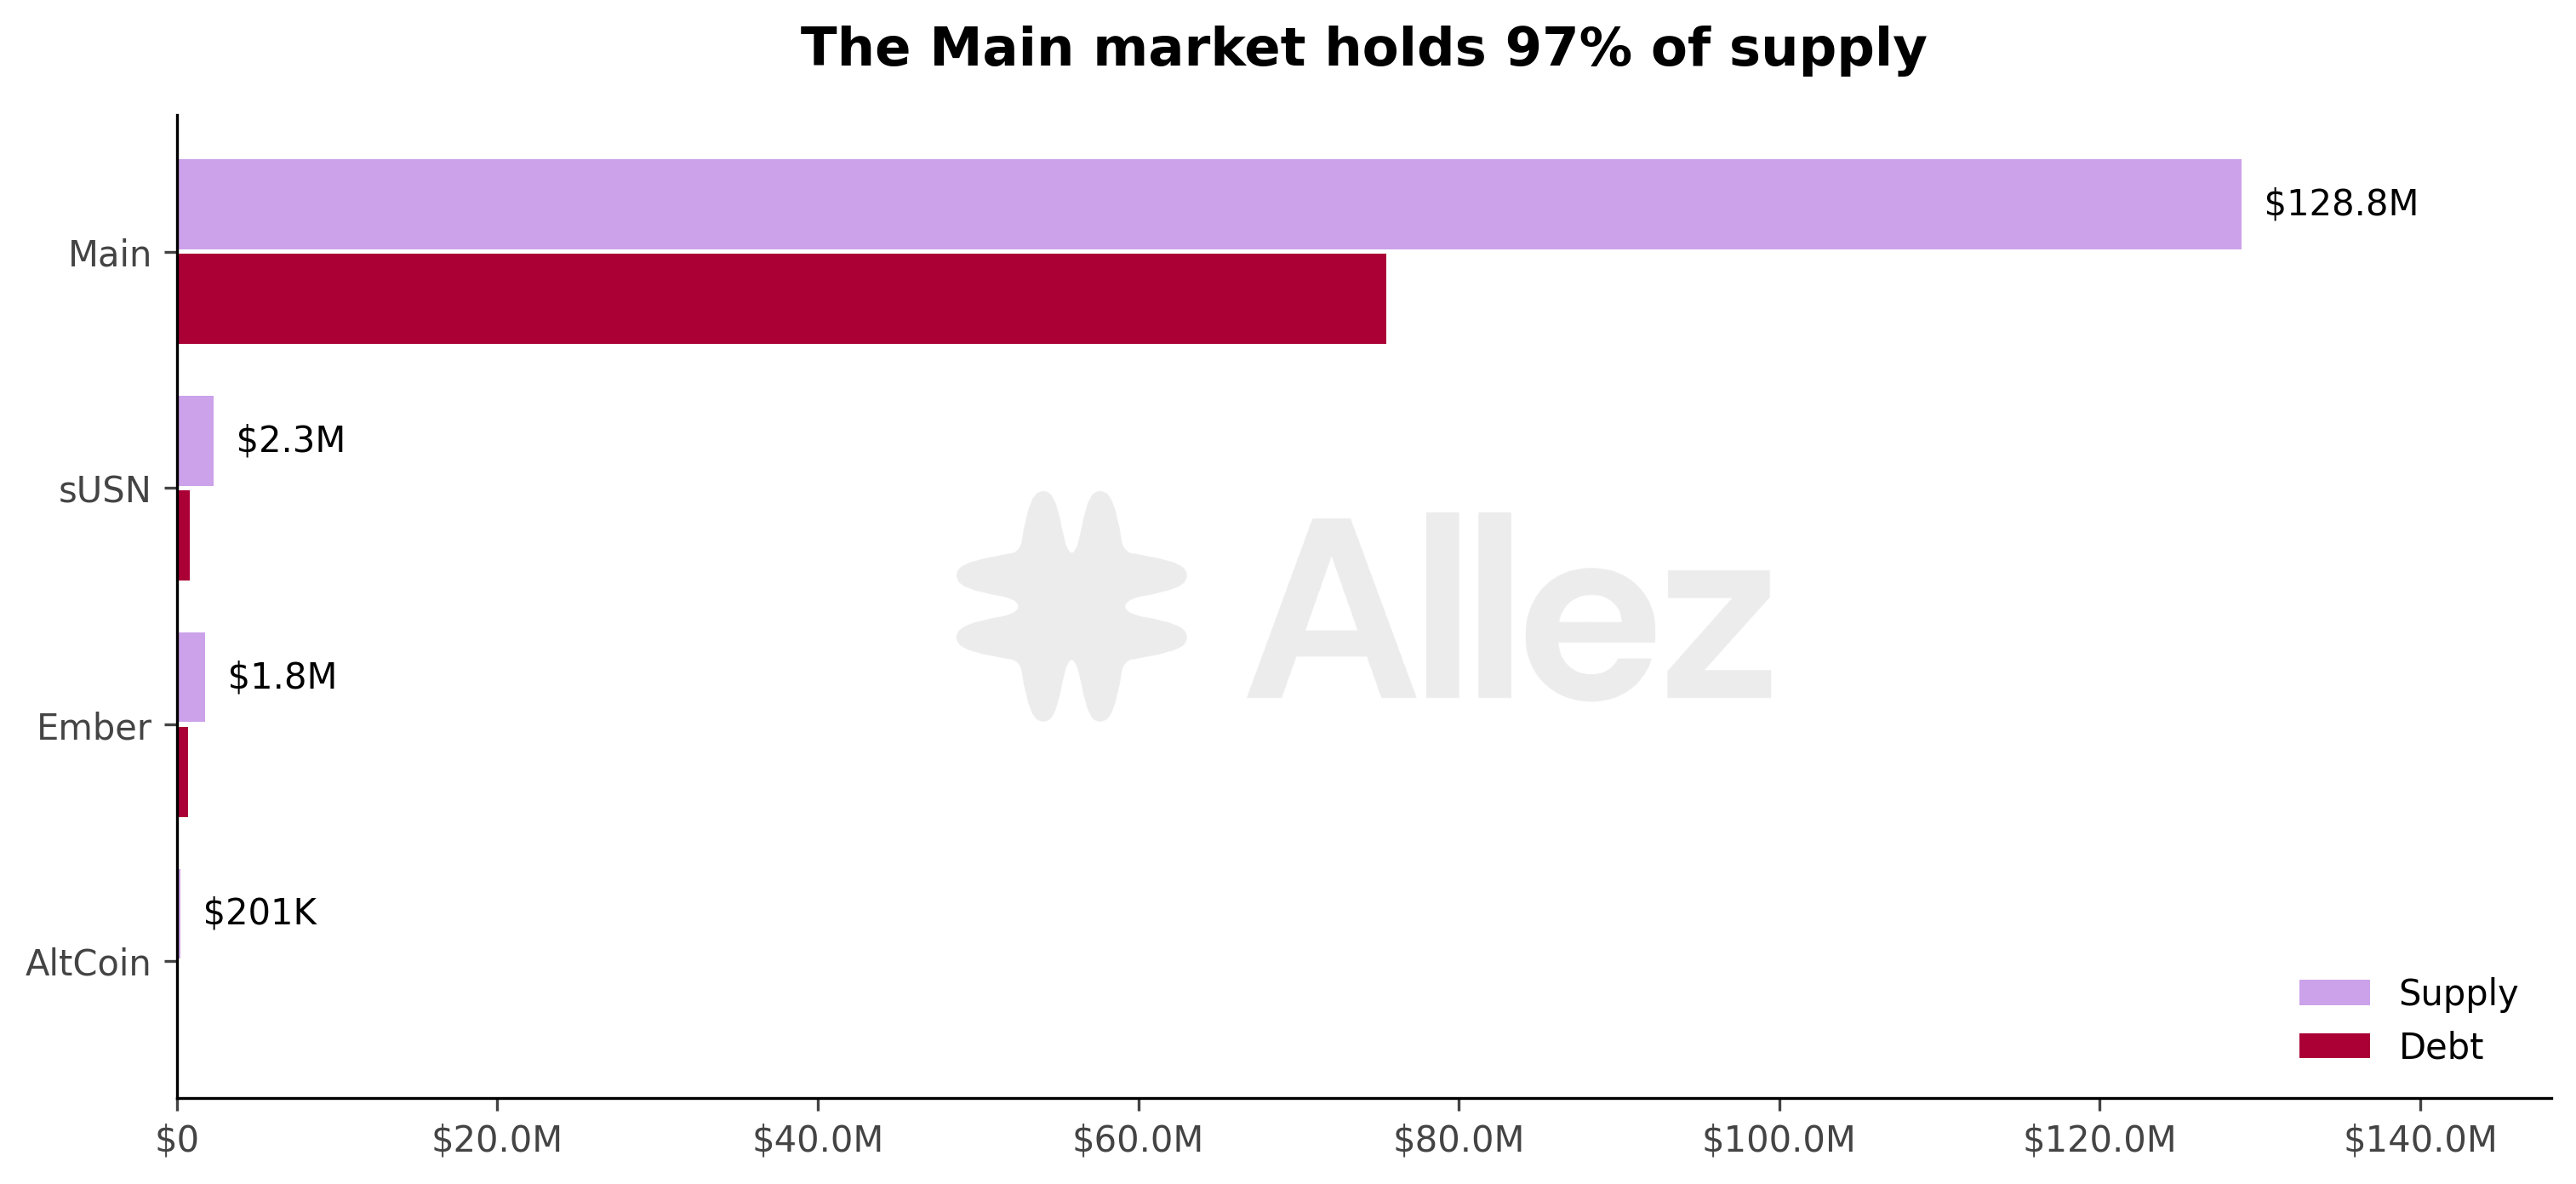
The Main market holds $129M of supply (+7%), 97% of the total. The sUSN market grew 9% from $2.1M to $2.3M, Ember held at $1.8M and the AltCoin market rose from $4K to $0.2M.
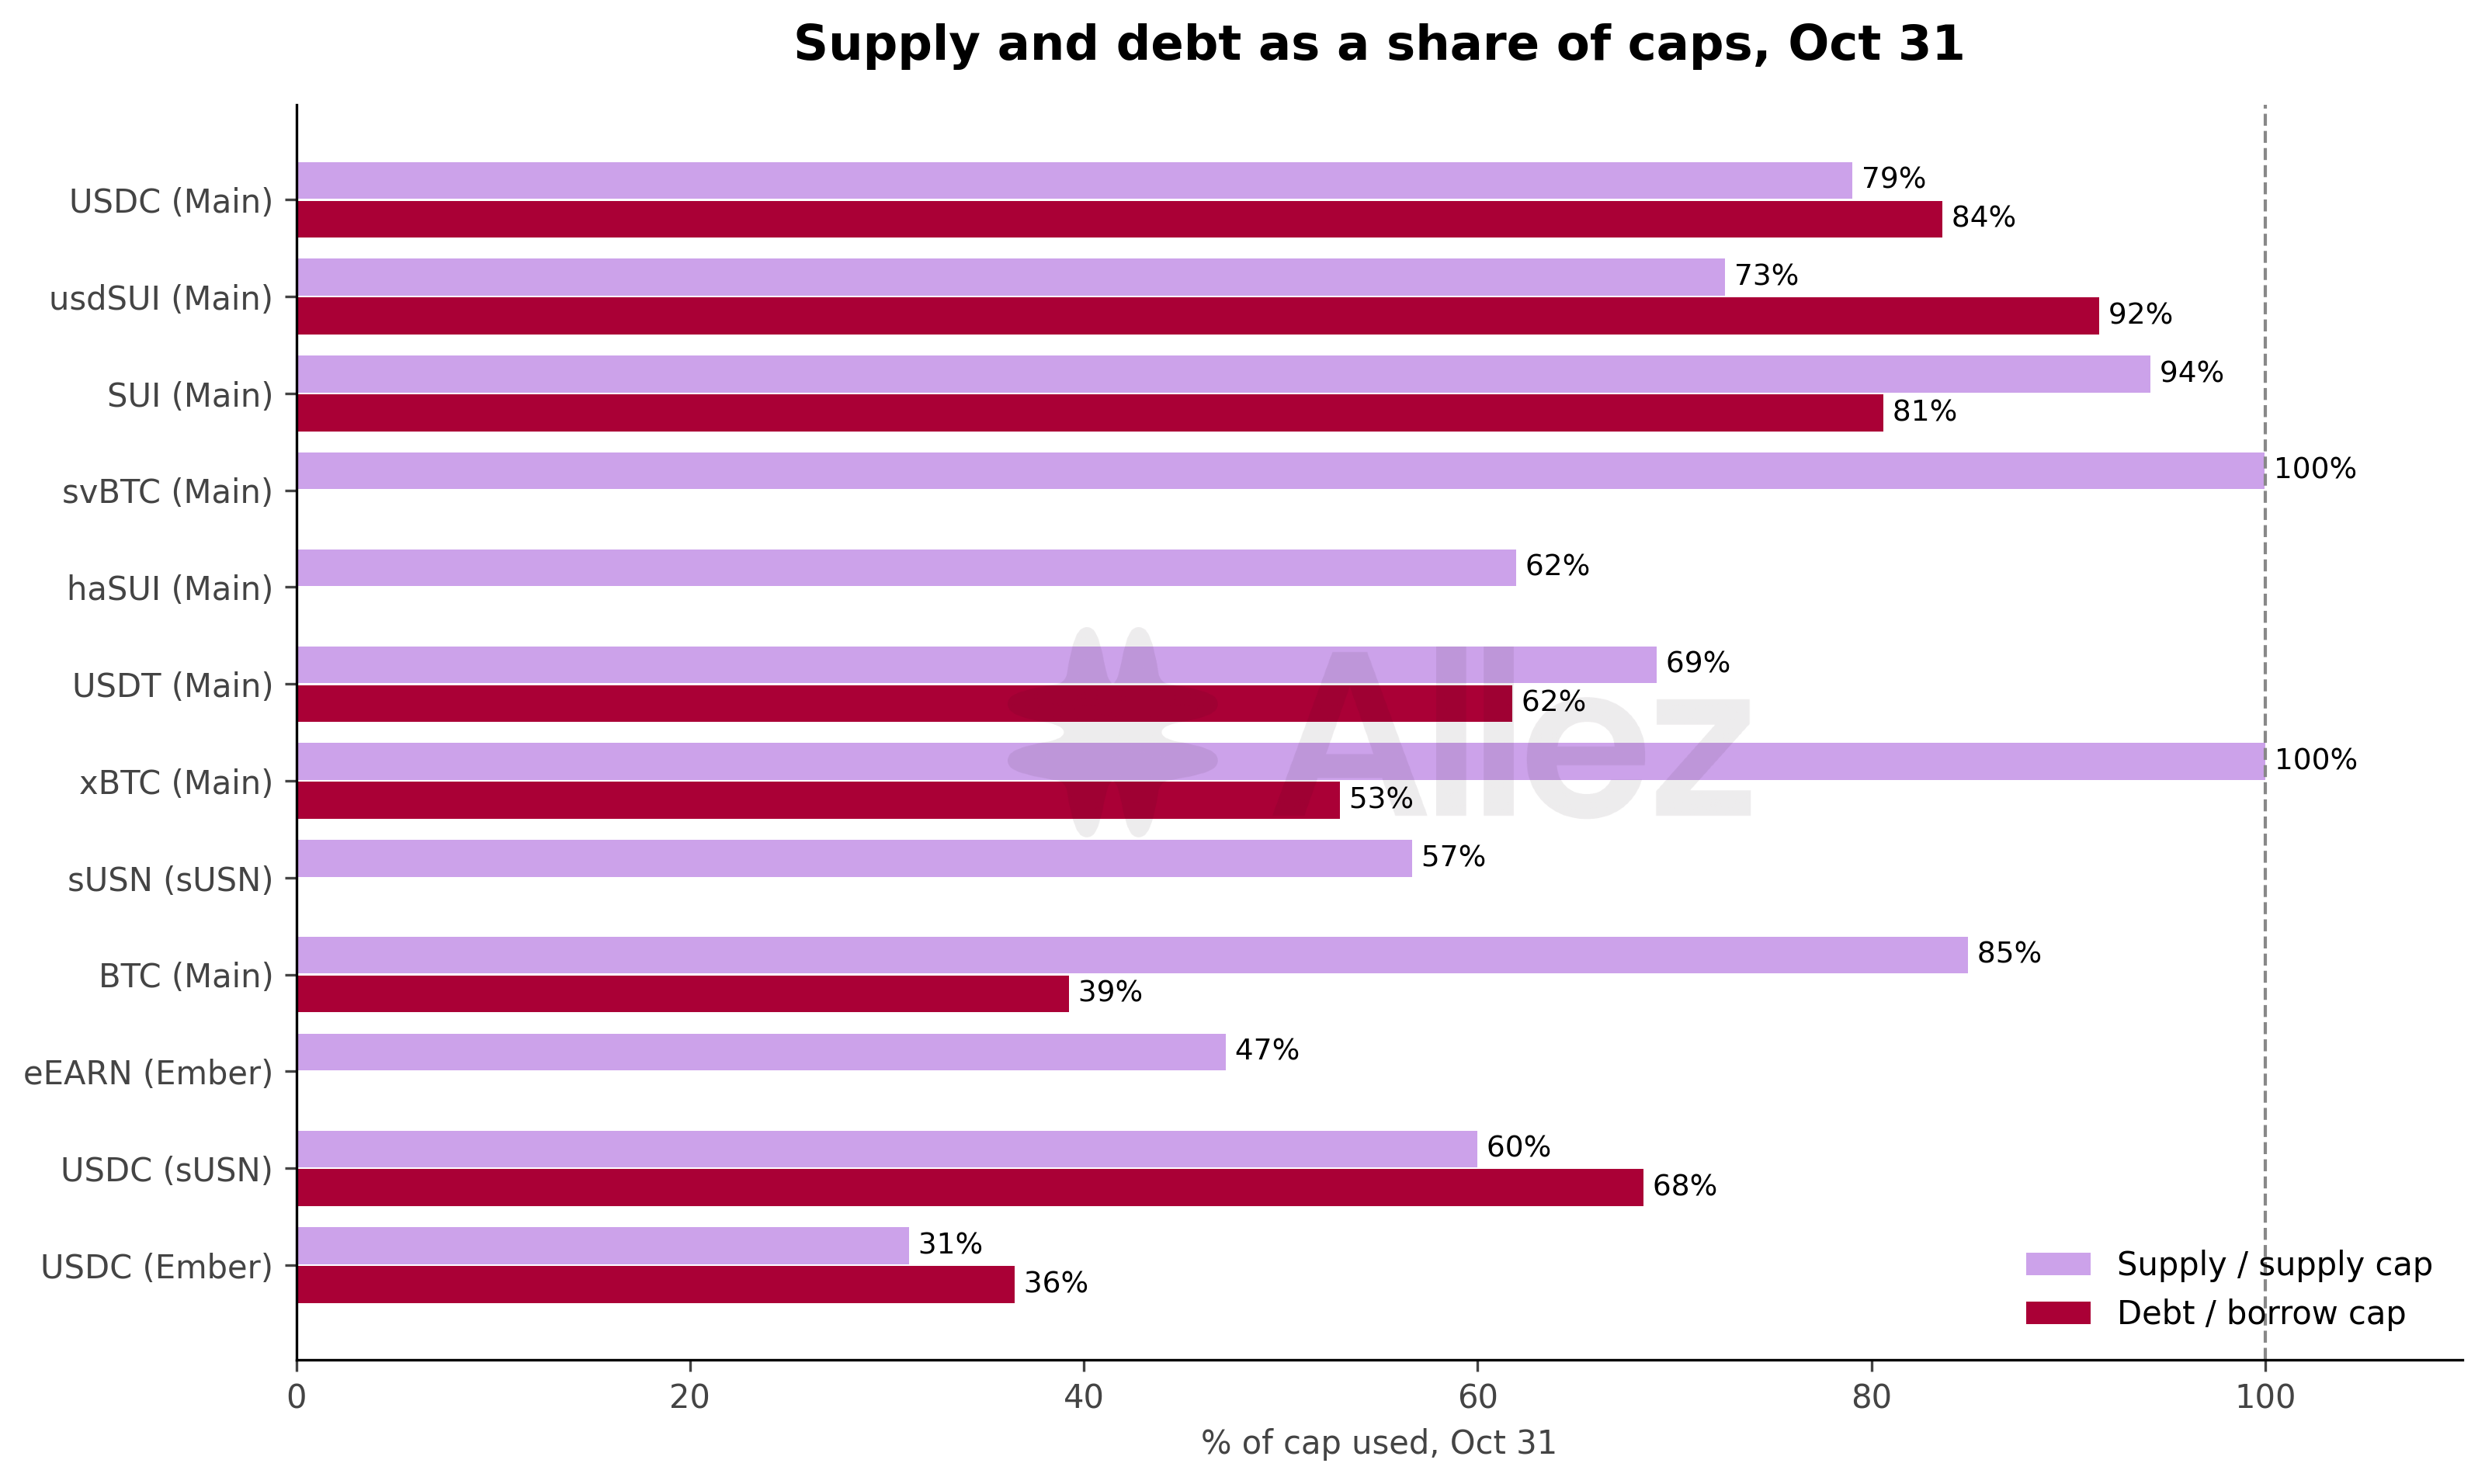
Cap changes in October:
| Date (UTC) | Market | Reserve | Supply cap | Borrow cap |
|---|---|---|---|---|
| Oct 8 | Main | USDC | unchanged ($70M) | $36M to $45M |
| Oct 8 | Main | usdSUI | $30M to $40M | unchanged ($25M) |
| Oct 24 | sUSN | sUSN | 818K to 2M sUSN | n/a |
| Oct 24 | sUSN | USDC | unchanged ($1.5M) | $0.75M to $1.2M |
| Oct 30 to 31 | Main | SUI, BTC | unchanged | borrowing paused (01:07 Oct 30 to 14:16 and 14:21 Oct 31) |
| Oct 30 | Main | xBTC | unchanged | borrowing paused from 01:07 Oct 30, still paused at month-end |
Current also raised e-mode borrow limits for USDC, usdSUI and SUI in October, and moved the sUSN e-mode group from a 60% collateral factor and 70% liquidation threshold to 75% and 80%.
3. Growth Drivers
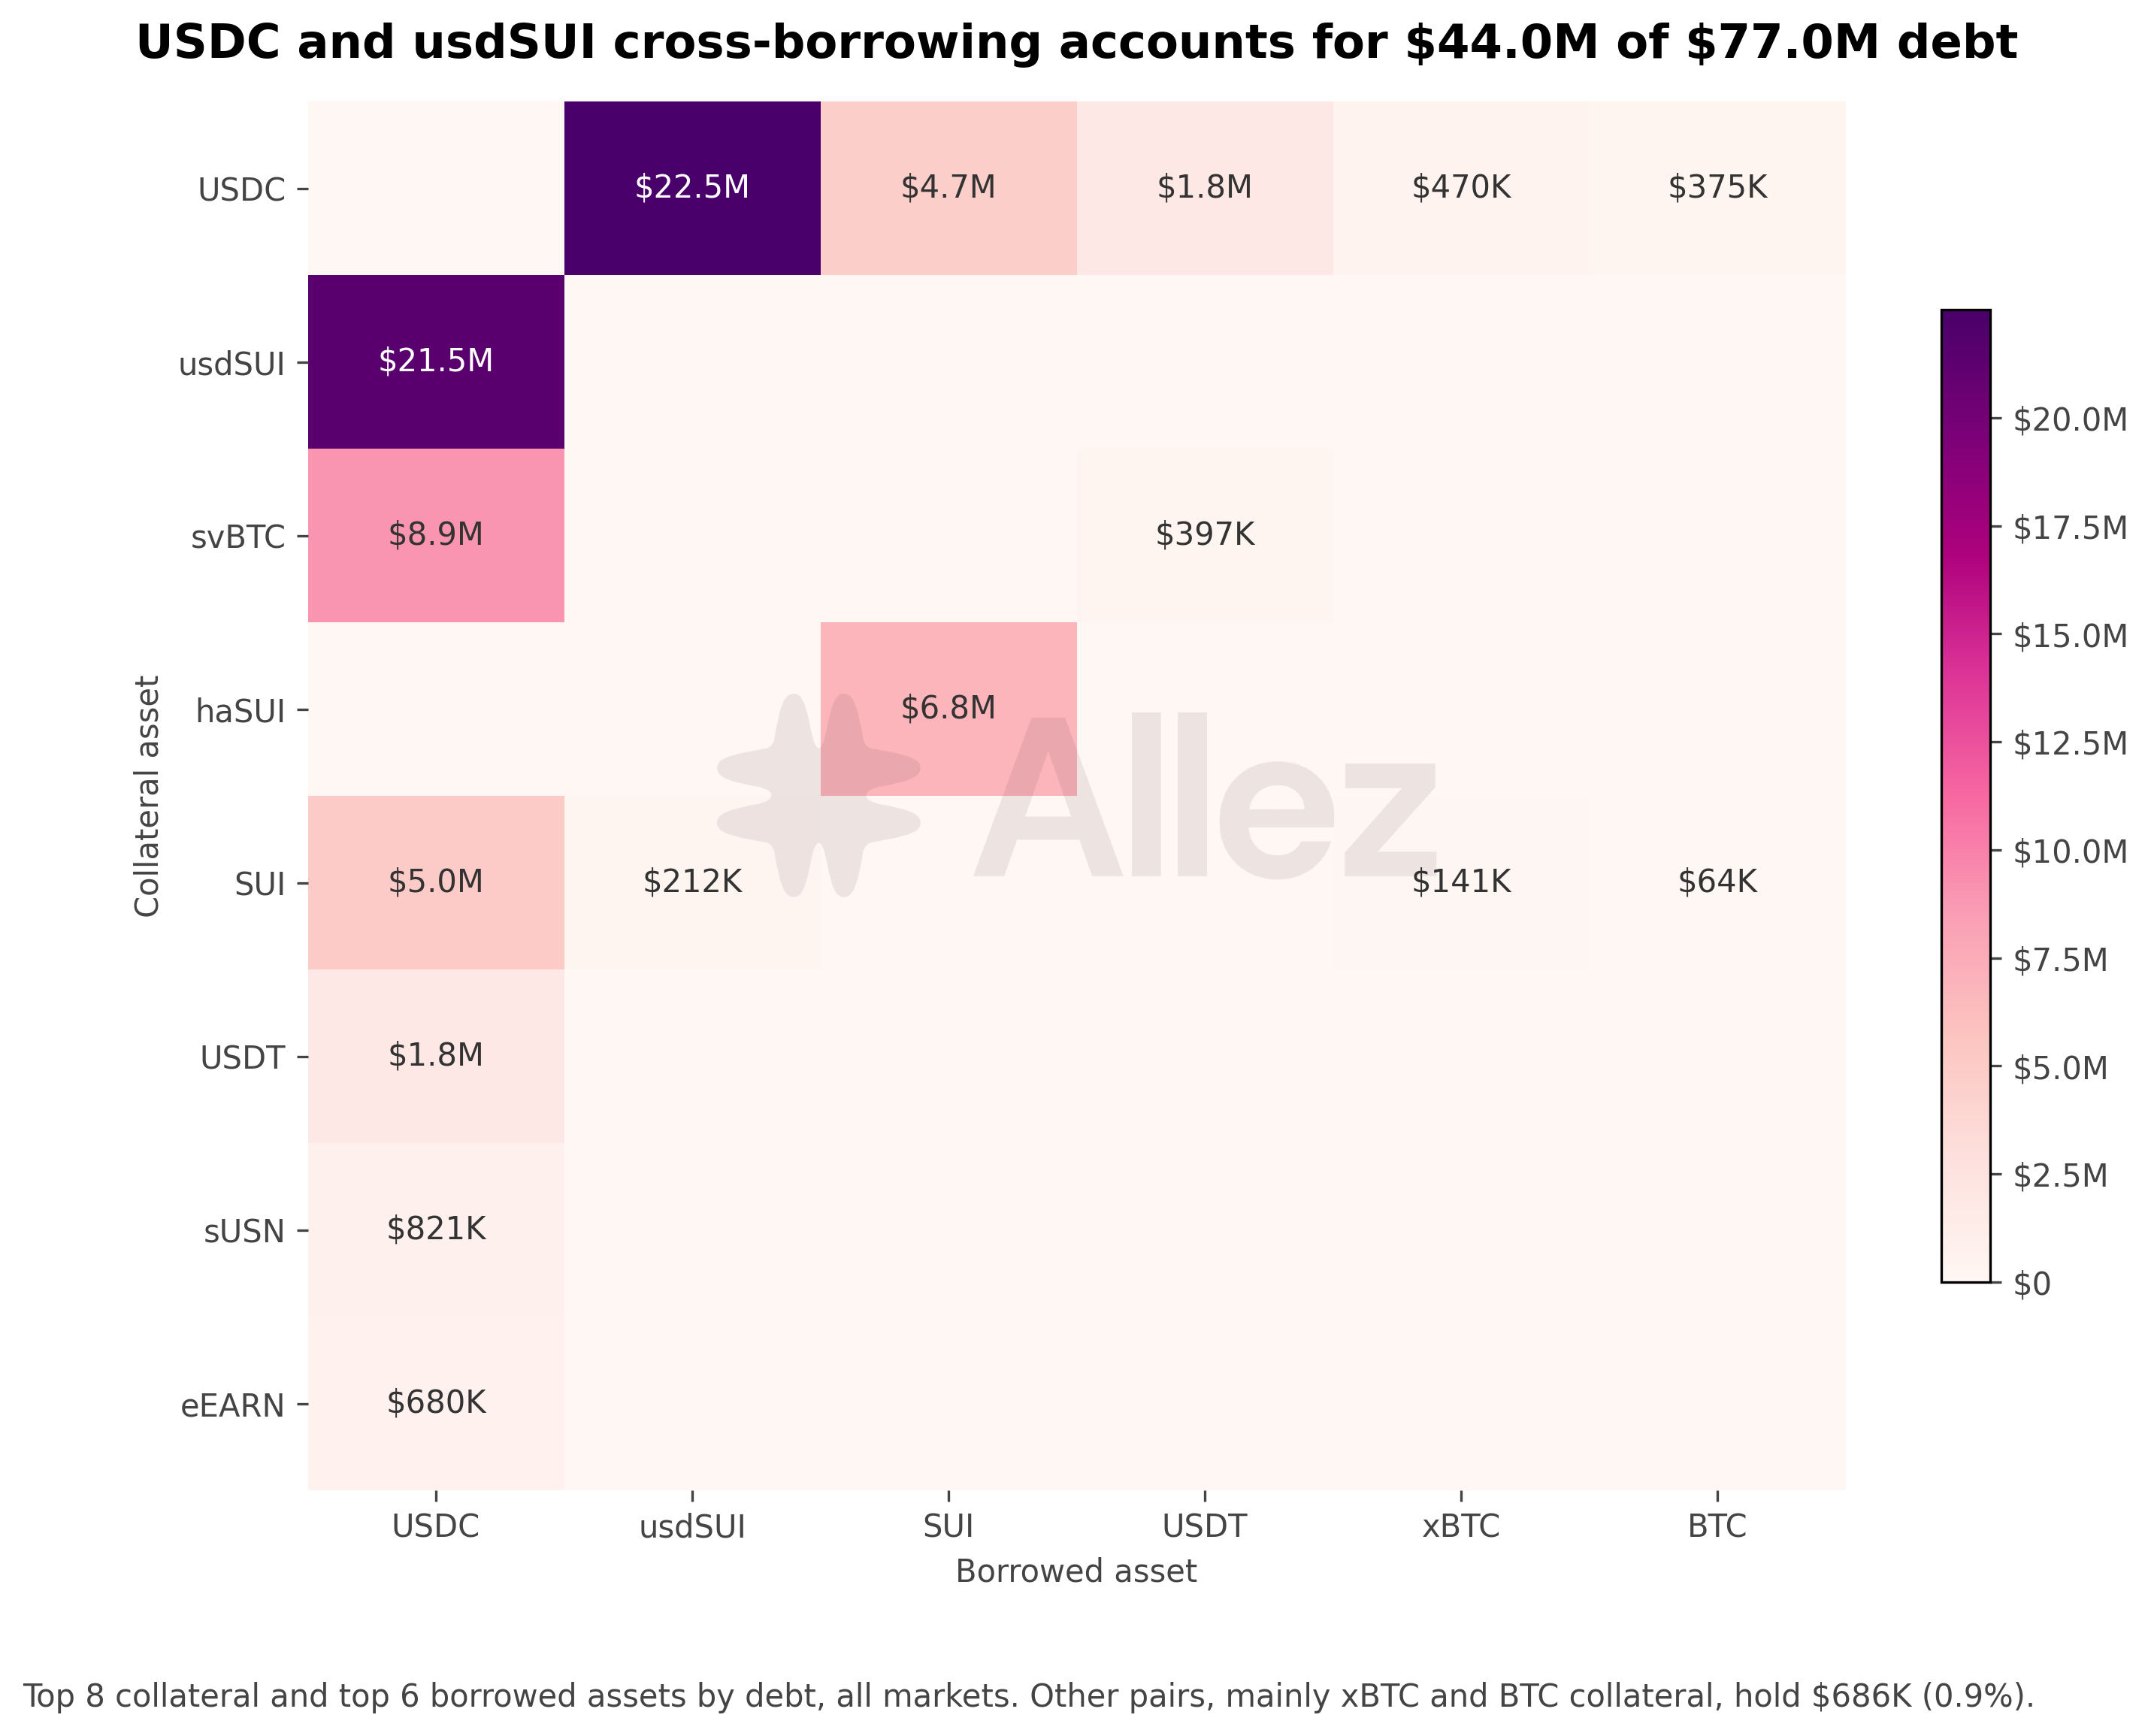
Stablecoin pairs account for the largest share of debt across all markets. USDC-backed usdSUI debt reached $22.5M, while usdSUI-backed USDC debt stood at $21.5M. Combined debt increased from $35.9M on September 30 to $44.0M. Within e-mode, usdSUI-backed USDC debt grew from $10M to $12M, while USDC-backed usdSUI debt rose from $5.6M to $8.8M.
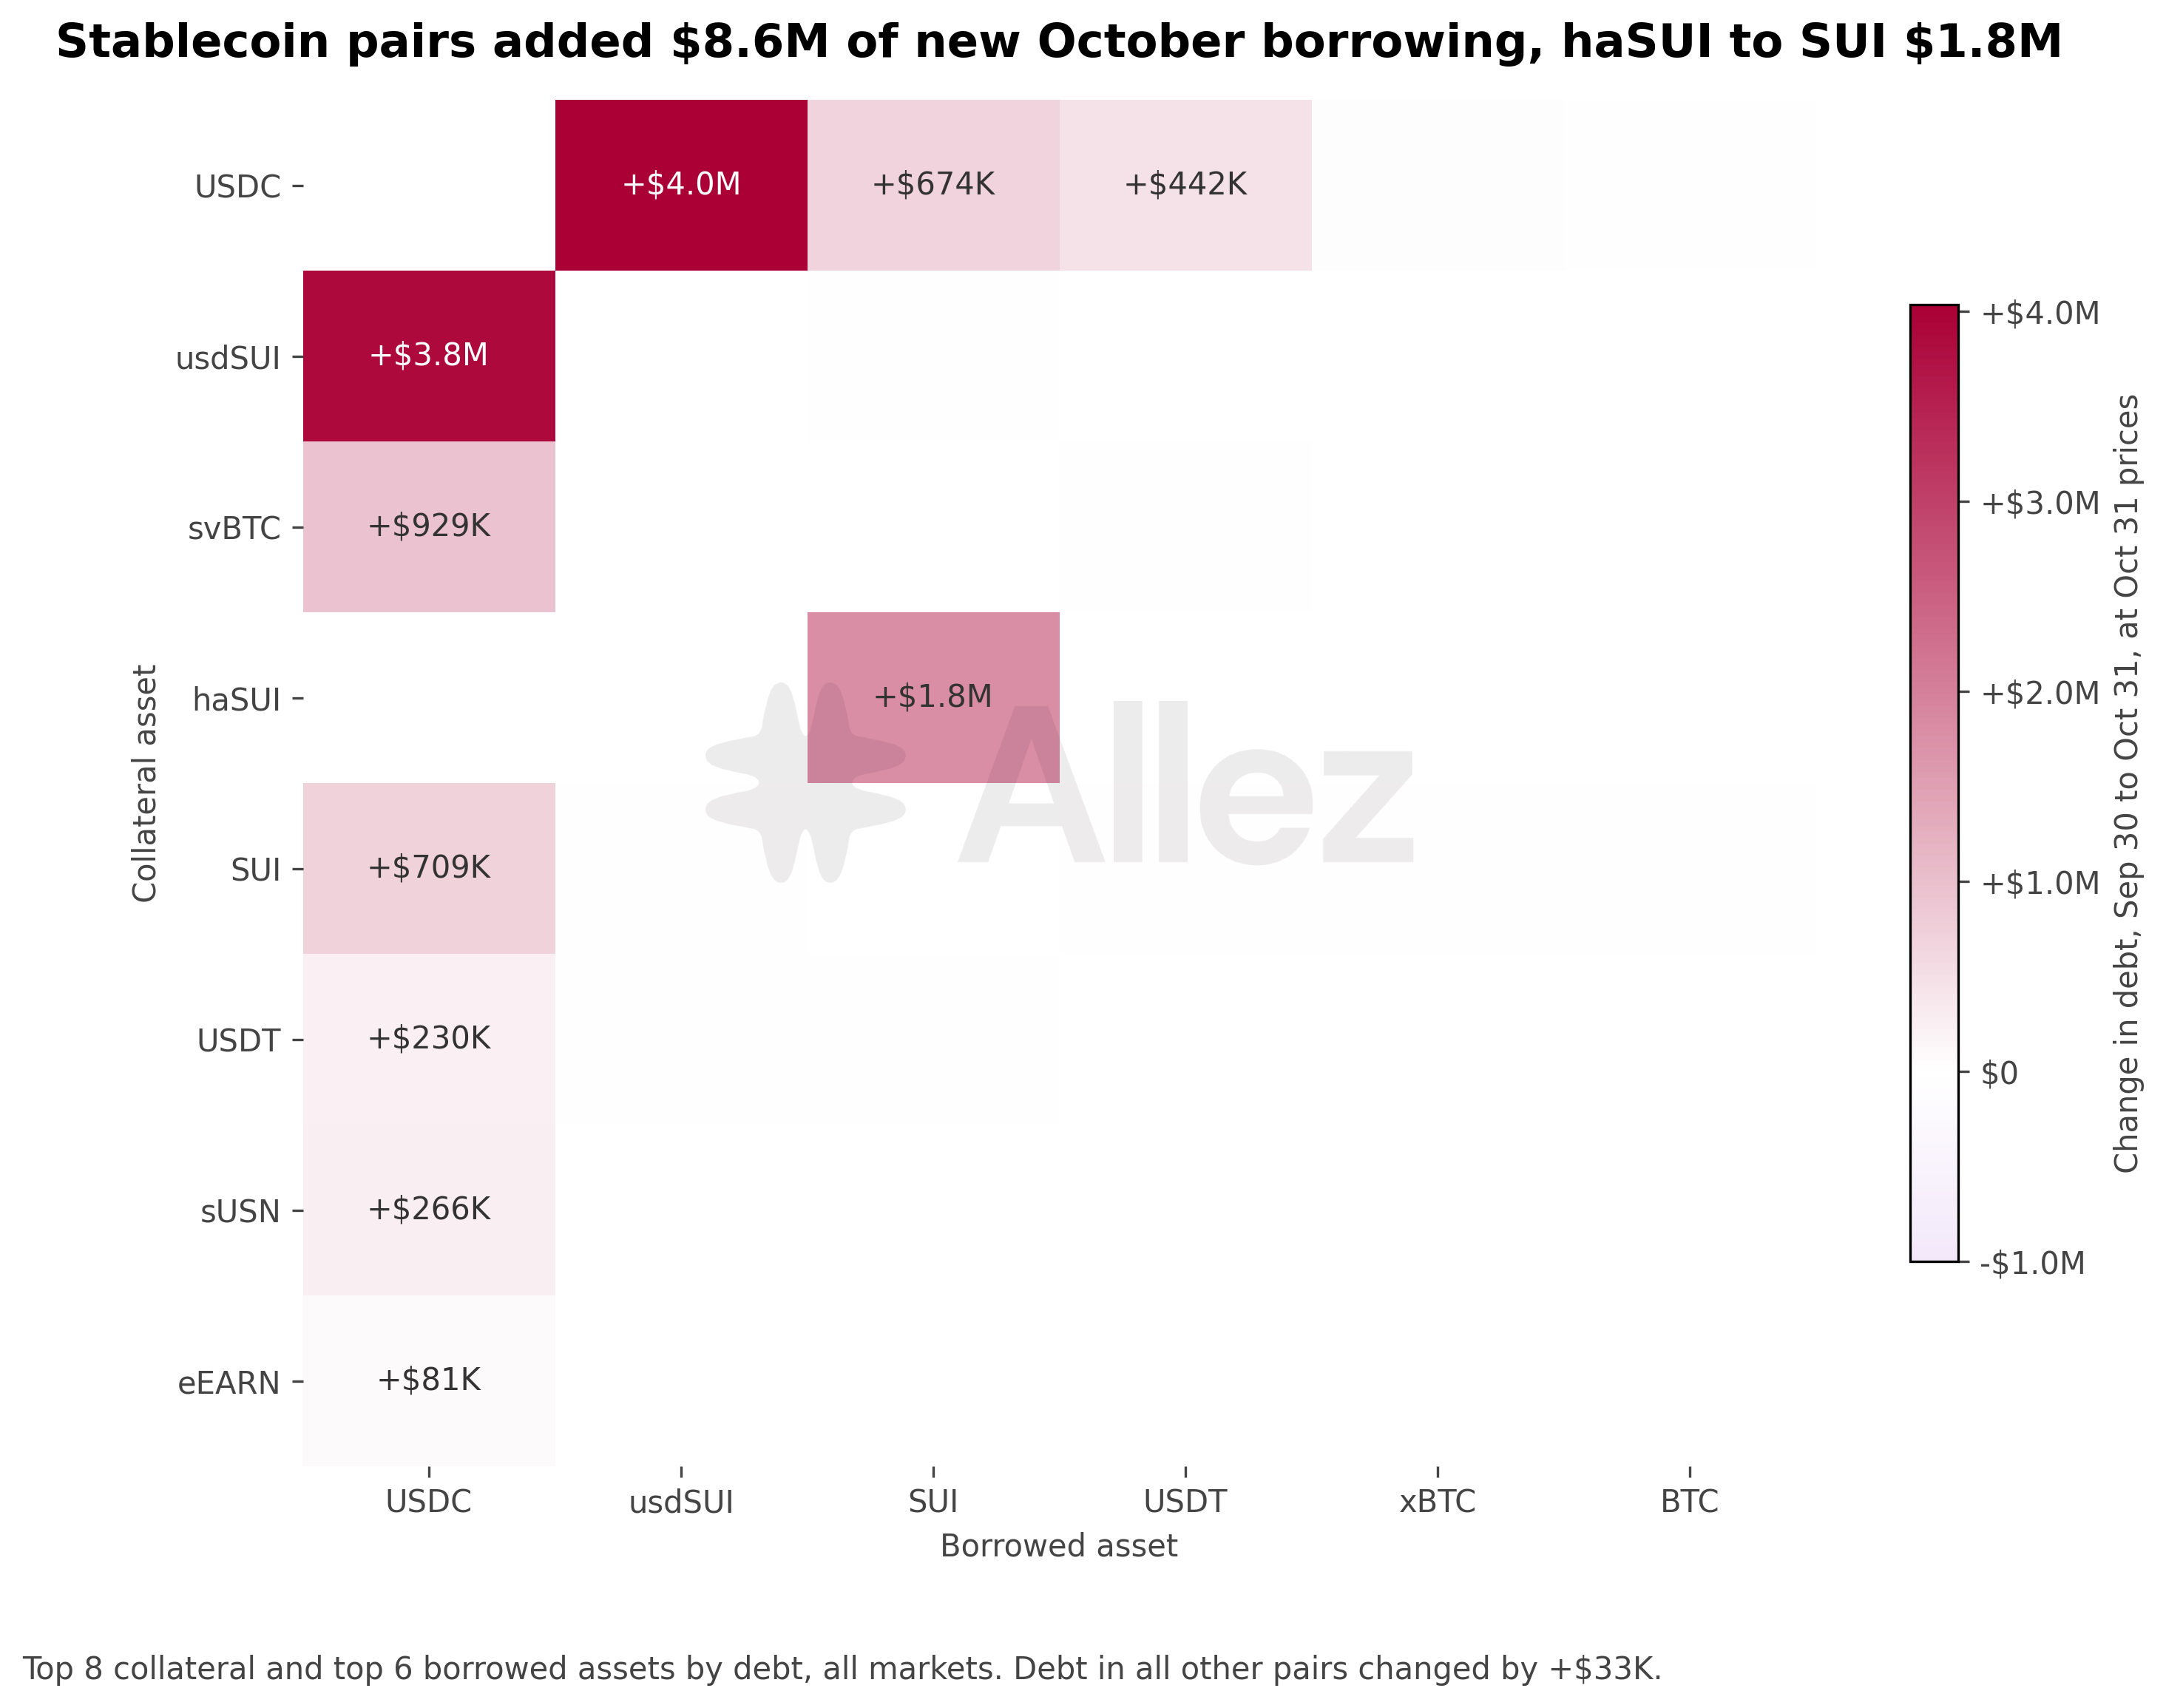
At October 31 prices, total debt across all markets increased by $13M, driven by $8.6M in stablecoin pairs. Among non-stablecoin pairs, the largest increases were:
| Collateral | Debt asset | Oct 31 debt | MoM change at Oct 31 prices |
|---|---|---|---|
| haSUI | SUI | $6.8M | +$1.8M |
| SUI | USDC | $5.0M | +$0.7M |
| USDC | SUI | $4.7M | +$0.7M |
The last two pairs have opposite SUI price exposure. SUI collateral against USDC debt becomes less healthy as SUI falls, while USDC collateral against SUI debt becomes less healthy as SUI rises.
Debt concentration (October 31):
| Measure | Sep 30 debt | Oct 31 debt | Share of position debt |
|---|---|---|---|
| Largest position | $8.36M | $9.29M | 12.1% (-0.4pp) |
| Top 5 positions | $25.0M | $25.9M | 33.6% (-3.9pp) |
| Top 10 positions | $34.3M | $35.7M | 46.4% (-4.9pp) |
4. Liquidation Risk and Position Health
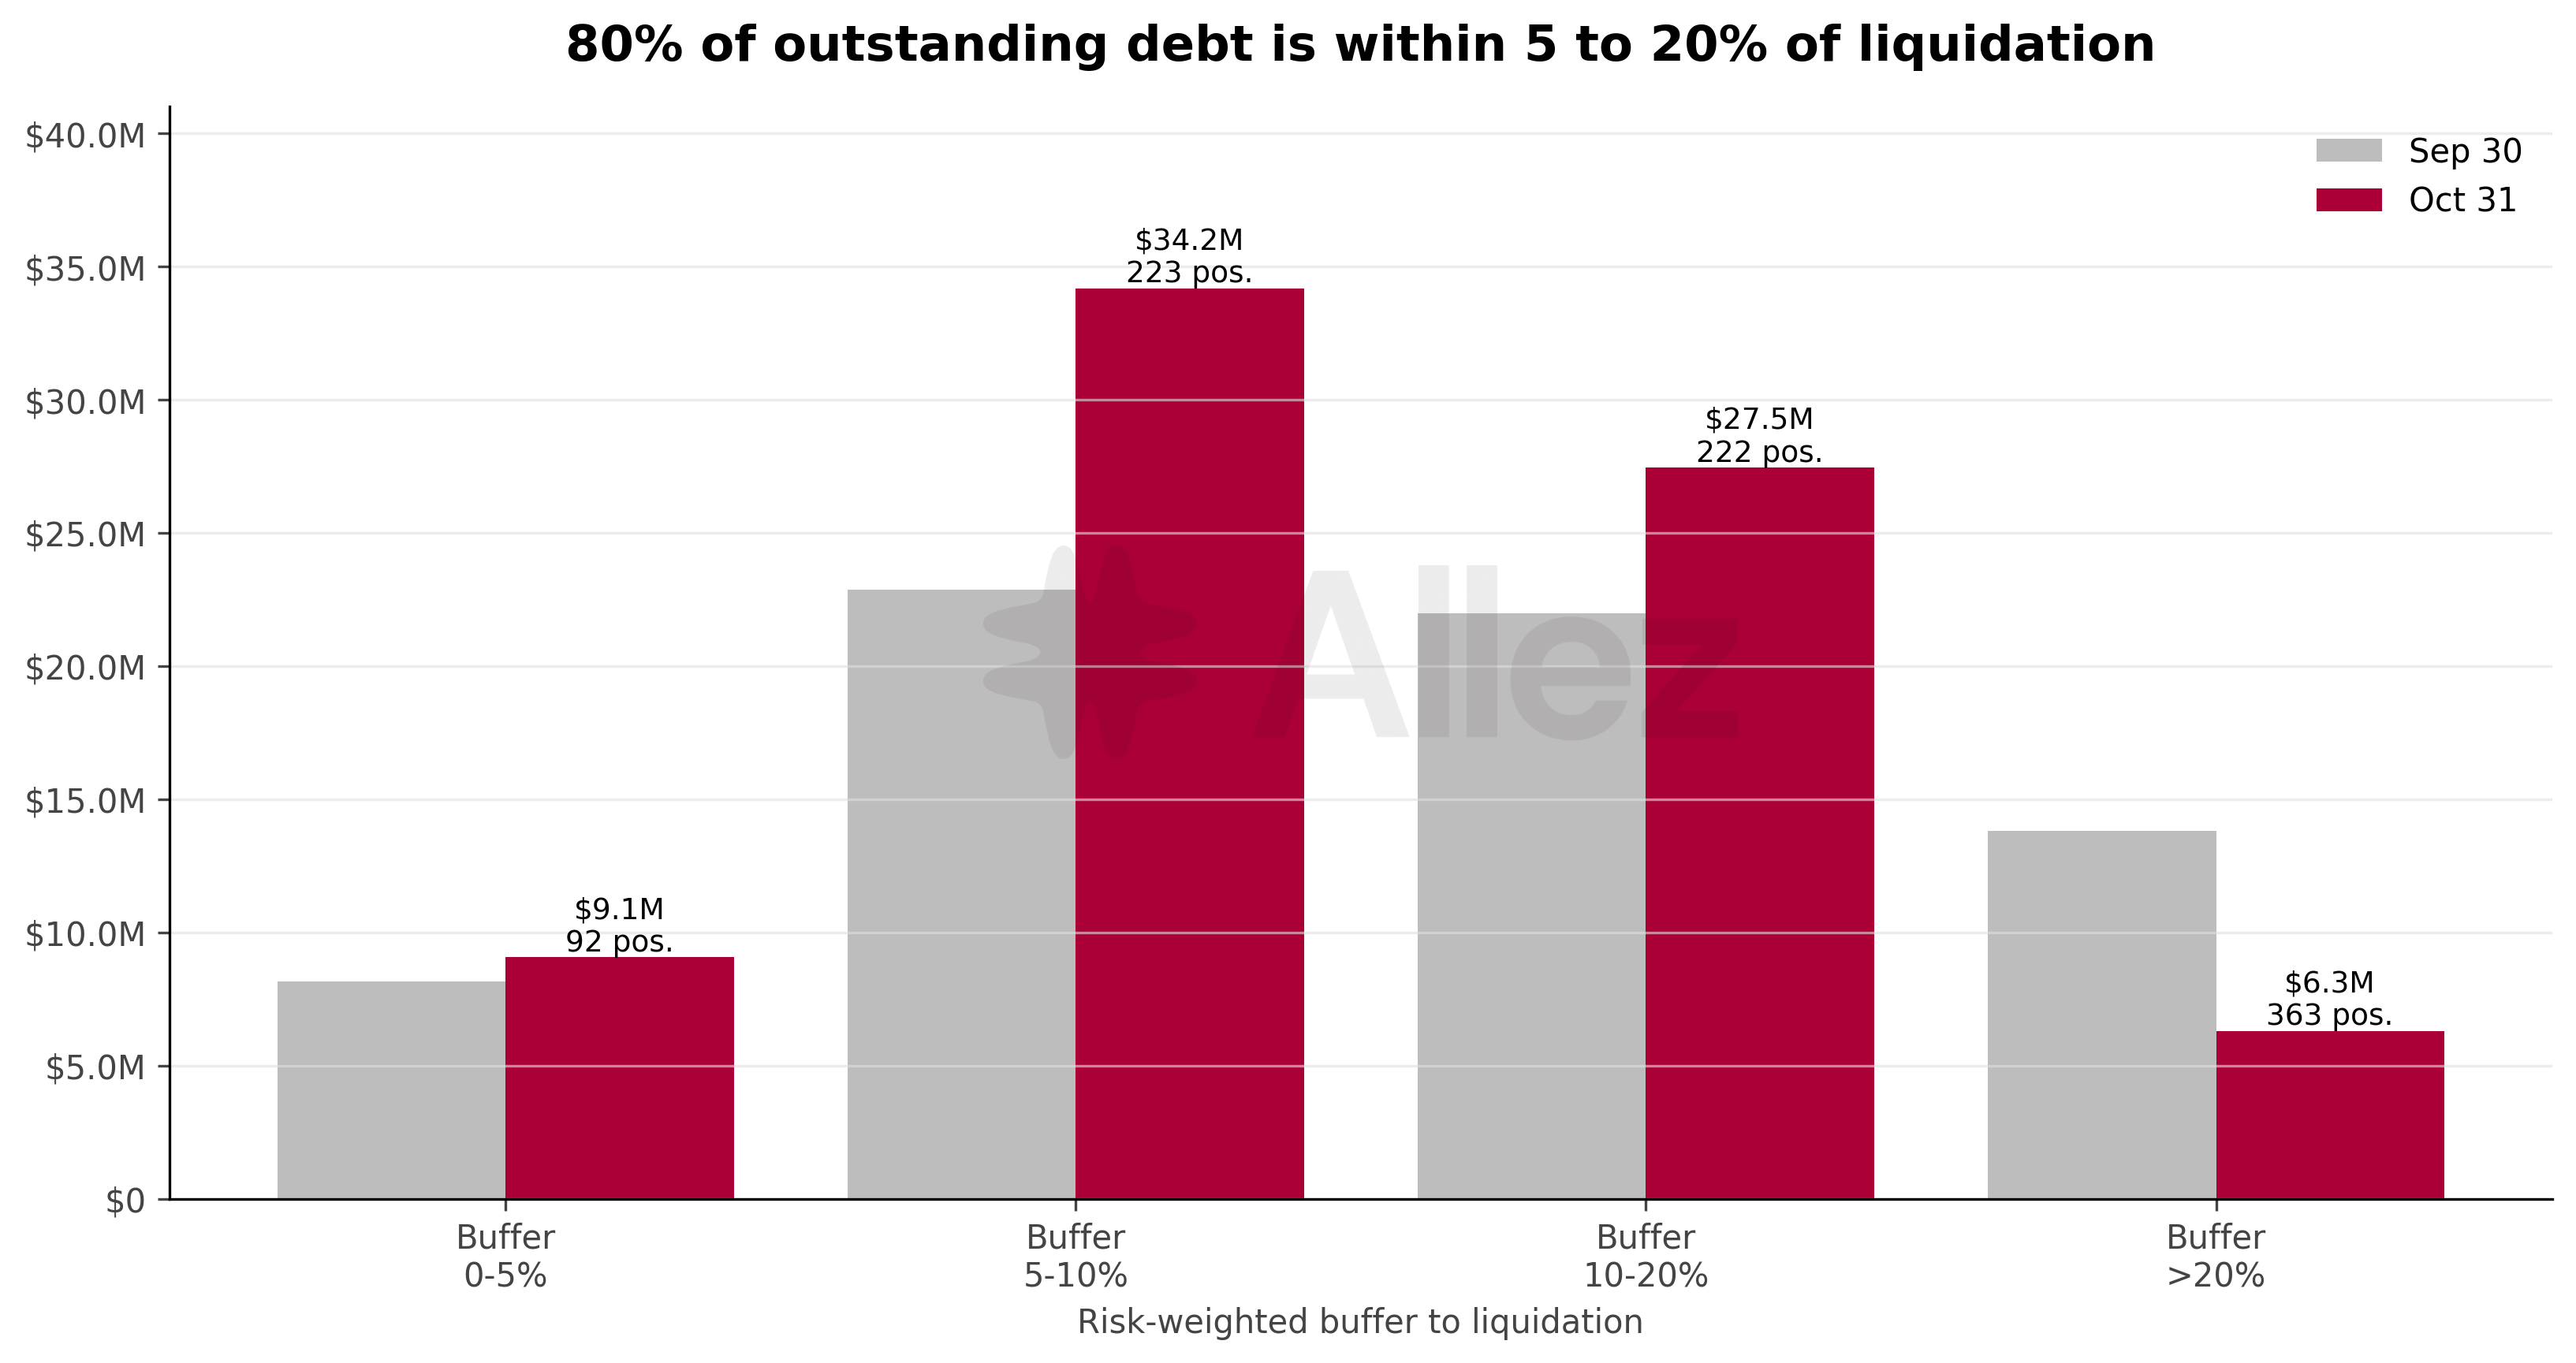
| Buffer to liquidation | Sep 30 debt | Oct 31 debt | MoM | Oct 31 positions |
|---|---|---|---|---|
| 0 to 5% | $8.16M | $9.07M | +11.1% | 92 (+10) |
| 5 to 10% | $22.85M | $34.18M | +49.6% | 223 (+21) |
| 10 to 20% | $21.98M | $27.45M | +24.9% | 222 (+3) |
| Above 20% | $13.81M | $6.30M | -54.4% | 363 (+17) |
The liquidation buffer measures how far a position is from its liquidation threshold, based on current market prices and the protocol's collateral and borrow weights.
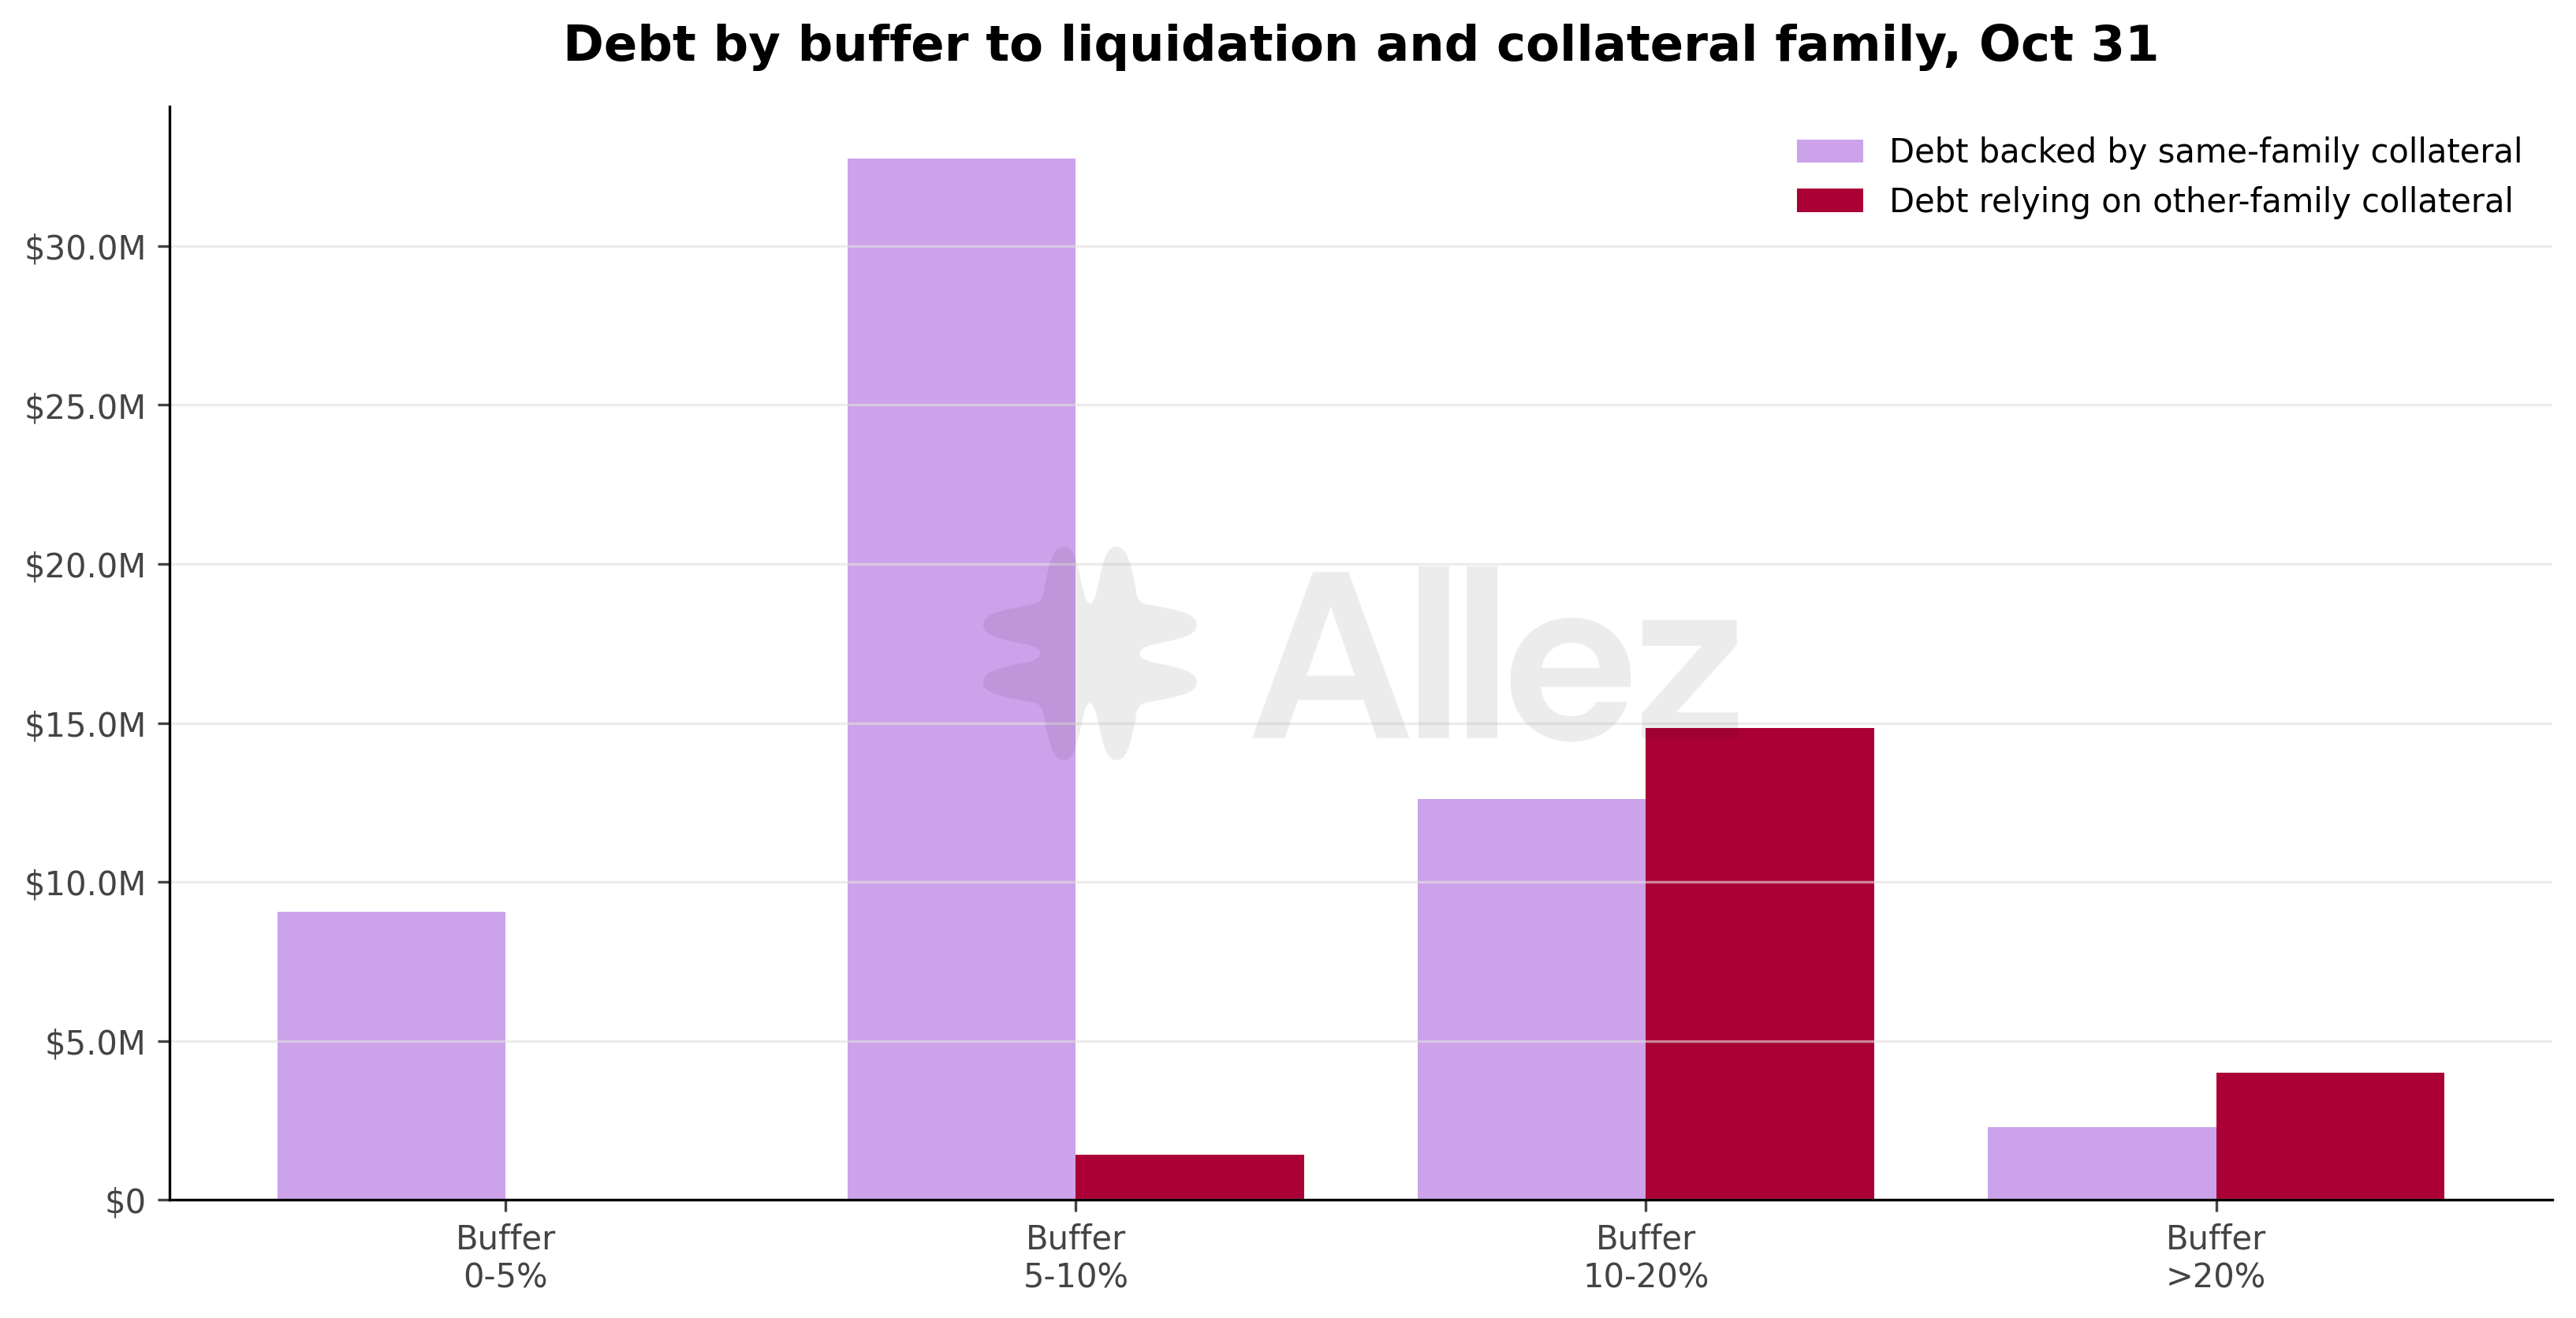
Correlated debt is backed by collateral from its own price family: stablecoins, SUI and SUI LSTs, or BTC. Its health moves little when both sides move together, and it can run close to liquidation. However, a price gap between the two sides still affects it. Uncorrelated debt relies on collateral from another family. A price move in either family changes its health.
| Within 10% of liquidation | Sep 30 | Oct 31 |
|---|---|---|
| Correlated debt | $30.6M | $41.8M |
| Uncorrelated debt | $0.4M | $1.4M |
Uncorrelated debt near liquidation rose from $0.4M to $1.4M, almost all of it in two general pool positions with liquidation buffers of 9% and 8%. Both are mostly stablecoin positions. One supplies $8.2M of USDC against $5.2M of stablecoin debt and $0.4M of SUI debt. The other supplies $5.2M of stablecoins and $2.1M of SUI against $5.0M of USDC debt, of which $1.0M relies on the SUI collateral. All uncorrelated debt remains more than 5% from liquidation.
Among single-family positions within 10% of liquidation, usdSUI/USDC leads with $8.4M in debt, followed by USDC/usdSUI ($6.5M), haSUI/SUI loops ($5.9M) and stablecoin loops ($5.4M). Of the 92 positions within 5% of liquidation, 85 are haSUI/SUI loops carrying $3.7M in debt. Four stablecoin loops account for another $5.2M.
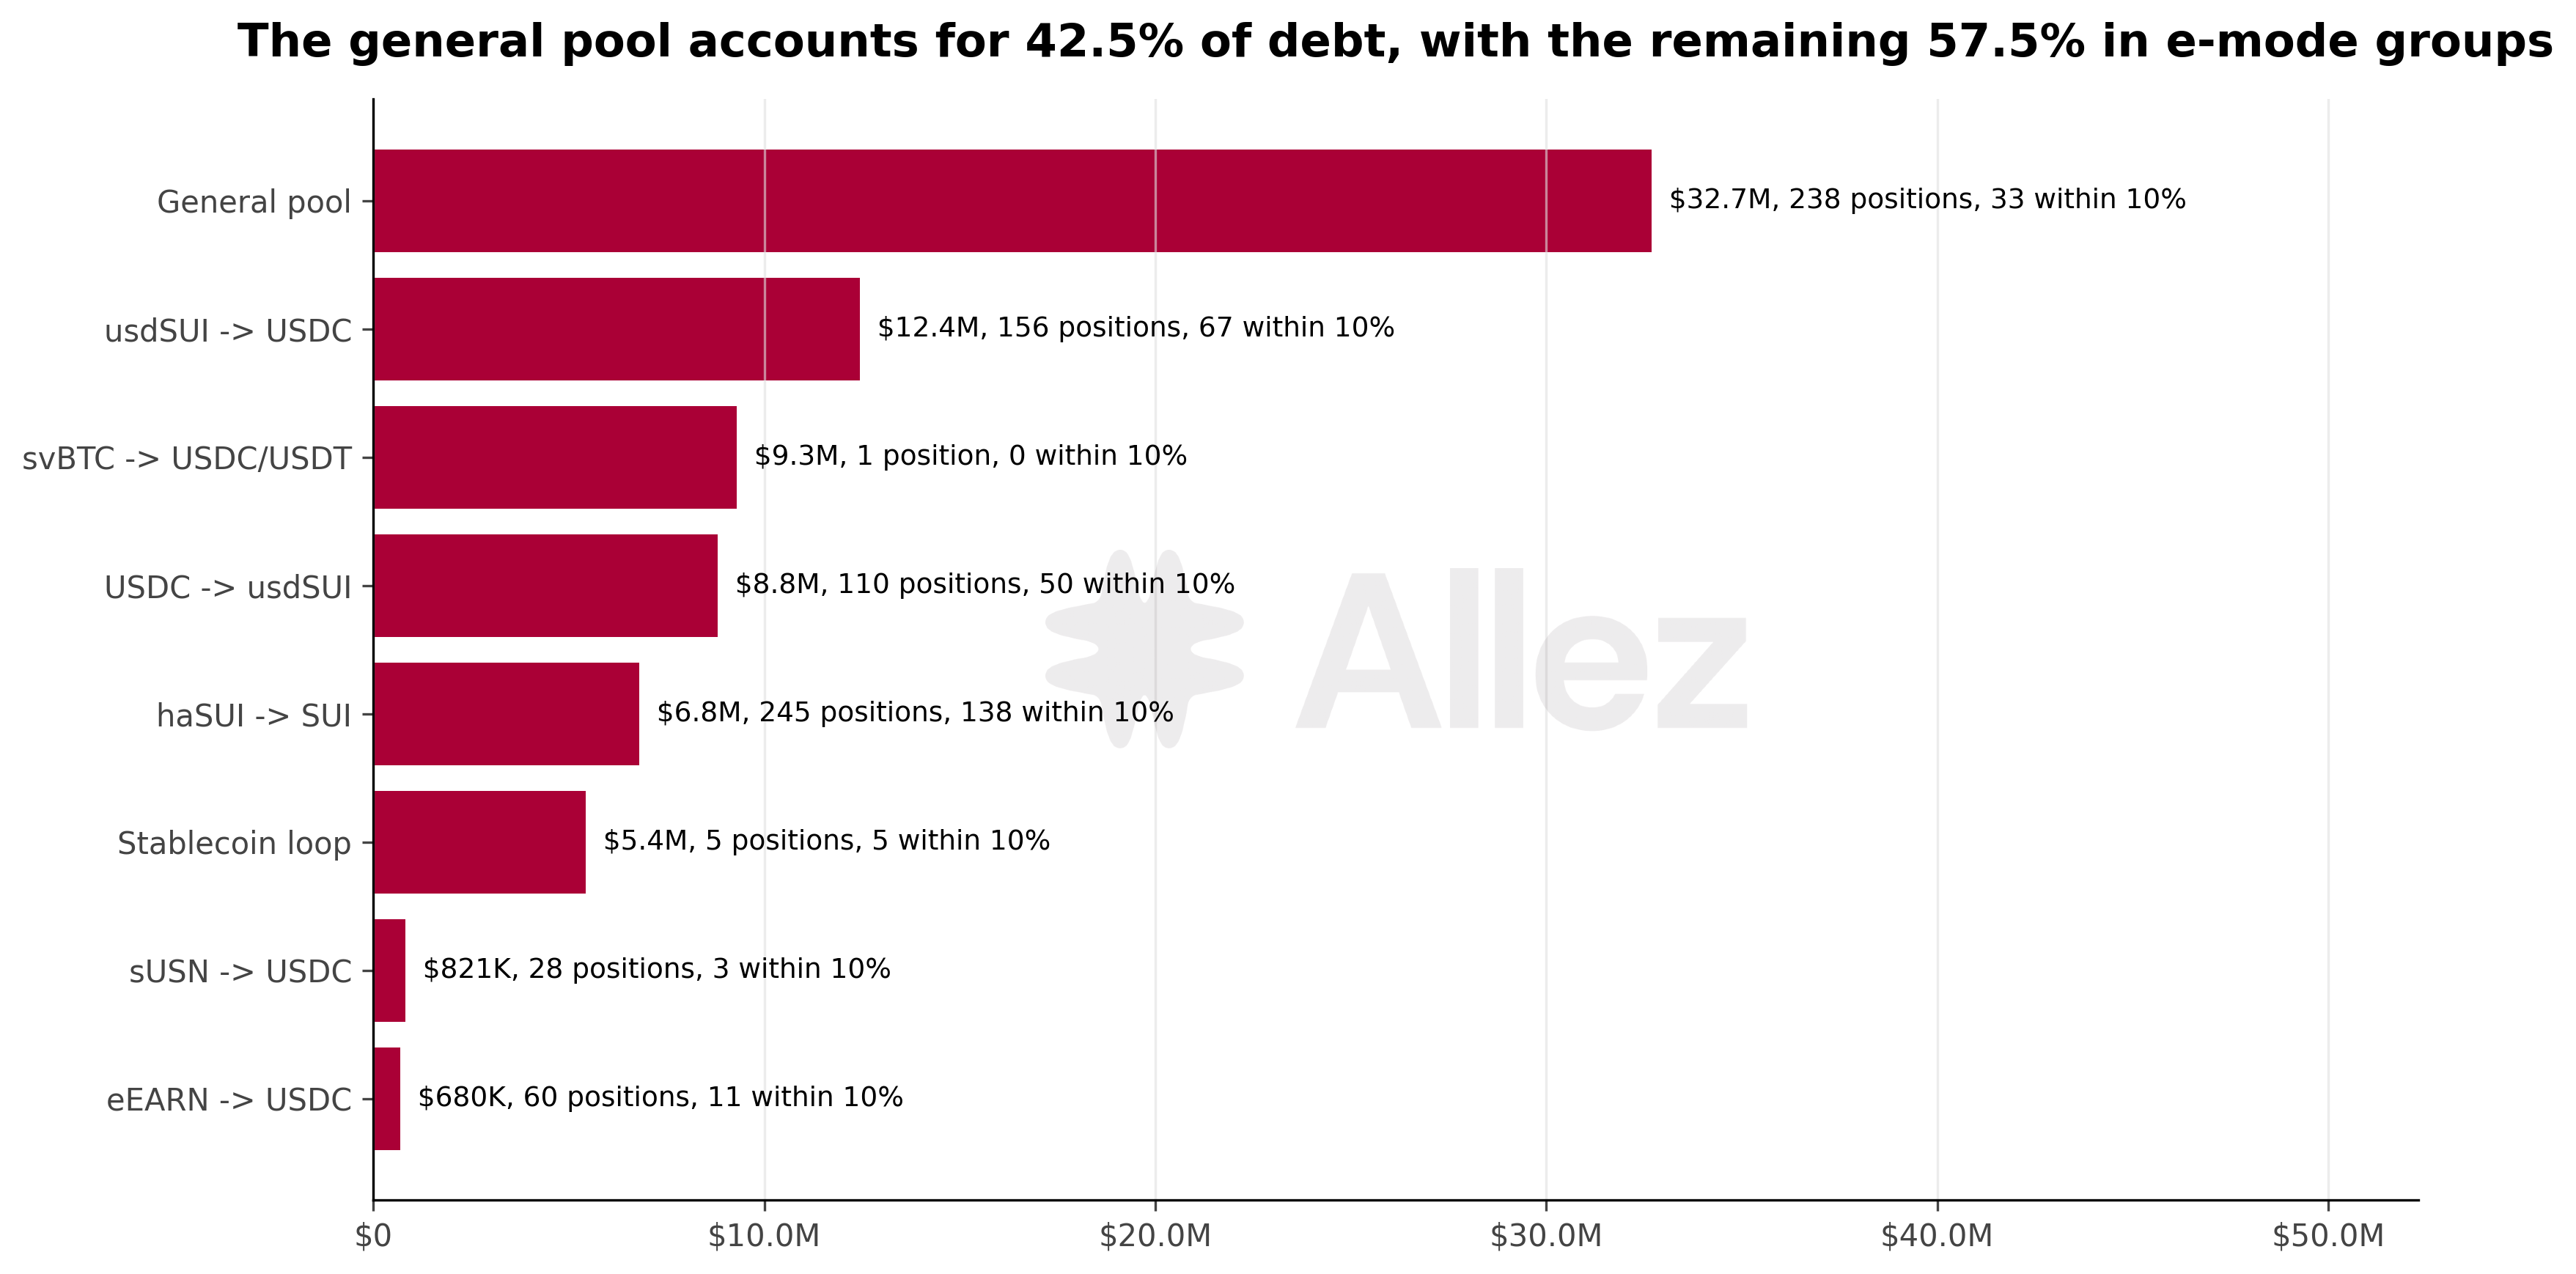
The general pool accounts for 43% of total debt ($33M across 238 positions), down from 45%. The usdSUI/USDC group carries $12M across 156 positions. Liquidation proximity is highest in haSUI/SUI, with 138 of 245 positions within 10% of liquidation.
Stress testing. Each scenario applies the specified price shock to volatile assets (SUI, LSTs, BTC and ETH) and holds stablecoin prices constant.
| Price shock | Collateral at risk, September | Collateral at risk, October | Potential bad debt | Positions at risk |
|---|---|---|---|---|
| -10% | $45 | $796 | $0 | 5 |
| -20% | $122K | $15.4M | $0 | 25 |
| -30% | $4.8M | $20.6M | $941 | 46 |
| -40% | $19.9M | $20.3M | $304K | 74 |
| -50% | $17.6M | $18.2M | $2.0M | 93 |
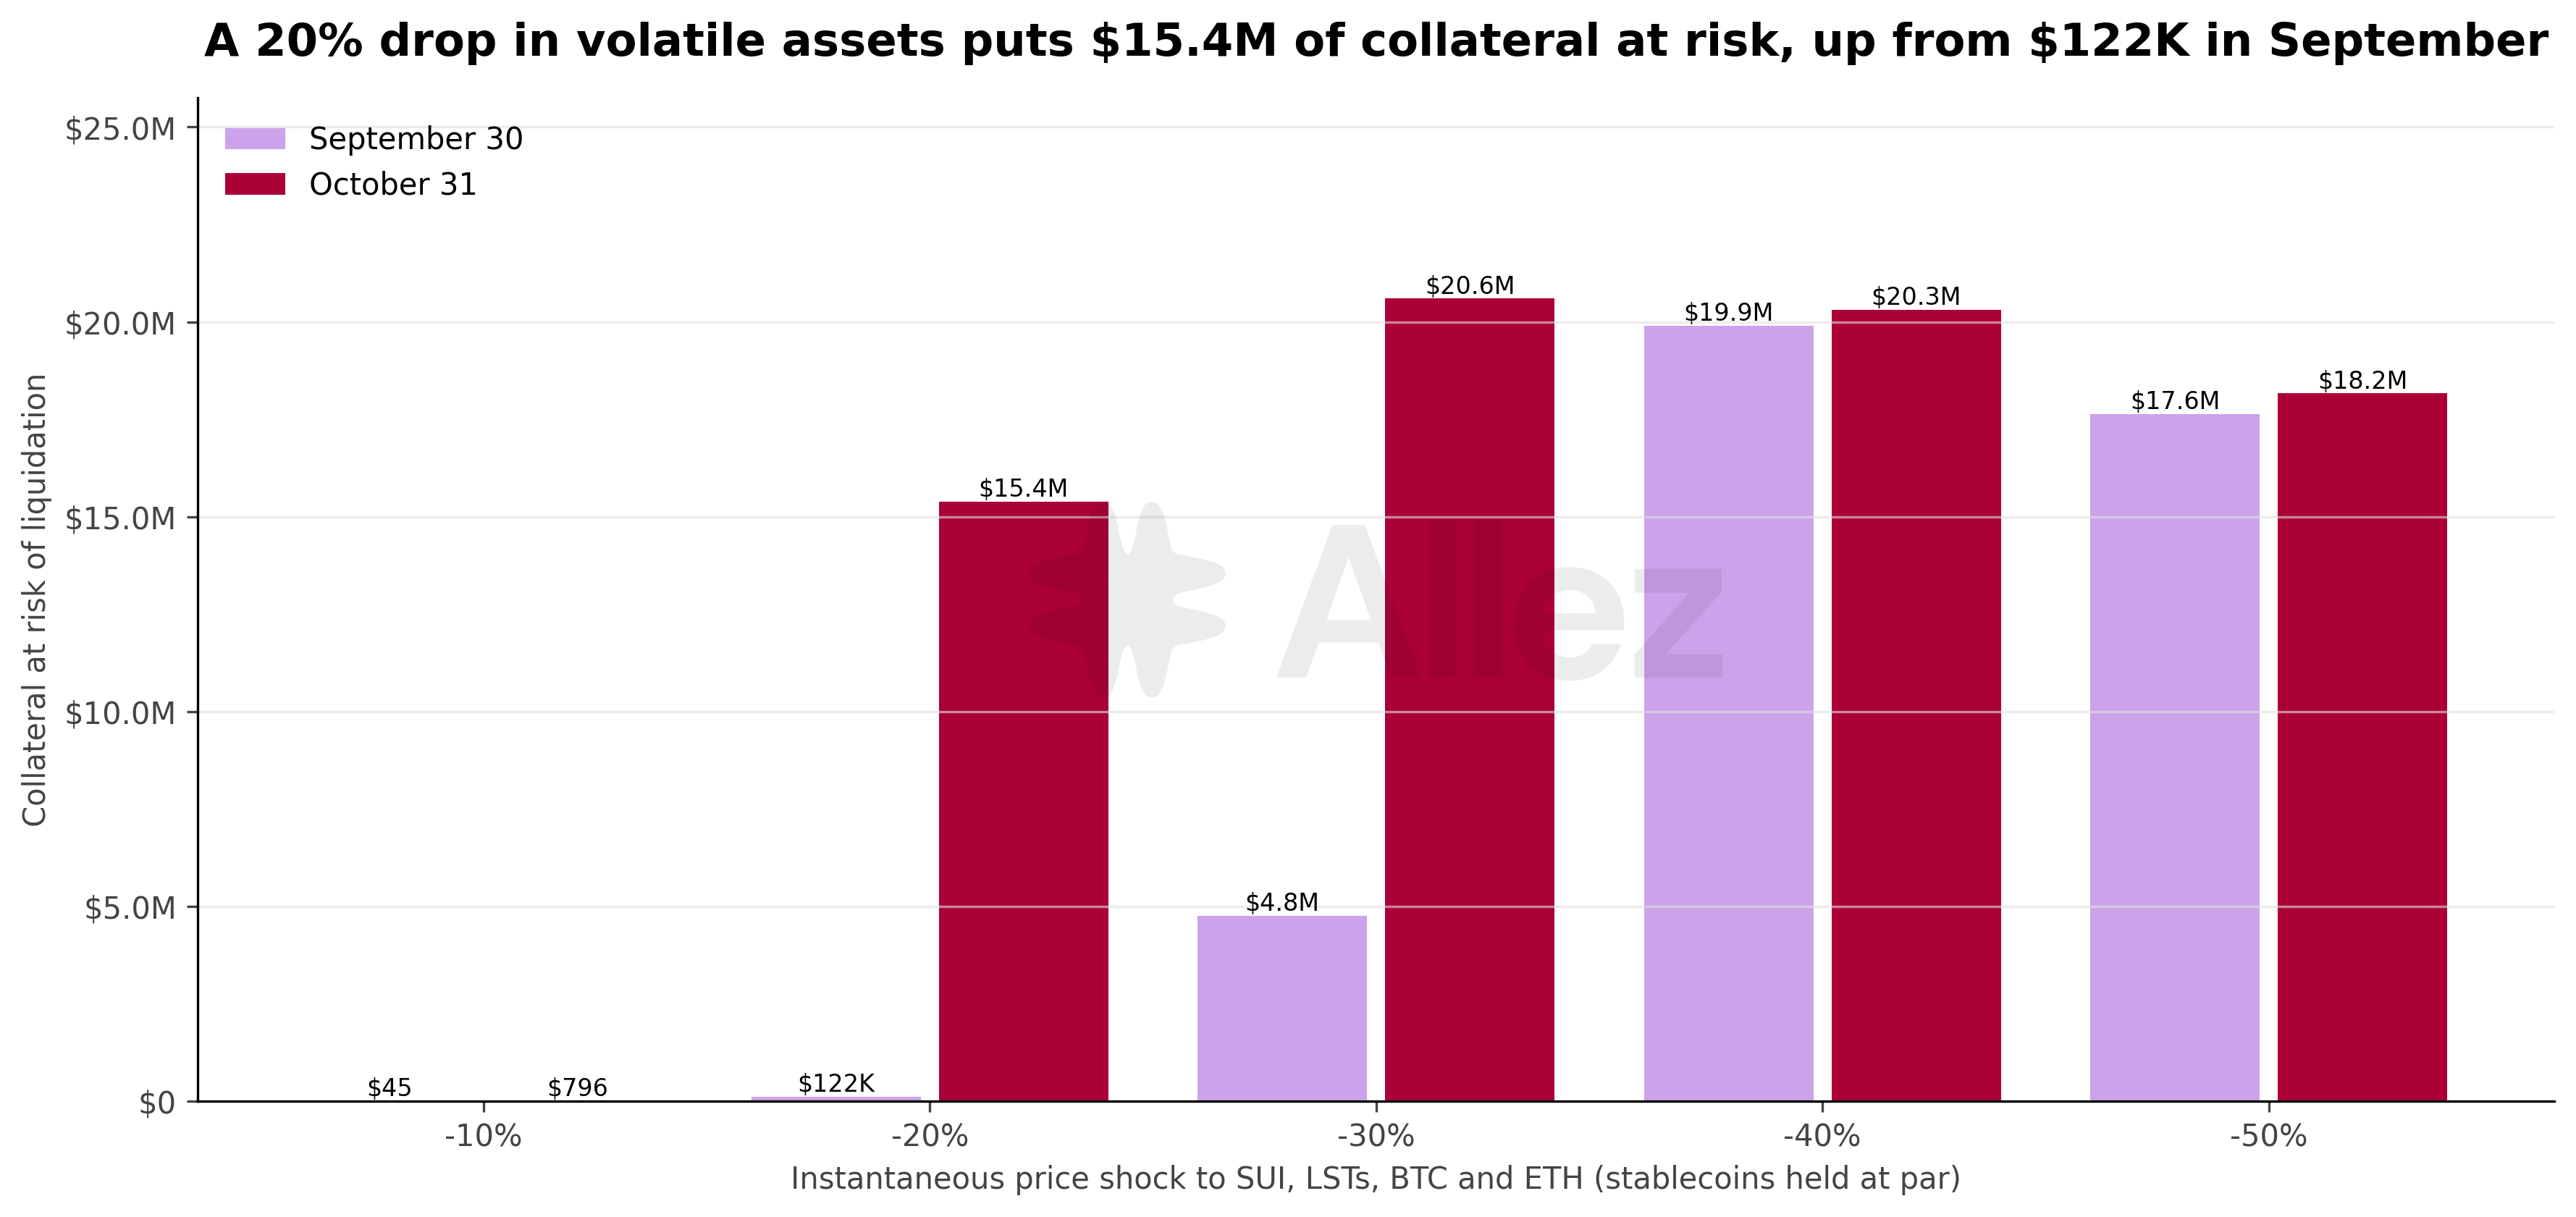
A 20% drop across volatile assets would put $15M of collateral at liquidation risk, up from $0.1M in September. One BTC-backed position borrowing $9M of stablecoins accounts for $12M of it, and one general pool position borrowing USDC against SUI for $3M. At a 30% drop, collateral at risk reaches $21M, up from $5M.
A 5% usdSUI depeg would push two stablecoin loops holding $3.5M of collateral into liquidation territory, unchanged from September. At a 10% depeg, collateral at risk rises to $15M, from $11M.
Liquidations (October):
| Metric | September | October |
|---|---|---|
| Events | 31 | 10 |
| Positions liquidated | 12 | 3 |
| Debt repaid | $4,514 | $179 |
| Collateral seized | $4,779 | $189 |
| Largest repayment | $982 | $55 |
SUI's price decline drove 9 of the 10 liquidations, across two SUI/USDC positions with $124 in debt repaid. Five occurred on October 29 and 30, near SUI's monthly low.
5. Activity and Volume
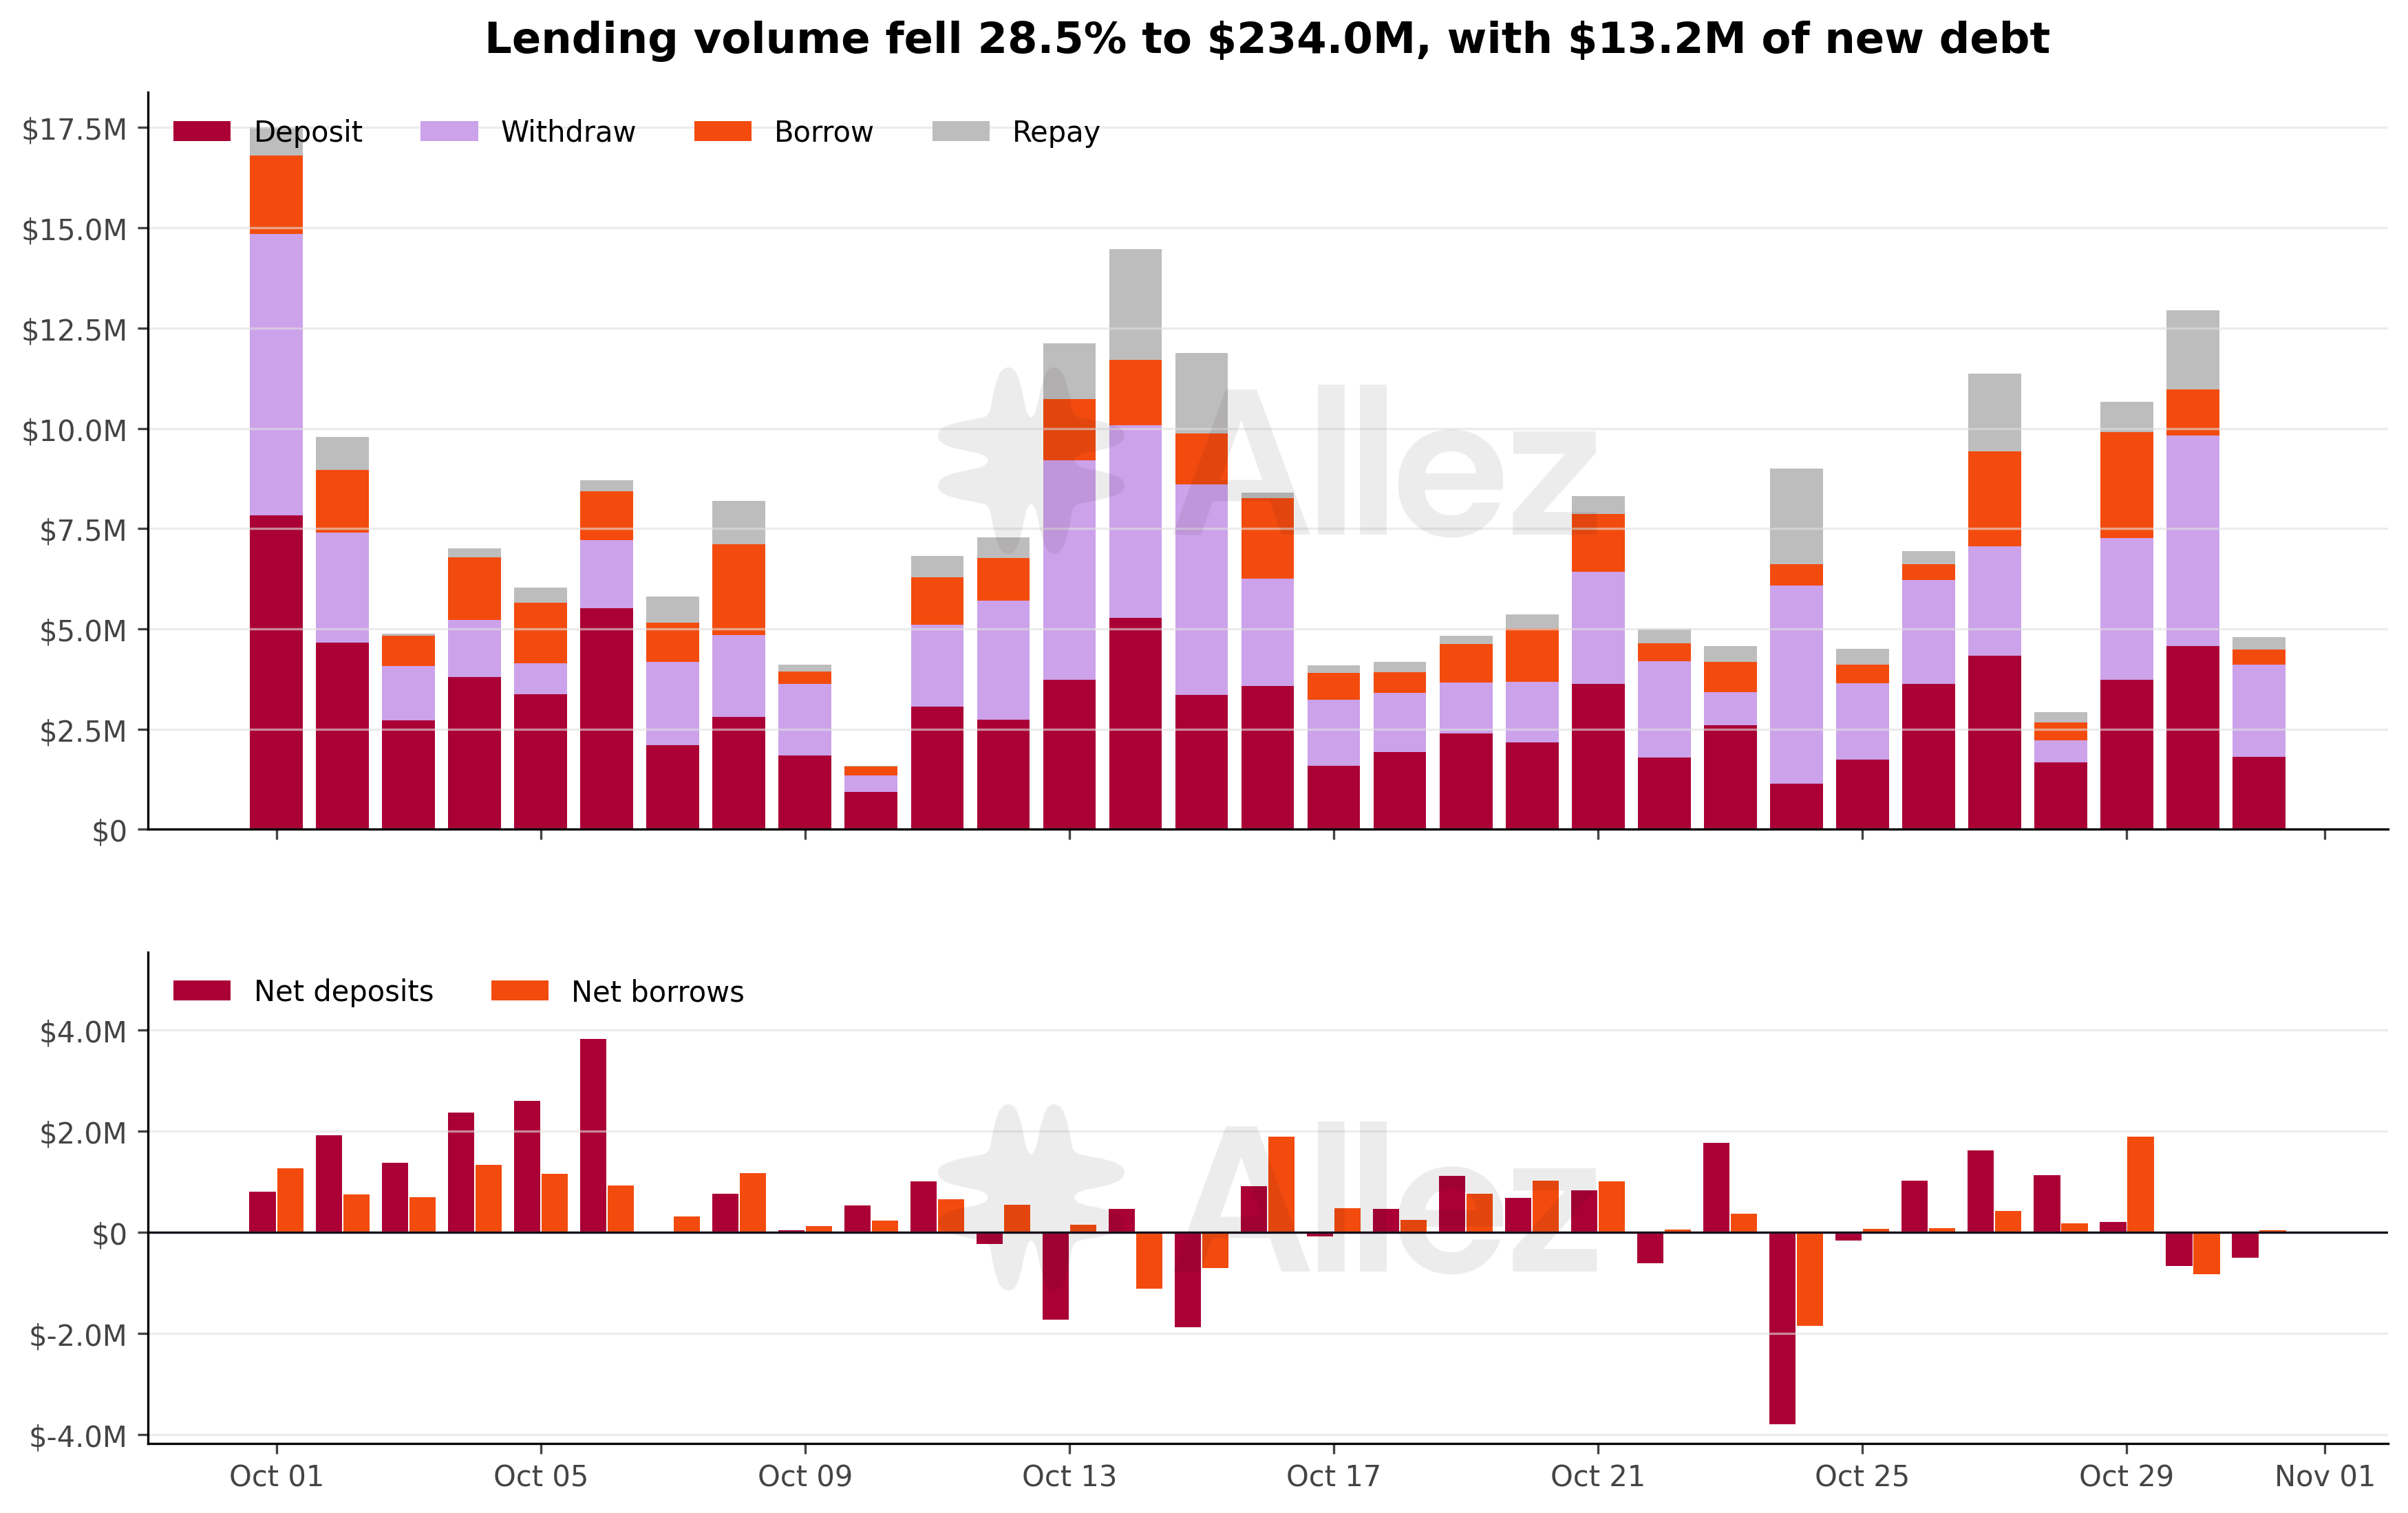
| Type | September | October | MoM |
|---|---|---|---|
| Deposit | $140.7M | $96.0M | -31.8% |
| Withdraw | $100.7M | $80.2M | -20.3% |
| Borrow | $53.1M | $35.5M | -33.2% |
| Repay | $32.8M | $22.3M | -32.1% |
| Lending volume | $327.3M | $234.0M | -28.5% |
| Flash loans (excluded) | $33.9M | $31.3M | -7.7% |
Activity slowed after a strong September, when supply grew 65% and passed $100M for the first time. Net deposits came to $16M in October, down from $40M, and net borrowing to $13M, down from $20M. Activity peaked on October 1 at $18M, with deposits and withdrawals accounting for roughly equal volumes.
Deposit, withdrawal, borrow and repay events declined 37% to 28,497. Monthly active borrowers fell from 358 in September to 306.
6. Revenue and Utilization
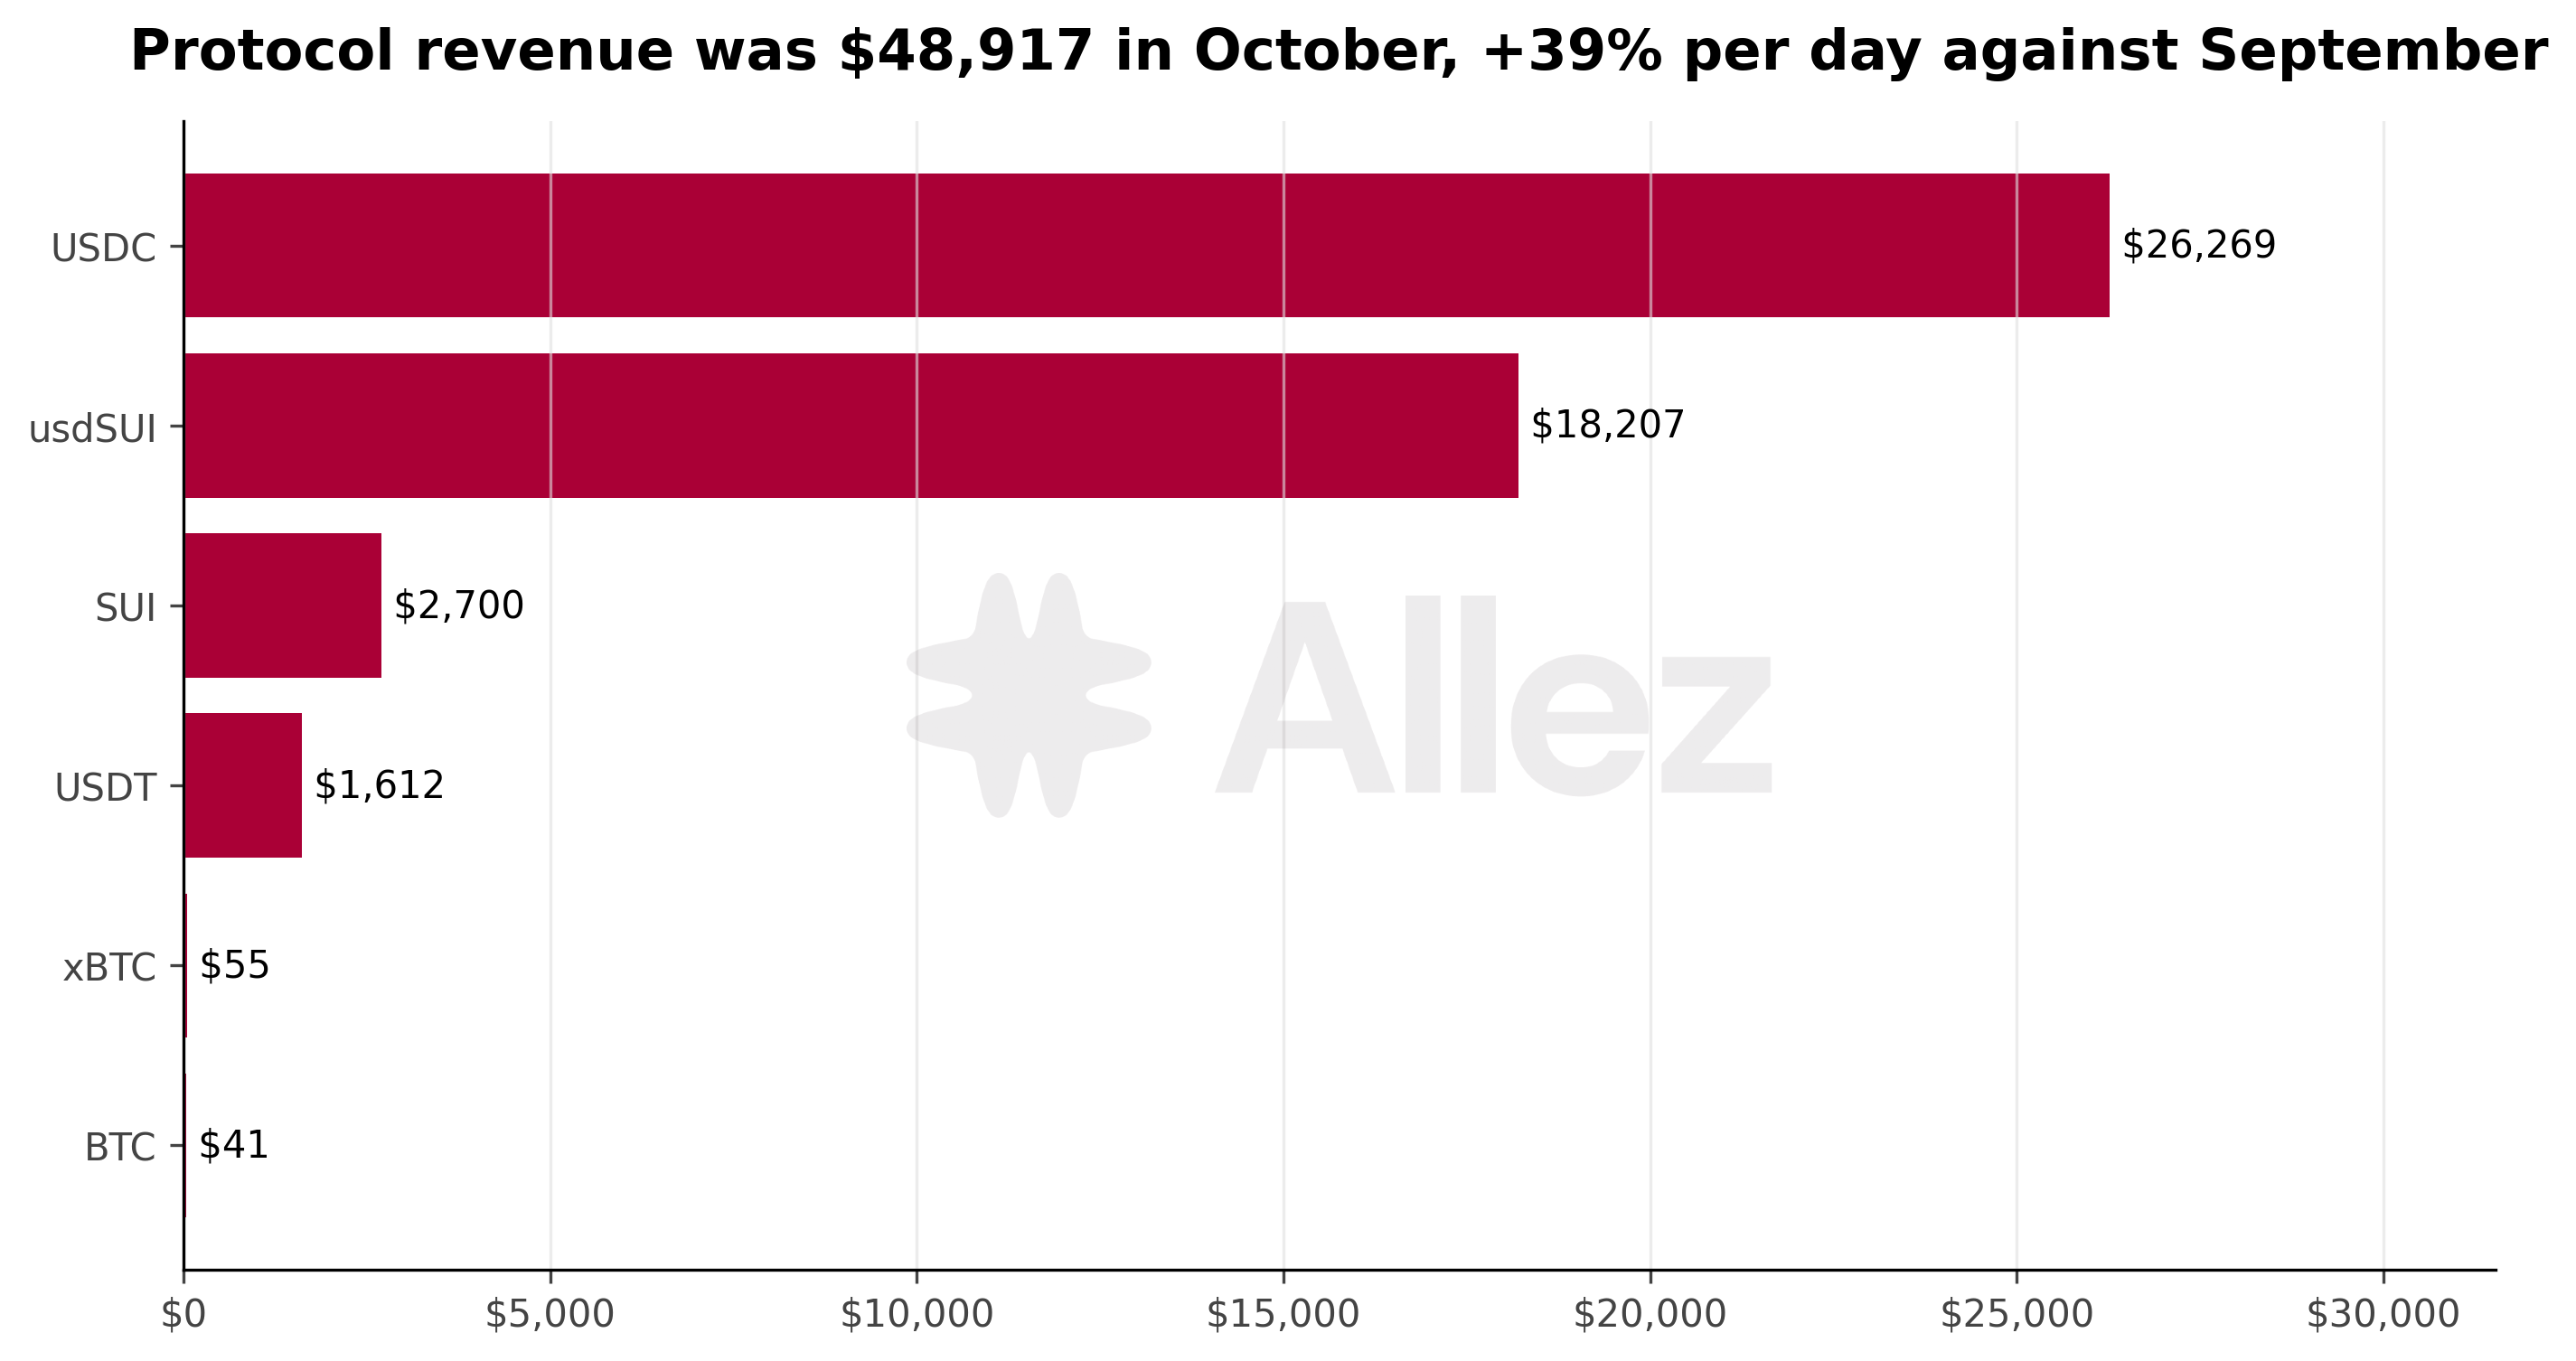
Protocol revenue reached $49K in October. Average daily revenue rose 30% to $1.6K, from $1.2K in September. USDC contributed $26K and usdSUI $18K, together 91% of the total. SUI added $2.7K and USDT $1.6K. Daily revenue rose from $1.5K on October 1 to $1.7K on October 31, in line with debt.
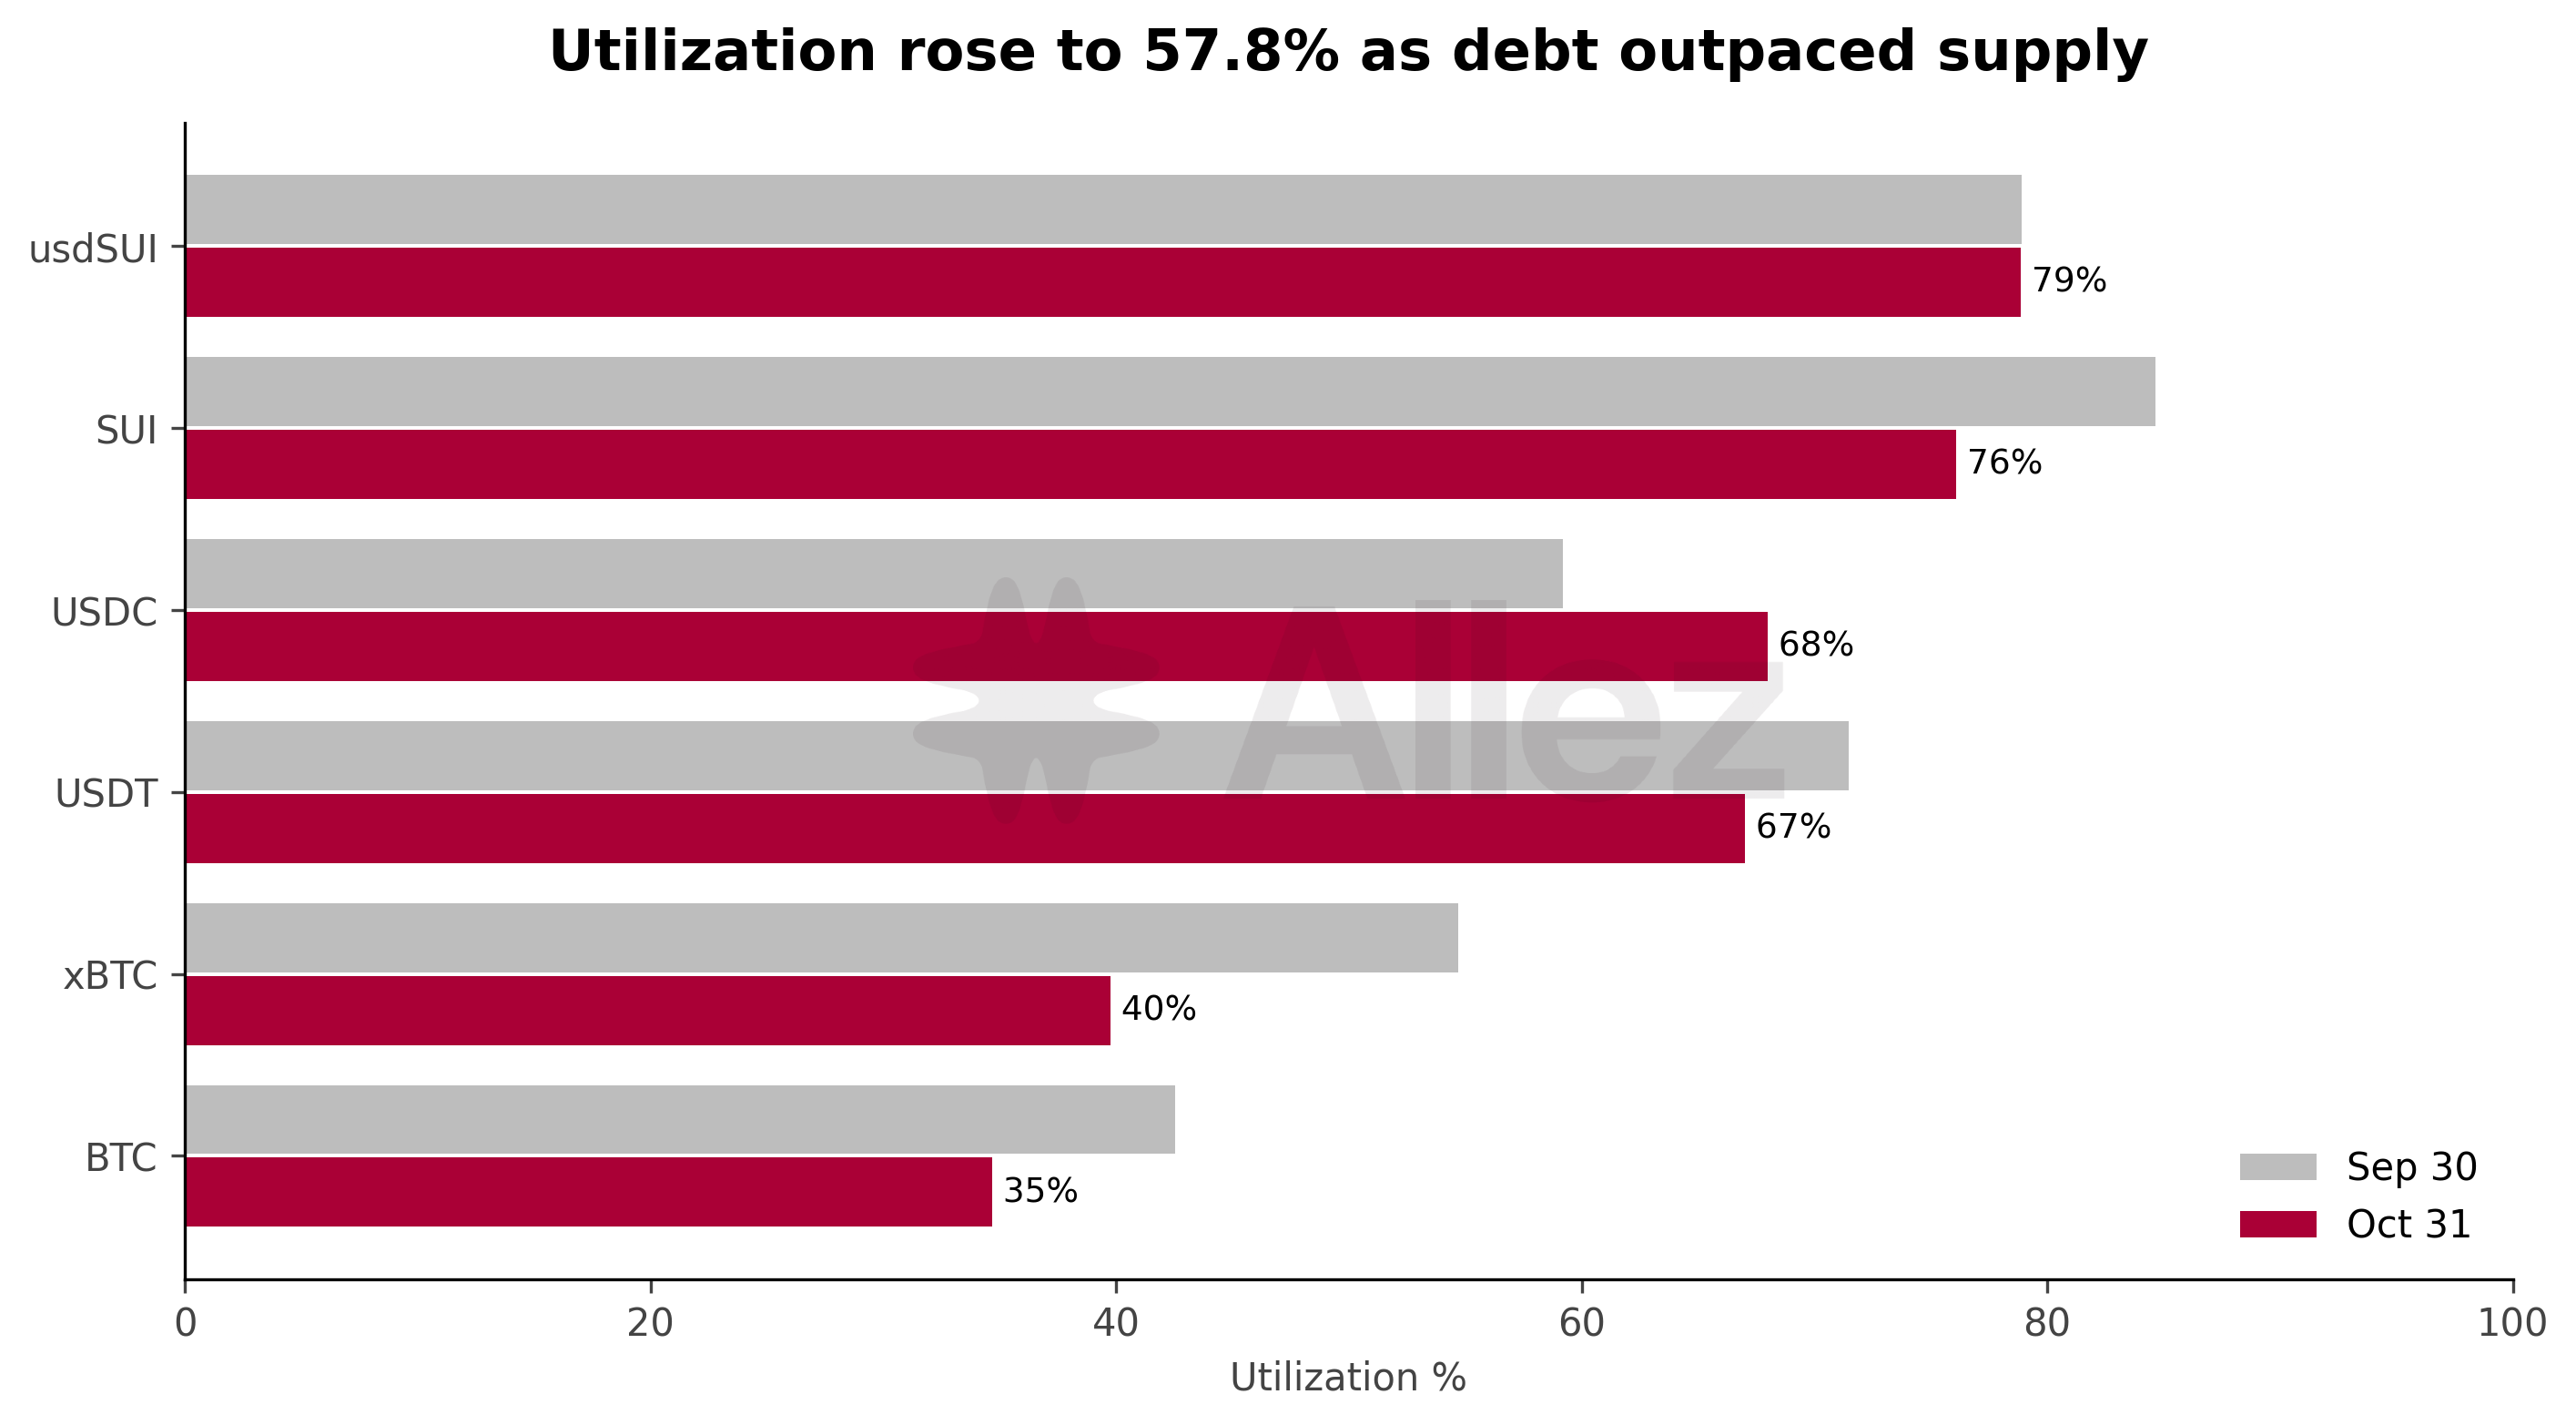
| Reserve | Utilization Sep 30 | Utilization Oct 31 | Borrow APY Oct 31 |
|---|---|---|---|
| SUI | 84.7% | 76.1% | 0.98% |
| usdSUI | 78.9% | 78.9% | 5.06% |
| USDT | 71.5% | 67.0% | 4.37% |
| USDC | 59.2% | 68.0% | 4.42% |
| xBTC | 54.7% | 39.8% | 0.50% |
| BTC | 42.5% | 34.7% | 0.50% |
USDC utilization climbed from 59% to 68%, with borrowing up $5.8M against $1.6M in new deposits. SUI utilization fell to 76% following a 41% increase in token-denominated supply. usdSUI remained the most utilized major reserve at 79%.
7. Conclusions and Forward Look
Current Finance continued to grow in October despite SUI falling 23%. New deposits offset the decline in collateral value, while borrowing expanded faster than supply. Much of that growth came from correlated loops, which remained relatively insulated from the drawdown as collateral and debt repriced together.
Falling prices still pushed some debt closer to liquidation. Uncorrelated debt within 10% of liquidation rose from $0.4M to $1.4M.
In October, Current raised the USDC borrow cap, bringing utilization of the cap down from 88% to 84%.
Outlook. In November, we will continue to monitor stablecoin borrowing. usdSUI debt is at 92% of its unchanged borrow cap, and USDC debt at 84% of its raised cap.
Appendix: Methodology and Scope
-
Window. October 1 to 31, 2026 (UTC), compared with September. Month-end figures use the 23:00 UTC snapshots on October 31 and September 30.
-
Pricing. Balances are valued at each hour's oracle price. Where an oracle had stopped updating, the report values the asset at a market reference price.
-
Supply and debt changes are split into a quantity effect (token change × month-end price) and a price effect (September balance × price change).
-
Position health uses each position's collateral and borrow weights in its market and e-mode group, as configured at each month-end. Debt includes accrued interest.
-
Correlated debt is covered by risk-weighted collateral from its own price family (stablecoins, SUI and LSTs, or BTC). Debt that relies on collateral from another family is uncorrelated. A single position can hold both.
-
Stress tests apply an instantaneous shock to the named assets for positions as of October 31 and September 30. Collateral at risk is the post-shock collateral of positions that become eligible for liquidation. Potential bad debt is debt in excess of collateral. Liquidation incentives and price impact are not modelled.
-
Lending volume sums deposits, withdrawals, borrows and repayments at each day's price, and excludes flash loans.
-
Revenue is the daily growth in protocol reserves, plus same-day treasury withdrawals, at each day's price. The September average covers September 2 to 30.
-
Coverage. Position figures (sections 3 and 4) cover all markets. Reserve tables cover the Main market.
| Category | Assets |
|---|---|
| Stablecoins | USDC, usdSUI, USDT, sUSN, eEARN, USDY, FDUSD, USDB, sUSDe |
| SUI & LSTs | SUI, haSUI, afSUI, stSUI, vSUI (CERT), springSUI, eSUI |
| BTC | svBTC, xBTC, BTC, LBTC |
This report represents independent risk analysis by Allez Labs for the Current Finance community.
Prepared by: Allez Labs Risk Team
Report Date: November 2026